
A SCIENTIFIC HYPOTHESIS |
■ is an educated guess that seeks to explain observed phenomena. |
■ makes clear predictions that can be arranged in “if … then” statements. |
■ must be testable repeatedly and independently. |
■ must be potentially refutable. |
■ can never be proved, but only supported or refuted. |
1.2 |
The Process of Science |
Scientific inquiry generally begins as an attempt to explain observations about the natural world. For example, since the 1970s, nutritionists have noticed that death from heart disease is less common in communities that eat a lot of fish and other seafood. In science, just as in everyday life, observations lead to questions, and questions lead to potential explanations. Why is fish consumption linked to better heart health? Could it be that a particular nutrient in fish protects people from heart disease? In the next section we see how the scientific method can be used to solve riddles of this sort.
Observations are the wellspring of science
Science aims to explain observations about the natural world. An observation is a description, measurement, or record of any object or phenomenon. We can study nature in many different ways: by looking through a microscope, diving to the ocean floor, walking through a meadow, studying satellite images of forest cover, running chemical tests with sophisticated instruments, or using remote cameras to photograph a secretive animal (FIGURE 1.6).
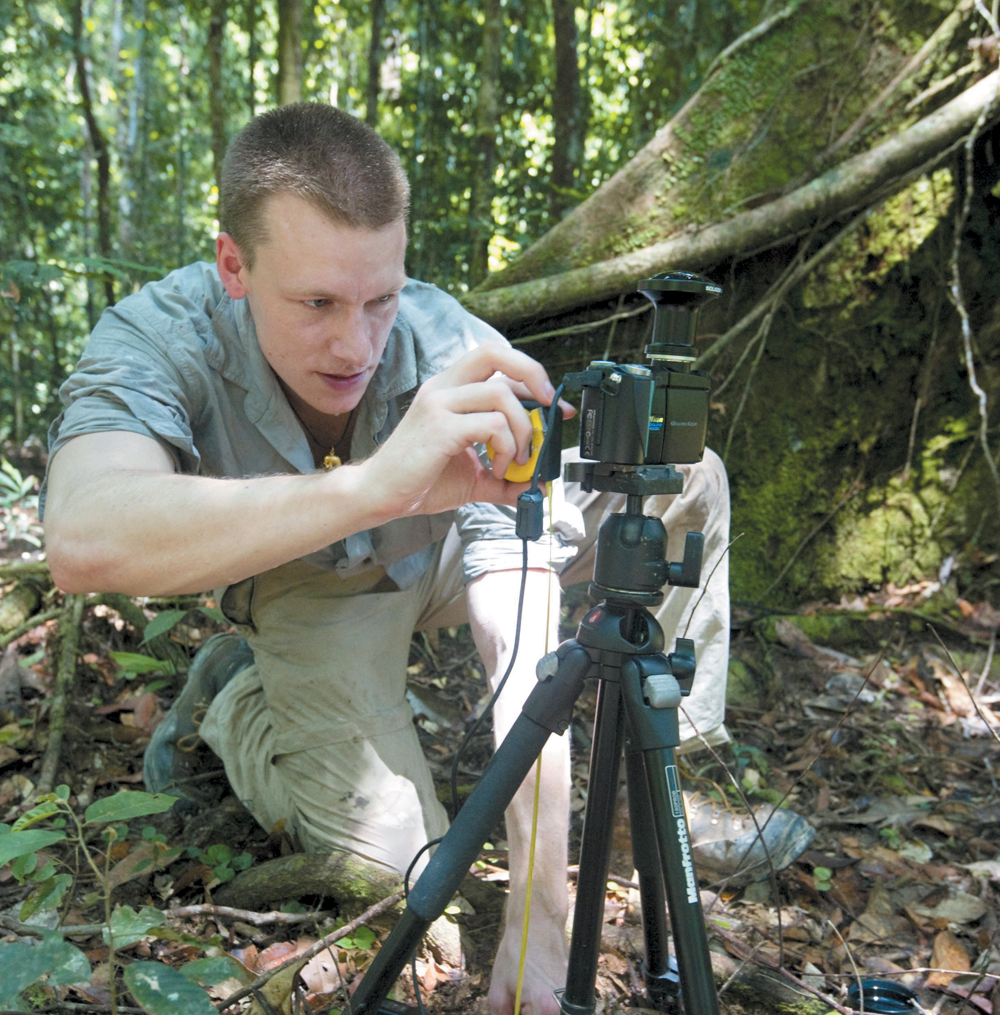
FIGURE 1.6 Through Observations, We Collect Descriptive Data and Find Patterns in Natural Phenomena
To be of any use in science, an observation must be reproducible: independent observers should be able to see or detect the object or phenomenon at least some of the time. Sightings of Sasquatch (“Big Foot”), for example, lack credibility precisely because fans of “cryptobiology” have failed to produce samples or recorded images or sounds that stand up to scrutiny by independent observers.
Observations of nature can be purely descriptive, reporting information (data) about what is found in nature: where, when, how much. Mapping the types of sea creatures found in different zones on a rocky shore, listing the flowers in bloom through the growing season in an alpine meadow, counting how many birds of prey and how many perching birds are found on an island—all these are examples of descriptive studies.
Observations take an analytical turn when they identify patterns in nature and ask what causes those patterns. As examples, people who eat a lot of fish seem to have better heart health than those who do not each much fish (FIGURE 1.7). One species of small barnacles is always found above the high-tide mark, but a related species is seen only low on the shoreline. Yellow-flowered plants bloom earlier than red-flowered ones in a particular alpine meadow. Perching birds always outnumber birds of prey.
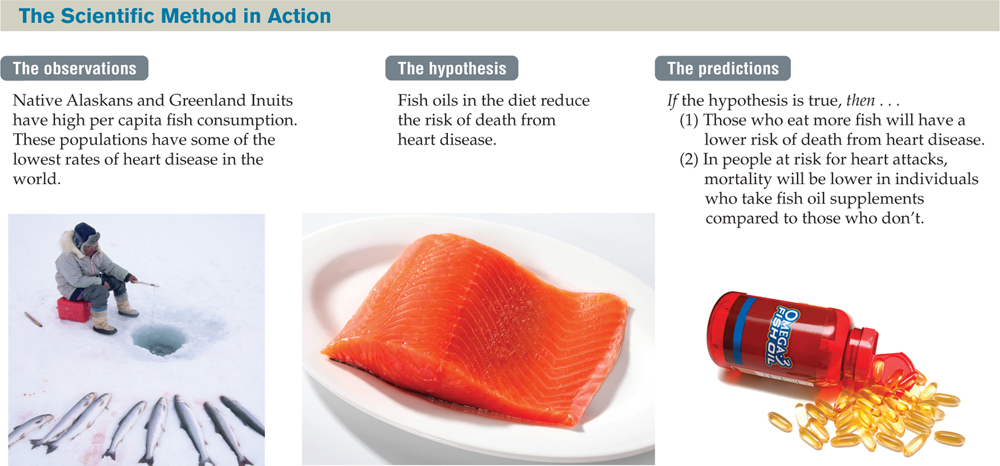
FIGURE 1.7 The Scientific Method Begins with Observations, Hypothesis, and Predictions
Scientific hypotheses make clear-cut predictions
A scientific hypothesis is an informed, logical, and plausible explanation for observations of the natural world. Investigators know what is plausible, or possible, if they have a good understanding of what is already known; that is why a new scientific hypothesis is often called an educated guess. Keeping established knowledge in mind helps researchers to avoid “reinventing the wheel” and to choose among alternative, arriving at one that is most probable.
A well-constructed hypothesis should be stated clearly and should avoid vagueness or ambiguity. For example, “Fish is good for you” is too vague. What is meant by “good”? How would someone test for “goodness”? Now consider a more precisely worded hypothesis: “In a large and representative population of humans, individuals who eat fish regularly are less likely to die of heart disease than those who consume little or no fish.”
A precisely stated hypothesis enables clear-cut predictions, which are essential for testing that hypothesis. Predictions made by scientific hypothesis can be cast as “If . . . then” statements. To frame these predictions, the investigator asks, “If my hypothesis is correct, then what else can I expect to happen?” For the hypothesis shown in Figure 1.7, we can make this prediction: If it is true that fish consumption is good for heart health, then in a large population of humans, individuals who consume more fish will have a lower risk of death from heart disease than will individuals who consume little or no fish.
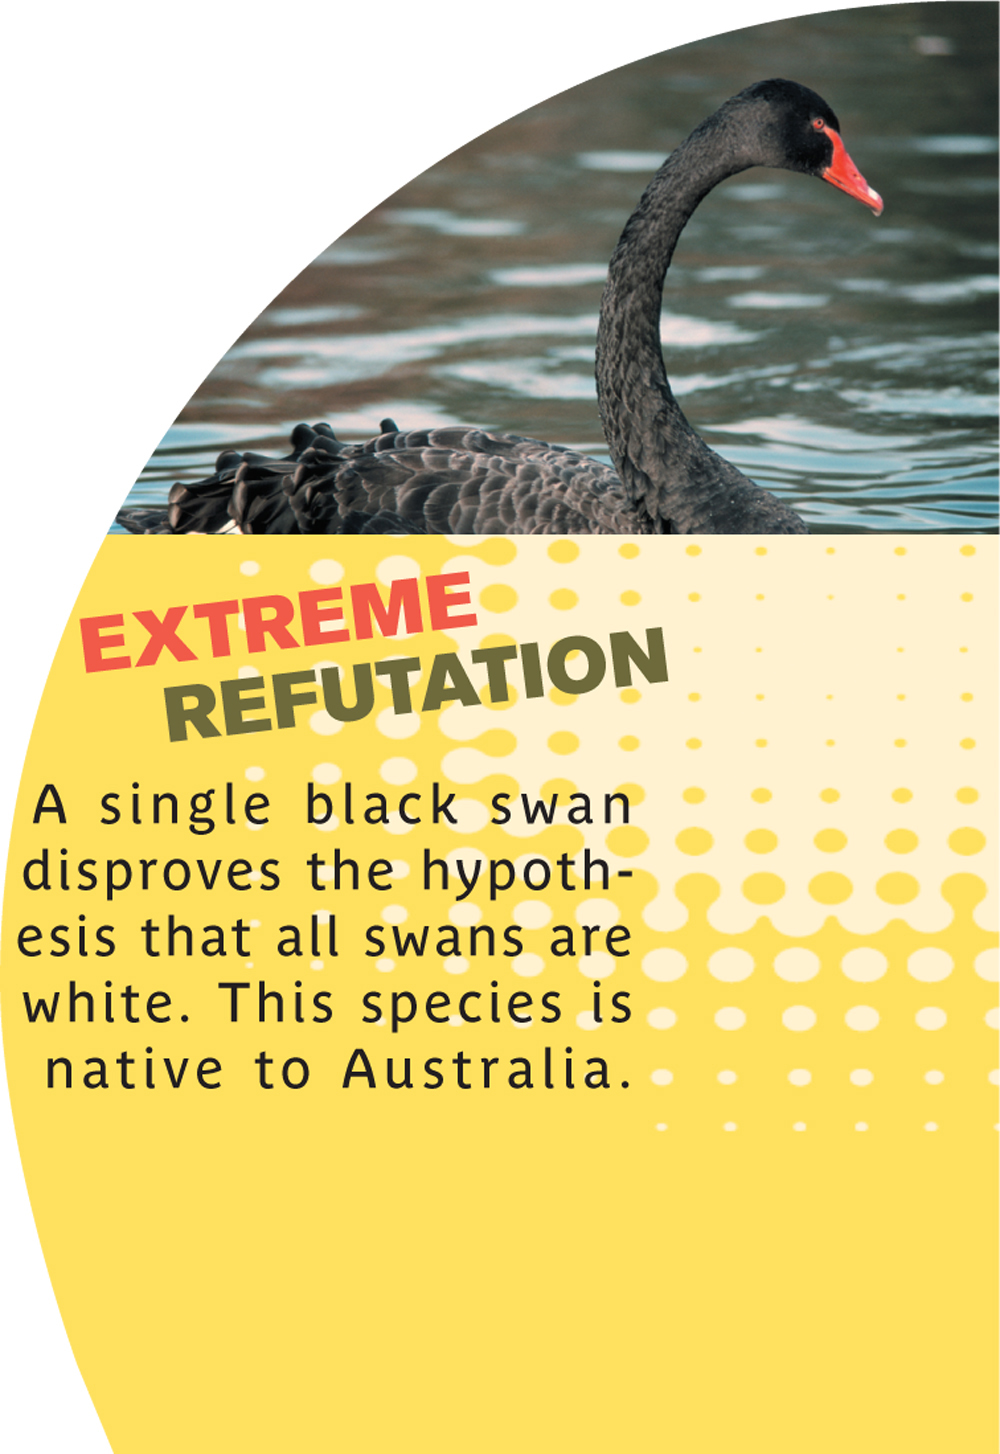
Scientific hypotheses must be refutable but cannot be proved beyond all doubt
It should be possible—at least in principle—to show that a scientific hypothesis is false. A classic example of a refutable hypothesis is the statement “All swans are white.” Finding a single black swan would show this hypothesis to be false (as it happens, there is a species of swan in Australia that is black).
Irrefutable hypotheses are common in pseudoscience, which is the practice of using arguments that sound vaguely scientific without actually using the scientific method. Consider this claim: space aliens are among us, but because of their advanced extraterrestrial technology, humans cannot detect them. There is no way to test this hypothesis, and there is no way to show it to be false either.
The hypothesis about the heart benefits of fish consumption is both testable and refutable. What if observational tests show that people who eat fish have higher odds of dying from heart disease than those who eat no fish at all, all other aspects of their lifestyle being equal? In this case, not only would the hypothesis lack supporting evidence, but we would know it to be false.
An experiment can provide strong support for a hypothesis, increasing our confidence that it is correct, but no hypothesis can be proved beyond all doubt (TABLE 1.3). One would have to know everything about everything to be certain that every test that could ever be devised would always support a certain hypothesis. Such certainty, of course, is not possible. Albert Einstein famously said, “No amount of experimentation can ever prove me right; a single experiment can prove me wrong.”
| TABLE 1.3 | Criteria for Scientific Hypotheses |
What if the original experimenter failed to take into account an important factor affecting the outcome of an experiment simply because he or she was unaware of its importance? For example, what if those who eat a lot of fish also eat less saturated fat, and it is lower fat consumption that protects against fatal heart disease rather than fish consumption per se?
Good researchers try to be alert to alternative explanations, but there is no guarantee that any and all complexities have been anticipated and accounted for by the investigator. In fact, unforeseen complexities, together with the limits imposed by the technologies of the day, are the most common reason that accepted ideas in science are sometimes overturned. However, our confidence in a hypothesis grows as many researchers—perhaps testing the same hypothesis in different ways and in different contexts—add their independent support.
Hypotheses can be tested with observational studies
We can test a hypothesis through observational studies or experiments or both. In studying nature, no matter what the approach, we focus on variables. A variable is any aspect of nature that is capable of changing. Fish consumption is a variable, as is death (mortality) from heart disease. Observations help us identify variables that are potentially interesting or that could potentially explain the patterns we might observe in nature. We can then design observational studies or experiments to tease out the relationship between any two variables.
The graph in FIGURE 1.8 is based on data pooled from several observational studies. The data show an association between fish consumption and the risk of dying from heart disease. But a question arises: Could this association be a coincidence? That is, could the link be a matter of chance? The researchers used the tools of statistics—a mathematical science that uses probability theory to estimate the reliability of data—to show it was very unlikely that the link between fish consumption and lower risk of death from heart disease was just random.
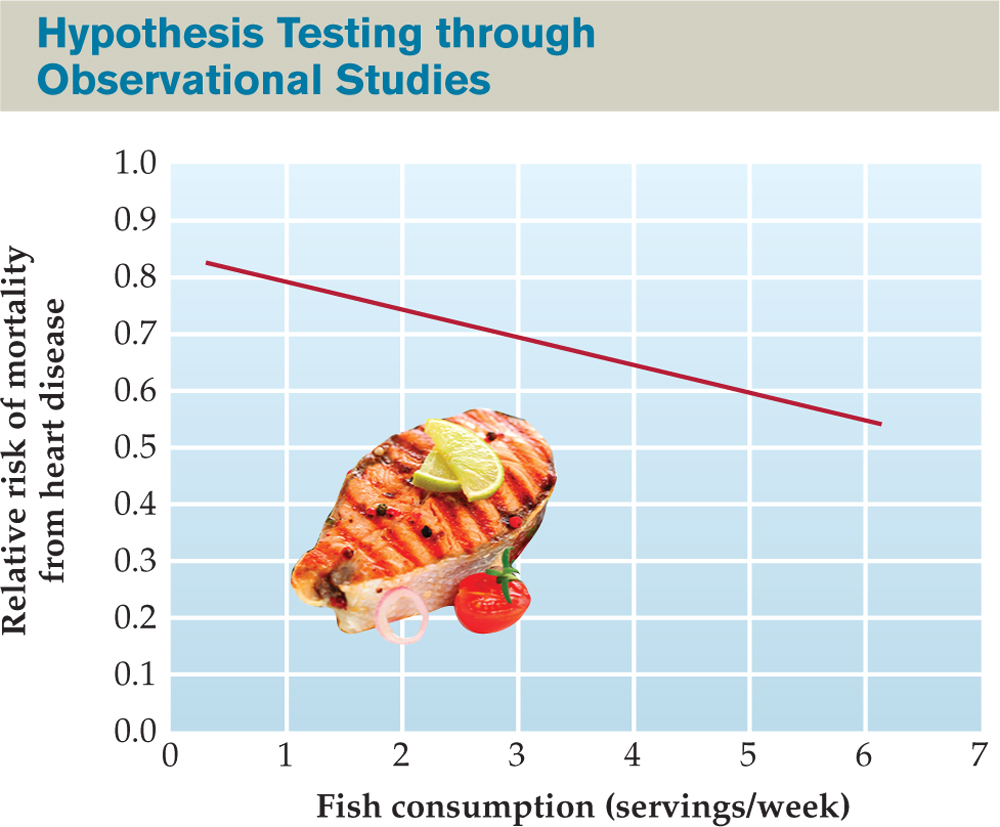
FIGURE 1.8 An Observational Test of the Hypothesis That Fish Consumption Reduces the Risk of Death from Heart Disease
The data plotted in the graph are based on aggregate studies of about 200,000 people over 20 years. The data support the hypothesis but do not demonstrate that fish consumption is the cause of the better heart health enjoyed by those who eat fish often.
Correlation is not causation
The statistical analysis showed that fish consumption and heart disease mortality were correlated. Correlation means that two or more aspects of the natural world behave in an interrelated manner: if we know the value of one variable (fish consumption per week), we can predict a particular value for the other variable (risk of mortality from heart disease). Does the statistical correlation mean that fish consumption was the cause of better heart health among the study subjects? The answer is: no, not necessarily!
What if fish consumption and heart disease were separately linked to a third variable—higher income, for example? It could be that wealthier people eat more fish because they can afford to, and they are less likely to die of heart disease because they have better access to high-quality health care. In that case, higher income is the cause of both the higher fish intake and the lower risk of death from heart disease. If so, the apparent link between fish intake and heart health is termed spurious. In statistics, the word “spurious” means doubtful, inaccurate, or false. A classic example of a spurious correlation is the strong link between the crowing of a rooster and daybreak. Does that correlation mean that the rooster’s crowing caused the dawning of the day?
Observational studies that indicate a link between two variables cannot demonstrate causation; that is, they cannot show that change in one variable causes change in the other. However, such studies are very useful in showing the possibility of a causal connection. By identifying variables that are linked, observational studies become the basis for additional research. For example, researchers can try to tease out the possibility that a third variable is the cause. In the case of fish consumption, the heart benefit was seen even when researchers compared people in the same income group. By eliminating other variables as possible causes, observational studies can build a persuasive case for causation. However, experiments are the most effective for showing causation.
Experiments are the gold standard for establishing causation
An experiment is a repeatable manipulation of one or more aspects of the natural world. In conducting a scientific experiment, an investigator typically manipulates a single variable, known as the independent variable or manipulated variable. Any variable that responds, or could potentially respond, to the changes in the independent variable is called the dependent variable or responding variable. If we think of the independent variable as the cause, then the dependent variable is the effect. In the simplest experimental design, a single independent variable is changed, and its effects upon a presumed dependent variable are measured.
The controlled experiment is a common and particularly useful experimental design. In a controlled experiment, a researcher measures the value of the dependent variable for at least two groups of study subjects. The groups must be comparable in all respects except that one group is exposed to a change in the independent variable, while the other group is not. Typically, the researcher obtains a sufficiently large number of study subjects and assigns them randomly to at least two groups.
 Helpful to Know
If you find independent and dependent variables too confusingly similar, remember that the independent variable is the one that the investigator manipulates.
●●●
Randomization helps ensure that the groups are comparable to start with. One group, the control group, is maintained under a standard set of conditions with no change in the independent variable. The other group, known as the experimental or treatment group, is maintained under the same standard set of conditions as the control group, but is manipulated in a way that changes the independent variable. In a well-designed experiment, the control and treatment groups are as similar to each other as possible and all variables, other than the independent variable, are held constant.
Observational studies had shown that eating cold-water fish such as salmon, trout, and sardines was even more strongly linked to heart health than was eating warm-water fish. Cold-water fish have higher levels of omega-3 oils, which have a particular chemical structure. Researchers designed randomized controlled experiments to test the hypothesis that moderate consumption of fish oils reduces heart disease mortality. They recruited about 2,000 men who had been diagnosed with heart problems, and asked roughly half of them to take 900 milligrams of fish oils daily; the rest of the men, who were not directed to alter their diet in any way, served as the control group.
At the end of the 2-year study period, there were 62 percent fewer deaths in the treatment group compared to the control group (FIGURE 1.9). The experimental test therefore supported the hypothesis that fish oils reduced heart disease mortality. However, a potential drawback of the experimental design was that study subjects knew whether or not they were receiving fish oil supplements.
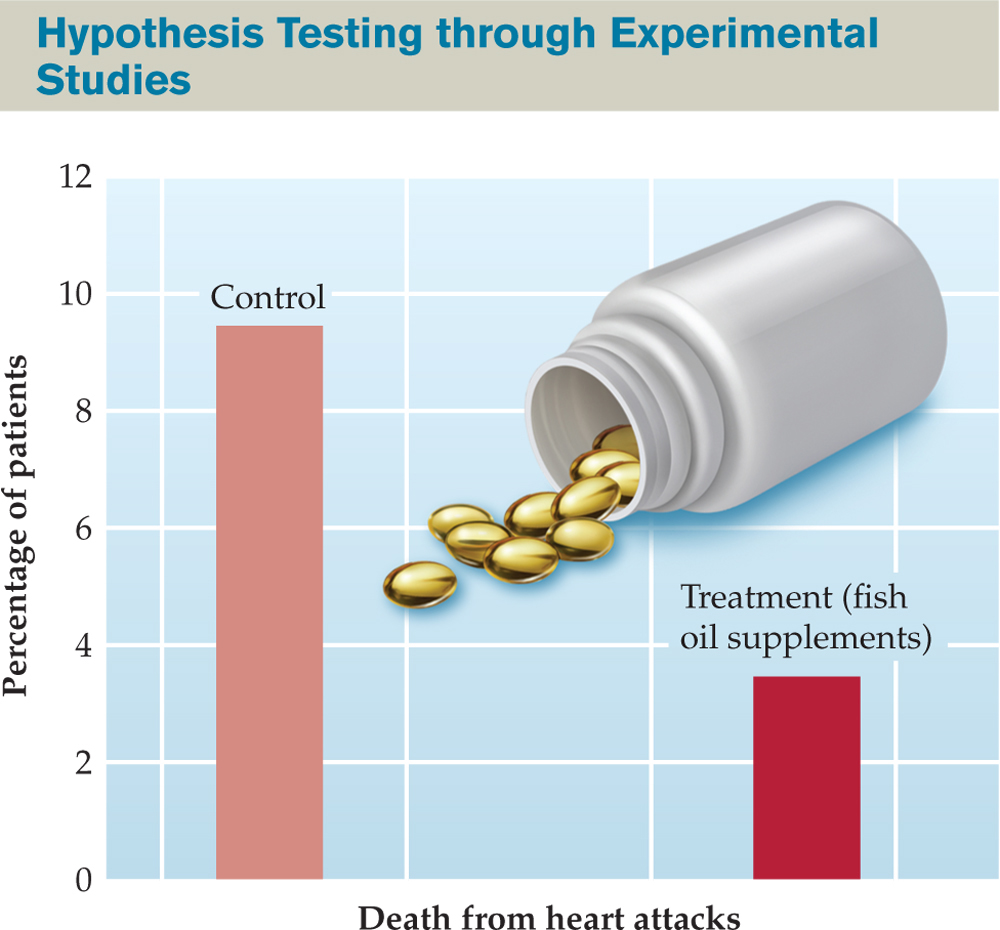
FIGURE 1.9 Effect of Fish Oil Supplements on Mortality from Heart Attacks in an At-Risk Population of Males
In an experimental study of over 2,000 men who had been diagnosed with heart disease, researchers randomly assigned about half to a control group and the other half to a treatment group. The men in the treatment group were asked to take 900 milligrams of fish oils daily, whereas the men in the control group were not directed to alter their diet in any way.
■ In a single-blind experiment, the study subjects do not know whether they belong to the control group or the treatment group. Instead of the treatment, the control group receives a placebo, which is a dummy pill or sham treatment that mimics the actual treatment. This type of experiment avoids the possibility of a placebo effect, the sense among study participants that they are feeling better because they have received a beneficial treatment.
■ In a double-blind experiment, neither the study subjects nor the researchers know which participants are receiving the treatment and which are controls. A double-blind experiment avoids conscious or unconscious bias on the part of the experimenter. FIGURE 1.10 shows the results of a double-blind experiment conducted on U.S. Navy SEAL trainees to test the hypothesis that caffeine enables sleep-deprived cadets to react more quickly in demanding situations than they could otherwise. All participants ate snack bars—with or without caffeine—that tasted the same.
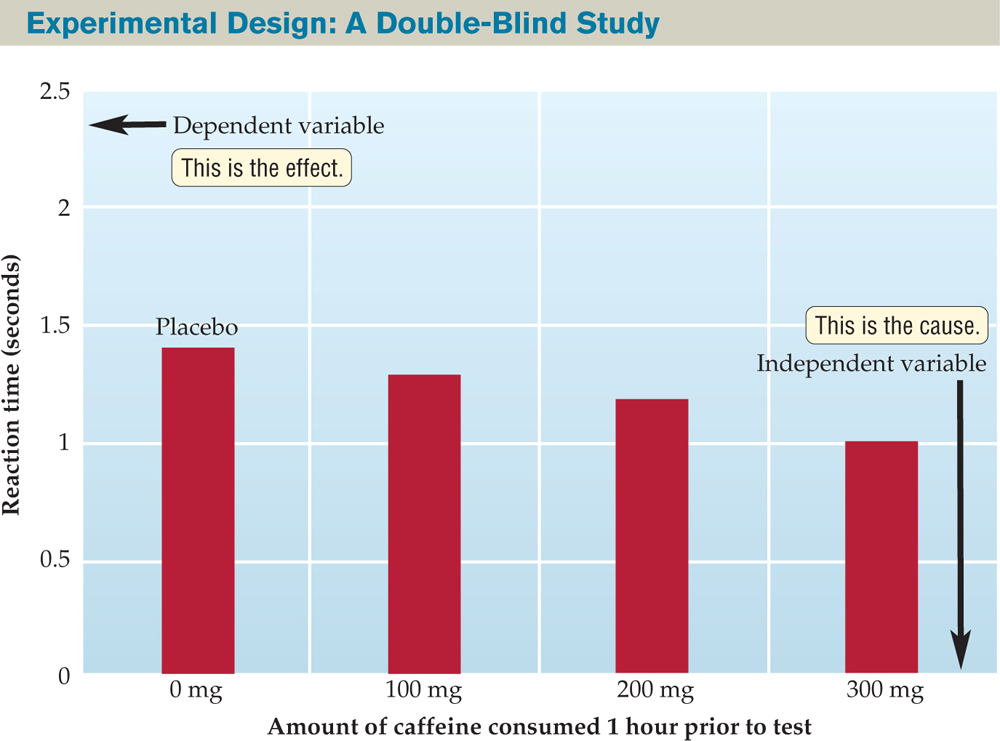
FIGURE 1.10 Effect of Caffeine Consumption on Reaction Time
Reaction time was tested in Navy SEAL trainees who had been sleep deprived for two days. Cadets in the three treatment groups ate a snack bar containing 100, 200, or 300 milligrams of caffeine. Those in the control group ate a snack bar that tasted the same but contained no caffeine. At the time of the test, neither the trainees nor the investigators knew whether a test taker belonged to the treatment group or the control group.
Concept Check
1. Which type of test would you use to investigate a causal link between two variables: an observational study or an experiment?
Answer
A controlled experiment.
2. How is a control group different from the treatment (experimental) group?
Answer
The two groups are maintained under identical conditions, except that the independent variable stays constant for the control group, while changing for the treatment group.