STUDY UNIT2.17Using Data to Describe People: Central Tendency and Standard Deviation
Explore...
How do researchers describe the average of a set of scores?
How is the variability of a set of scores different from an average?
To report research findings, psychological scientists need to quantify behavior—to convert behavior into numbers. For example, they might record which rung of a well-being ladder people think they are on, measure how many accidents they cause in a driving simulator, or test people’s blood alcohol content. After quantifying behavior and recording the numbers from a study, researchers make sense of the numbers using statistics.
The measurements from a study are nothing more than a batch of scores, called data. Researchers use those scores to test hypotheses by applying statistical techniques to summarize and analyze how participants responded in the study. The researchers’ first step is to use descriptive statistics: These statistics summarize participants’ differing responses in terms of what was most typical and how much people’s responses varied from the average.
Recall that in Piff and colleagues’ (2010) study on socioeconomic status and generosity, participants were given 10 valuable “points,” of which they could donate some portion to a stranger in the experiment. TABLE 2.5 shows how many points each person donated. This batch of scores is an excerpt from the study’s real data, which we’ll use to illustrate some descriptive statistics.
TABLE 2.5
A Batch of Scores
Person
Points donated
Will
0
Janaye
1
Fred
2
George
3
Hal
3
Jill
3
Angie
4
Jared
4
Jorge
4
Nantes
4
Olivia
4
Karla
5
Joselys
5
Quest
5
Hugo
6
Eli
6
Laura
7
Inigo
9
Note: Researchers do not record the actual names of study participants. These names are for illustration only.
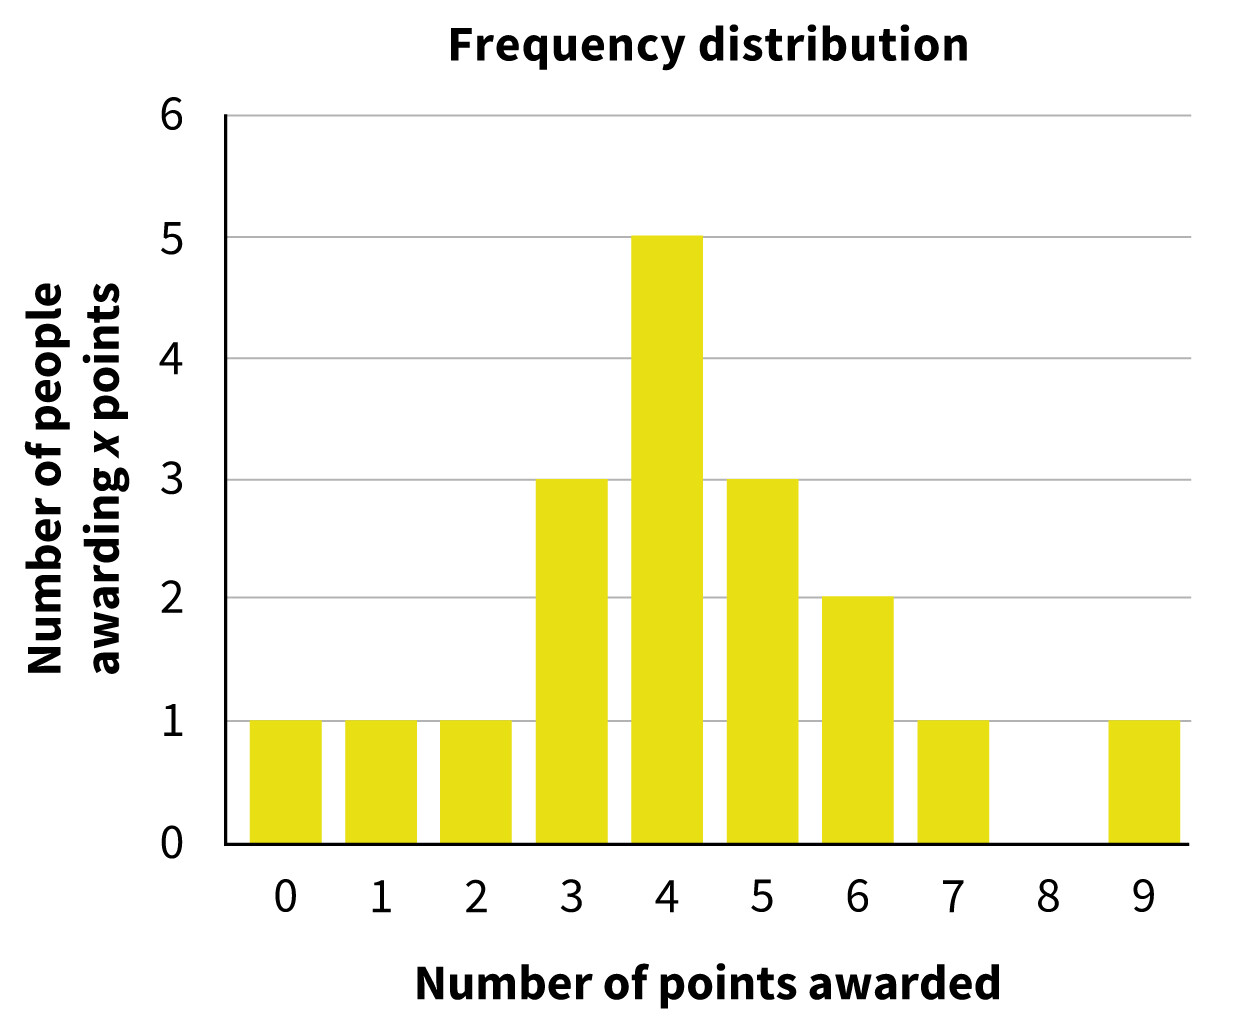
A frequency distribution is a bar graph in which the possible scores on a variable are listed on the x-axis from lowest to highest, and the total number of people who got each score is plotted on the y-axis. An example is shown in FIGURE 2.41. The frequency distribution shows, for example, that only one person in this batch of scores donated 1 point, but five people donated 4 points to the stranger.
More information
A frequency distribution shows the distribution of the number of points, out of 10, people chose to donate to an anonymous partner. The y-axis represents number of people awarding x points and ranges from 0 to 6, in increments of 1. The x-axis represents number of points awarded and ranges from 0 to 9, in increments of 1. The data in the format, Number of points awarded: Number of people awarding x points, are as follows. 0:1; 1:1; 2:1; 3:3; 4:5; 5:3; 6:2; 7:1; 8:0; 9:1.
FIGURE 2.41Frequency Distribution
The distribution of the number of points, out of 10, people chose to donate to an anonymous partner. (Source: Piff et al., 2010)
Along with making a frequency distribution of a set of scores, researchers usually estimate the average of the batch. You might want to know how many points, on average, people donated. When you calculate the average number of points, you’re asking about the central tendency—the center of the batch of scores.
There are three ways to describe the central tendency of a batch of scores. The first and most commonly used measure of central tendency is the mean. You’re already familiar with this measure of central tendency, because the mean is another name for the arithmetic average of a group of scores. For our sample set of scores, you would find the mean by adding up all the scores and then dividing by the total number of scores. You’d find that, on average, people gave 4.17 of their 10 points to their anonymous partner.
Another measure of central tendency is the median. To find it, you line up the scores in the batch from lowest to highest and then find the middle score. In other words, 50 percent of the scores in the batch are below the median and 50 percent are above it. For the batch of scores in Table 2.5, the median would be 4. When you have an even number of scores, the median is the average of the middle two scores.
Another measure of central tendency is the mode. The mode is the most common score in the batch. In our example, there are more 4s than any other score in the batch, so 4 is the mode. You can also find the mode from the frequency distribution. The height of each bar in a frequency distribution tells you how many people had that score, so the highest bar will show the most common score—the mode.
INTERACTIVE FIGURE 2.42 shows how to build a frequency distribution and how each measure of central tendency is computed.
Explore the Science
The extent to which the scores in a batch differ from one another is called variability. Imagine a batch of 18 scores in which everybody was the same: They all donated exactly 4 points. Such a sample would have no variability—everyone would be the same. In contrast, in our example batch, people donated anywhere from 0 to 9 points.
We can quantify the variability in a batch of scores in a couple of ways. One measure is the range, defined by the highest and lowest score in the batch. More commonly, researchers quantify variability as the standard deviation. This statistic calculates how much a batch of scores varies around its mean. In broad terms, the standard deviation involves finding the distance between each individual score and the mean, and then computing the average of these distances. INTERACTIVE FIGURE 2.43 allows you to see how the standard deviations and means change as you make a batch of scores more or less spread out.
A descriptive statistic that takes the form of a bar graph in which the possible scores on a variable are listed on the x-axis and the total number of people who had each score is plotted on the y-axis.
A measure of central tendency that is the middlemost score; it is obtained by lining up the scores from smallest to largest and identifying the middle score.