STUDY UNIT 2.5 Surveys: Descriptive Research Based on Self-Report
Explore...
- What can survey data tell us?
- Can a survey of only 2,000 people tell us about a population of millions?
Psychological scientists use three types of research methods to test their theories: descriptive, correlational, and experimental. Descriptive research tells us, “What do people do?” Correlational research tells us, “What kinds of people do this?” or “What’s associated with what?” Experimental research tells us, “Why do people do this?” or “What causes these behaviors?”
When researchers conduct descriptive research, they focus on one measured variable at a time with the goal of describing what is typical. Descriptive research asks, “What do people do, on average?” Parents of a newborn might want to know the descriptive data summarizing average height and weight for a full-term baby. Your doctor might share descriptive data on average blood pressure for adults of your age and sex. Or you might look up the average number of hours per week that college students play video games, to gauge whether your roommate has a problem.
When descriptive research is based on self-report, it often takes the form of a survey. Survey research provides concise summaries of a lot of people. Commercial survey organizations (such as Gallup, Pew Research, and others) contact one to two thousand people and ask them self-report questions about almost anything: religious practices, how much money they spent yesterday, political opinions, eating habits, and so on. Based on survey research, we might see headlines similar to these:
- Canadians and New Zealanders are among the happiest people in the world (Clifton, 2017).
- 46.9 percent of college men report being binge drinkers (Wechsler et al., 2002).
- Adult Facebook users have, on average, 338 Facebook friends (Pew Research Center, 2014).
- 21 percent of American adults have read an ebook (Pew Research Center, 2012).
- In a given year, 11 percent to 20 percent of veterans of the second Iraq war suffer from posttraumatic stress disorder (U.S. Department of Veterans Affairs, 2022).
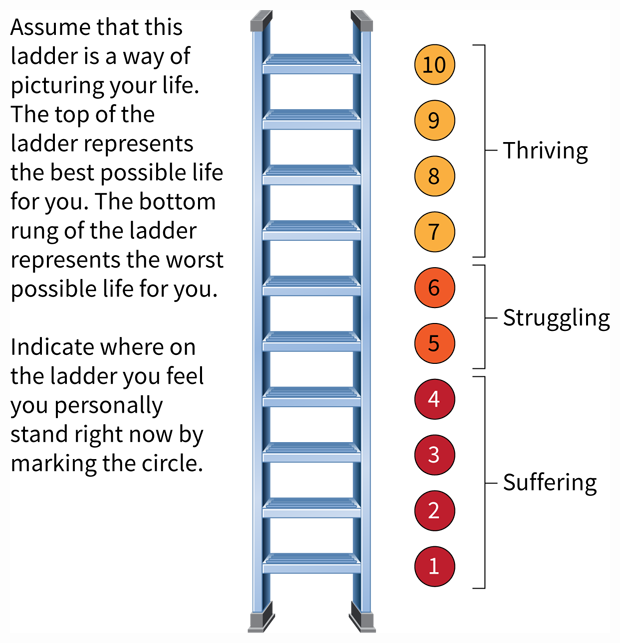
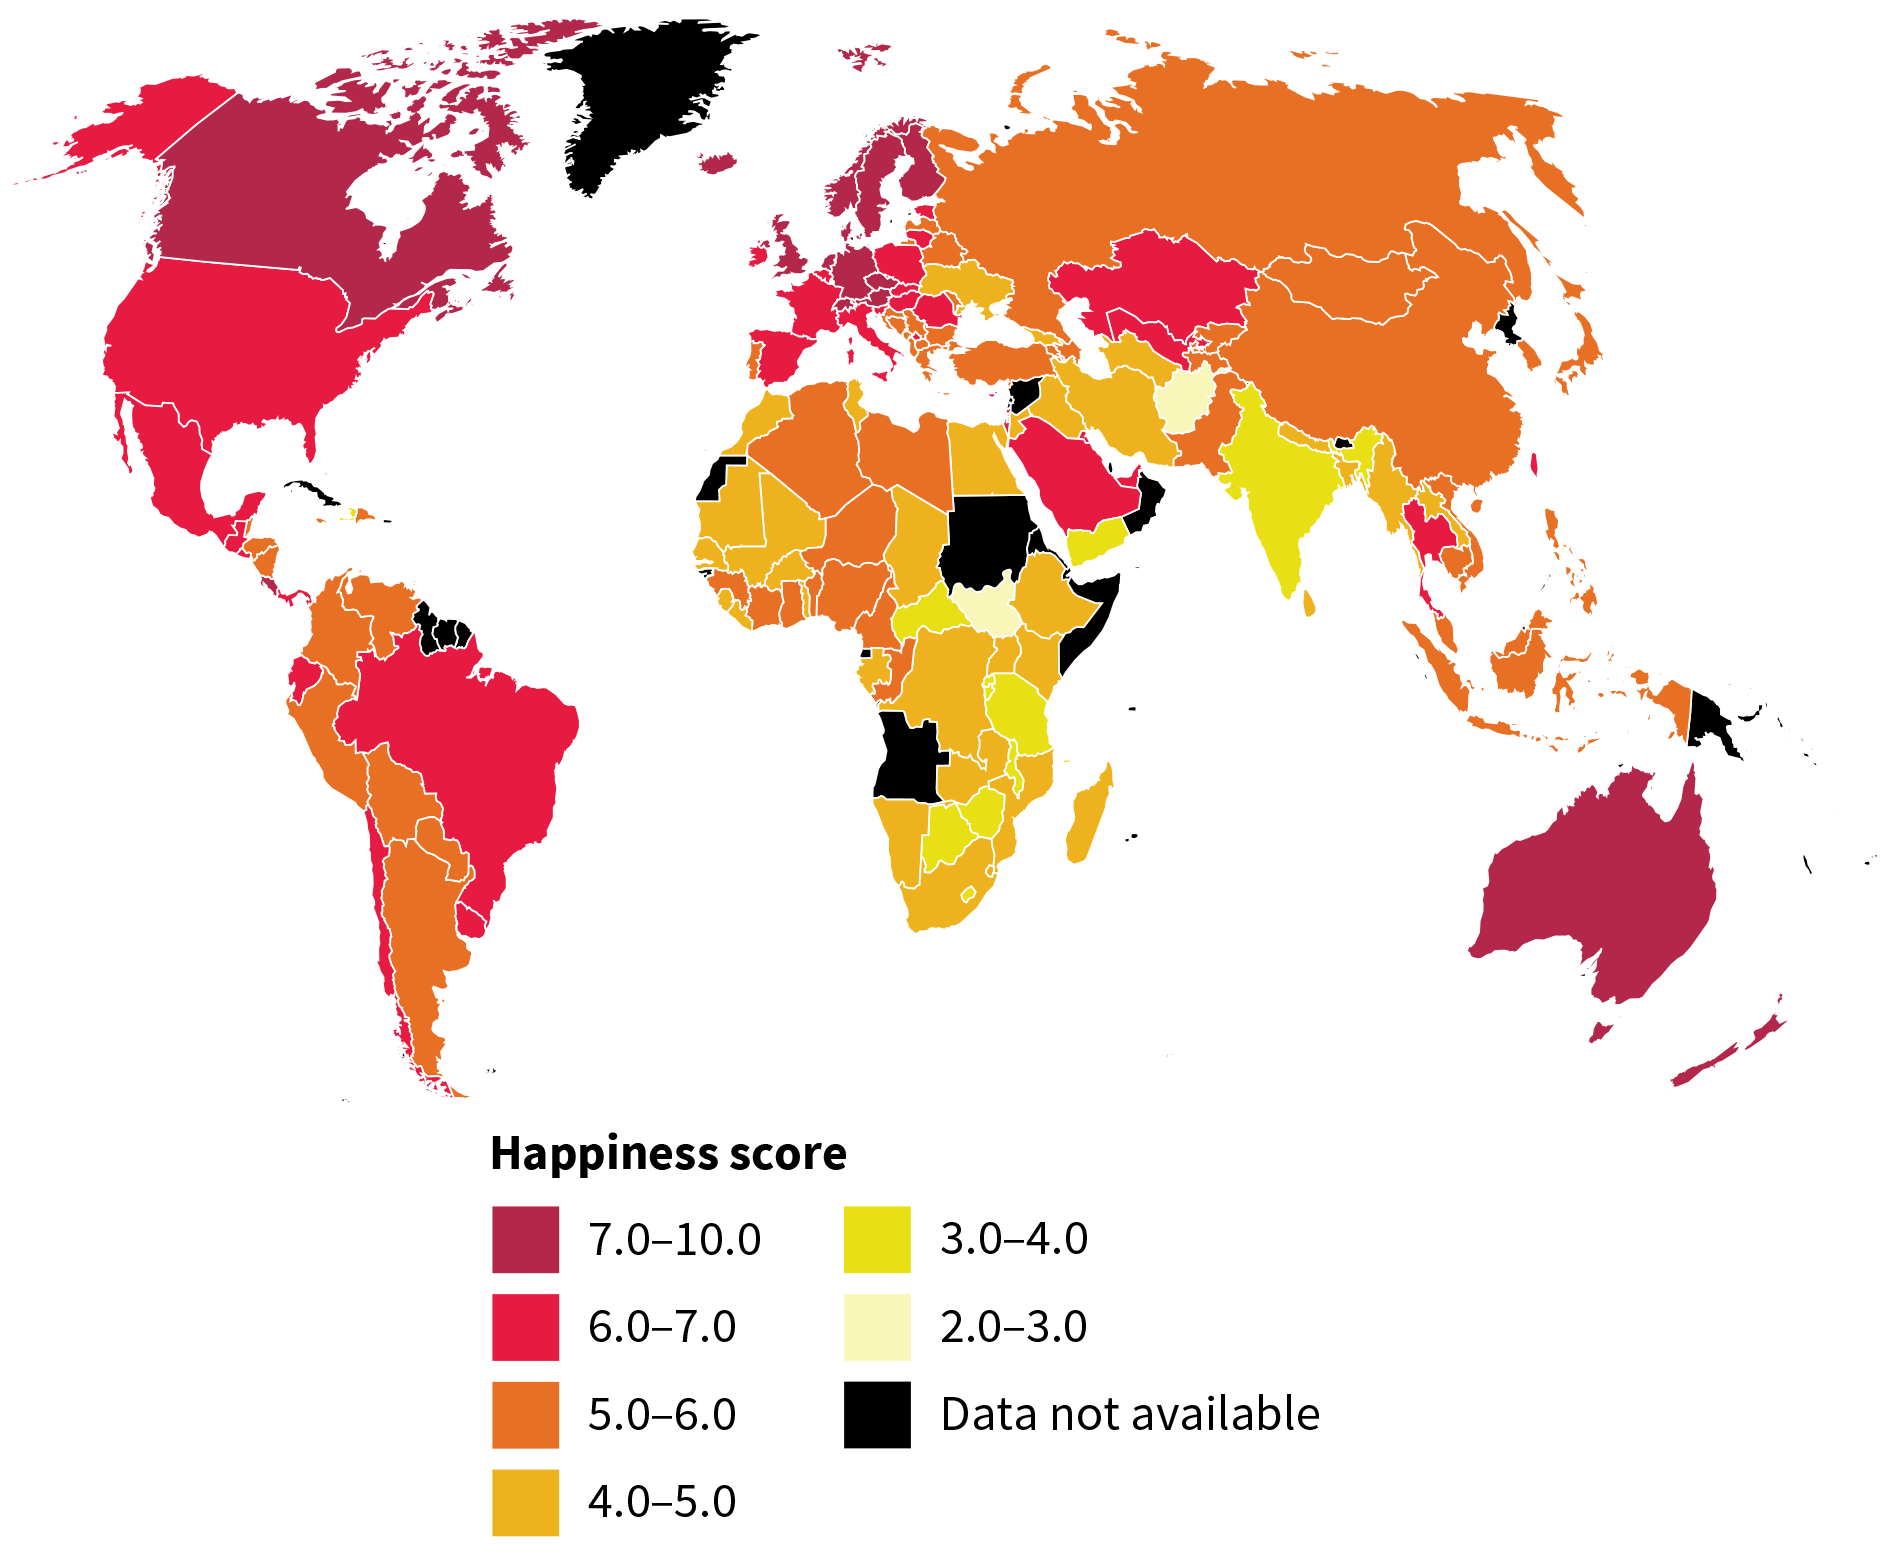
When you see these kinds of data in the news, they are almost always operationalized by self-report questions. For example, for the report that 60 percent of New Zealanders are thriving, researchers at the Gallup polling organization used a self-report “ladder-of-life” measure (Cantril, 1965) to assess well-being (FIGURE 2.9). Using this self-report measure, researchers can monitor levels of well-being in different parts of the world (FIGURE 2.10). The authors of the ladder-of-life measure suggest that people who score 7 or higher can be considered “thriving.”
More information
A ladder-of-life measures well-being on a scale from 1 to 10. The ladder-of-life has ten rungs. To the left of the ladder is text that reads: assume that this ladder is a way of picturing your life. The top of the ladder represents the best possible life for you. The bottom rung of the ladder represents the worst possible life for you. Indicate where on the ladder you feel you personally stand right now by marking the circle. The ladder is labeled as such: Rungs 1 through 4 are labeled suffering. Rungs 6 and 5 are labeled struggling. Rungs 7 through 10 are labeled thriving.
FIGURE 2.9 The Ladder-of-Life Measure of Well-Being
This measure was used to determine that 60 percent of New Zealanders are thriving.
More information
A map of the world shows the happiness score for each country. New Zealand, Canada and Australia have the highest scores, in the range from 7.0 to 10.0. The United States, Mexico, Brazil, Kazakhstan, Spain, France, and much of Europe have a happiness score in the range from 6.0 to 7.0. Russia, China, most of South East Asia, Pakistan, Libya, Algeria, west central Africa, and most of South America have a score in the range from 5.0 to 6.0. Much of Africa, including Mauritania, Mali, Morocco, in addition to Ukraine, Iran, and Iraq have a score in the range from 4.0 to 5.0. India, Bangladesh, Burma, Tanzania, and Yemen have a score in the range from 3.0 to 4.0. Afghanistan and South Sudan have the lowest scores in the range from 2.0 to 3.0. There is no data available for Greenland, Oman, Somalia, Papua New Guinea, North Korea, Guyana, Suriname, French Guinea, Sudan, Cuba, or Georgia.
FIGURE 2.10 Global Results From the Ladder of Life
Using the ladder-of-life measure, the Gallup polling organization is able to compute average well-being levels in each country of the world. To view an interactive version of this map, see Interactive Figure 9.34 in Study Unit 9.16.
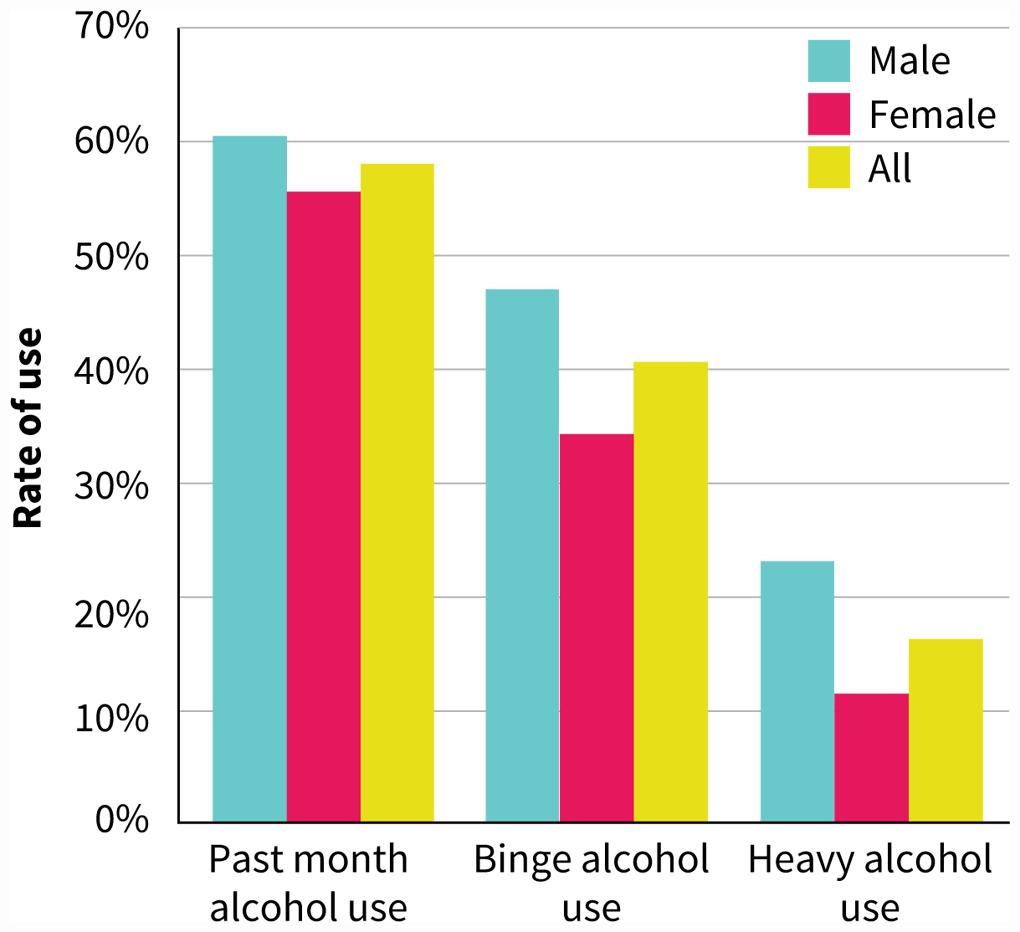
Another example comes from surveys that use self-report to measure drinking behavior. In one survey (Substance Abuse and Mental Health Services Administration, 2022), about 22.9 percent of respondents in the United States reported binge drinking, defined as “5 or more drinks for men and 4 or more drinks for women on a single occasion within the past 2 weeks.” But this rate is higher among college students at four-year colleges, where 46.9 percent of men and 34.4 percent of women report drinking at this level (FIGURE 2.11). This amount of alcohol, if consumed in about 2 hours, leads to a BAC of 0.08 for a typical male or female.
More information
A bar graph shows rates of college binge drinking. The y-axis represents rate of use and ranges from 0 to 70 percent, in increments of 10 percent. The data are provided for rates of use by male, female, and all. The data are as follows. Past month use: Male, 60 percent; Female, 55 percent; All, 58 percent. Binge alcohol use: Male, 46 percent; Female, 35 percent; All, 41 percent. Heavy alcohol use: Male, 23 percent; Female, 12 percent; All, 17 percent. Data are approximated.
FIGURE 2.11 Rates of College Binge Drinking
Rates of binge drinking can be estimated from surveys in which students self-report their alcohol use.
In these examples, the researchers did not survey all adults in New Zealand or the United States. Not only would it be impractical, it’s also unnecessary. When done well, surveys allow researchers to use a smaller group of people to draw conclusions about the larger group of people they came from. The smaller group of people, called a sample, is the group that participates in the research. They are selected from the larger group, which is called the population of interest. A population of interest is the larger set of individuals (or cases) the researcher is trying to understand or describe, such as “New Zealand adults” or “North Americans” or “people who buy coffee at Starbucks.” A population doesn’t have to be people; it can be “Twitter messages” or “titles in the university library” or “YouTube videos.”
To obtain the result that “60 percent of New Zealanders reported a well-being level of ‘thriving,’” the Gallup organization surveyed approximately 2,000 New Zealanders. The 2,000 people they contacted when conducting the survey constituted the sample. The responses of those 2,000 people were then used as an estimate of the well-being of the entire population of New Zealand. But what allows us to assume that the results from the sample generalize to the full population of interest? That is, given that 60 percent of these 2,000 New Zealanders are thriving, can we really assume that 60 percent of the full population of 4.4 million New Zealanders are also thriving? The answer can be found in how those 2,000 people were selected for the sample.
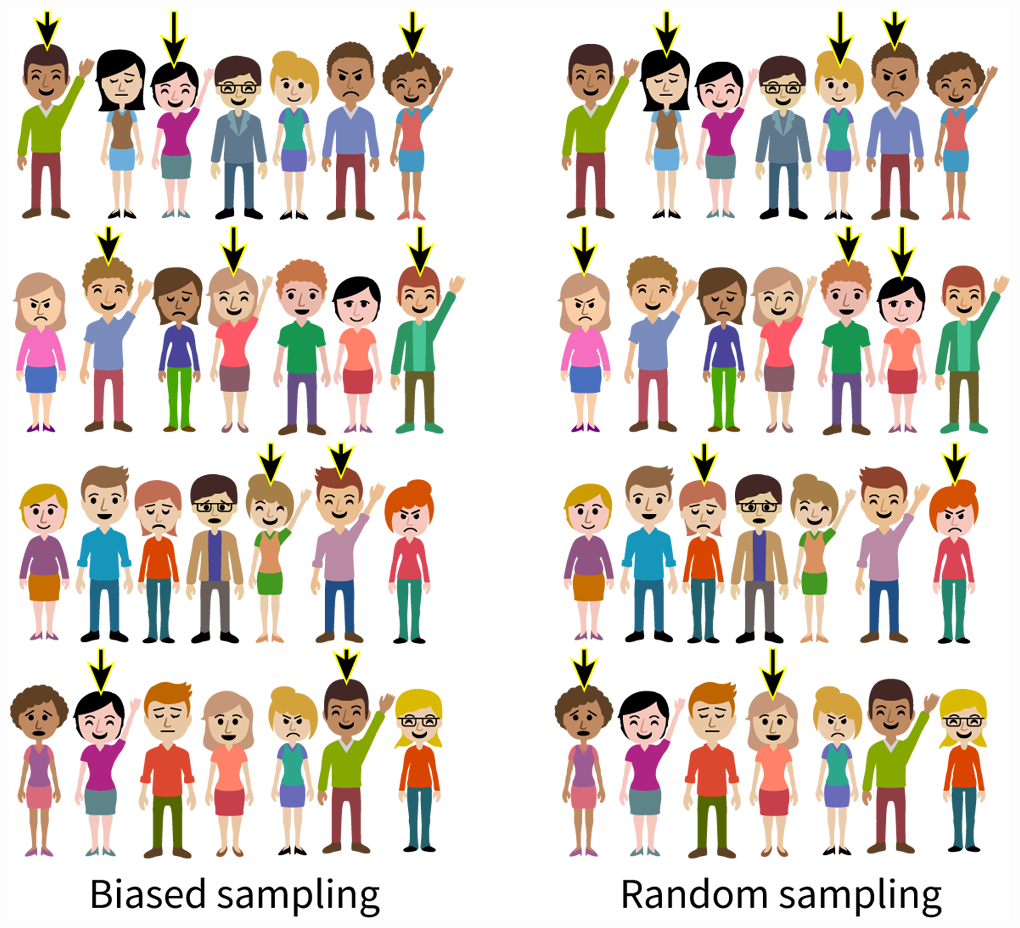
For a sample to generalize to a population, all members of the population of interest must have an equal chance of being selected for the sample. Normally, this is achieved through random sampling—for example, by dialing random digits on the telephone or pulling names out of a hat. In contrast, biased sampling results when only the most visible, opinionated, motivated, or easy-to-reach members of the population end up in the sample. If a researcher samples only people who volunteer to talk about their well-being or only people who live within 10 miles of the research site, then the sample would be biased and there would be no way to know whether the results from that sample generalize to the population (FIGURE 2.12). Truly random sampling techniques require special planning to avoid bias. For example, in the United States, people who have cell phones only (no landline) tend to be younger than the overall population. Therefore if a political survey uses a random-digit dialing technique for only landline numbers, the survey’s results might not accurately generalize to the political beliefs of all Americans.
More information
An illustration depicts biased and random sampling. There are two columns and in each column there are four rows of people in which some are sad and some are happy. The column on the left is titled biased sampling and the column on the right is titled random sampling. The two columns are exactly the same but the only difference is which people are selected to participate in a study. In the biased sampling, only people who are happy and raising their hands are chosen for a sample whereas in the random sampling there is a random selection.
FIGURE 2.12Random Sampling Versus Biased Sampling Techniques
What if happy people tend to be more likely to volunteer for studies? That means that if you only pick volunteers for your survey, you will conclude that the population is happier than they actually are. That’s a biased sample. If you select people according to a random sampling system, you will more accurately estimate the true happiness of the population of interest.
For most variables, a sample does not have to be large in order to generalize to the population. What’s important is the method that was used to obtain the sample: it’s the how, not how many. Survey researchers usually contact between 1,500 and 2,500 people, regardless of the size of the population of interest, using random-digit dialing methods that include both landline and cell-phone exchanges. This means that everybody in the population of interest has an equal chance of being in the sample, so the survey is likely to generalize to the population of interest.
Glossary
- descriptive research
- A type of study in which researchers measure one variable at a time.
- sample
- The group who participated in research, and who belong to the larger group (the population of interest) that the researcher is interested in understanding.
- population of interest
- The full set of cases the researcher is interested in.
- random sampling
- A way of choosing a sample of participants for a study in which participants are selected without bias, for example, by dialing random digits on the telephone or pulling names out of a hat.