SECTION OBJECTIVES
- Explain how civilization has impacted emerging infectious diseases.
- Describe how climate change can alter infectious disease patterns.
SECTION OBJECTIVES
Are all infectious diseases known to us? With all that we currently know about infectious diseases, we will never understand them all because new diseases are continually emerging or reemerging. An emerging disease is one that has recently appeared in a population. A reemerging disease is a known disease that was controlled but whose incidence or geographic range is increasing or is threatening to increase in the near future. Since 1976, the World Health Organization (WHO) has recorded more than 40 emerging and reemerging infectious diseases. Lyme disease, E. coli O157:H7 (one cause of bloody diarrhea), drug-resistant tuberculosis, hantavirus (the cause of a lethal respiratory infection), and COVID-19 are but a handful of diseases and disease-causing microbes that have emerged (or reemerged) over the past several decades. Where do these new diseases come from?
Global increases in death and disease are often connected to human activities that bring humans closer to disease reservoirs and vectors. Deforestation, human settlement sprawl, industrial development, road construction, large water control projects (such as dams, canals, irrigation systems, and reservoirs), and climate change alter the environment in ways that can expose humans to agents of infectious disease (see IMPACT). Towns built on the margins of woodlands that harbor deer populations, for example, make it easier for deer ticks to transmit the Lyme disease agent from deer to humans. Here are other recent examples:
The global rate of tropical deforestation, one factor contributing to increased malaria infections, continues at staggering levels, with nearly 2%–3% of forest habitats lost per year. Some of the loss is the result of fire, but most is caused by agriculture and urban sprawl—which is also on the rise, especially in developing countries. For example, between 1940 and 1960 the number of malaria cases in the Amazon basin had dropped from 6 million to 50,000, thanks to malaria control efforts. By the year 2000, however, that number had risen to 600,000—an increase that paralleled large-scale deforestation for land use. Several studies have correlated the increase in malaria incidence to the amount of deforestation that took place in the Amazon from 2003 to 2015 (Figure 2.20). One study concluded that a 10% rise in deforestation led to a 3.3% average increase in malaria transmission.
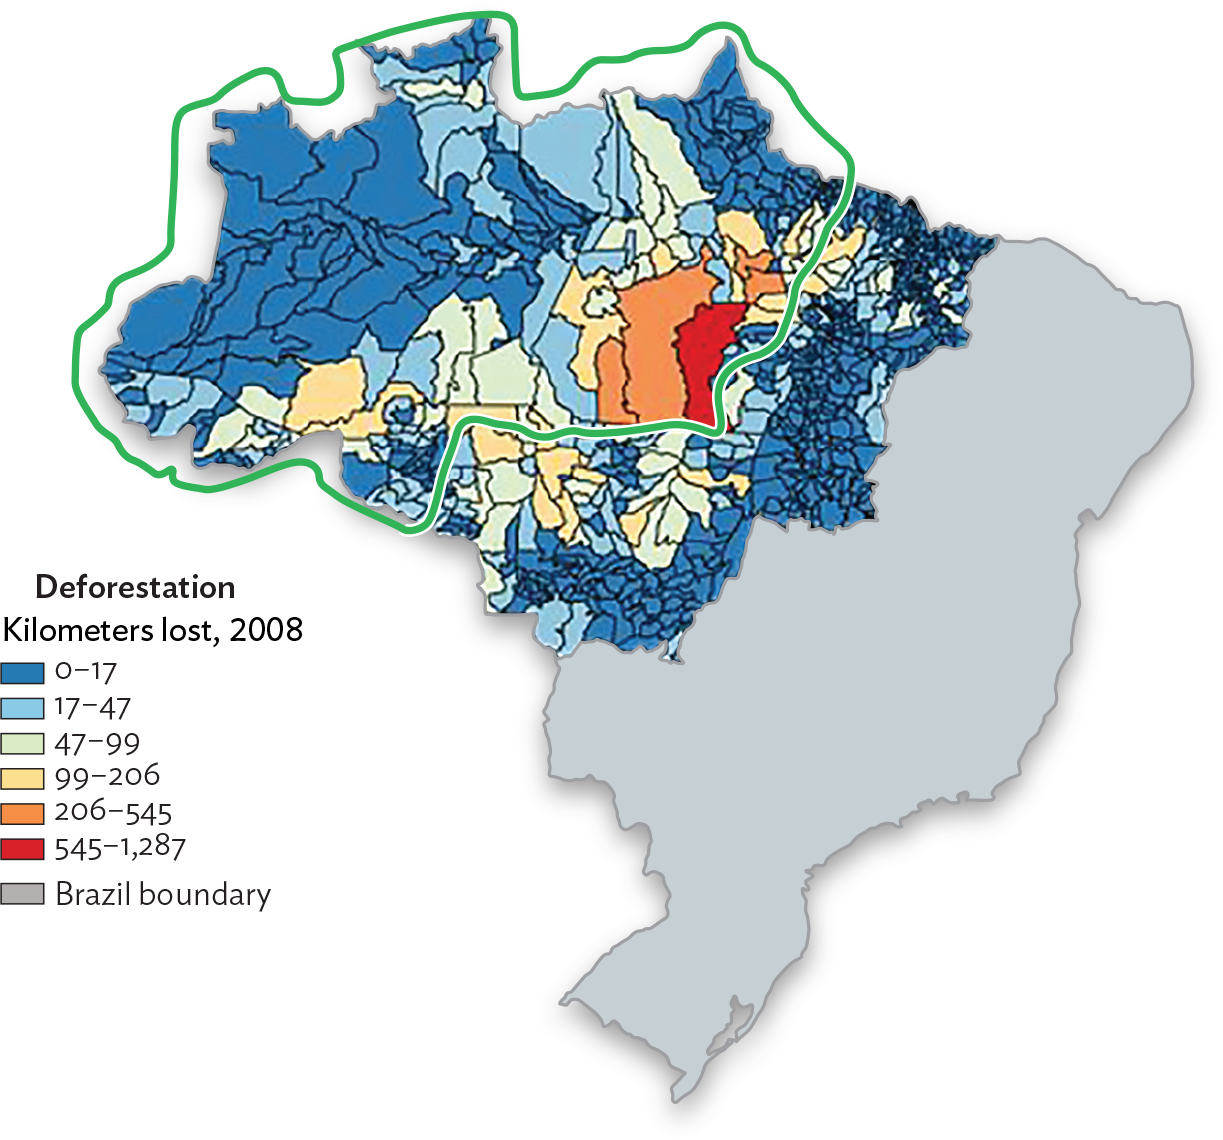
A map of deforestation in the Brazilian Amazon in 2008. The map is an irregular inverted triangle with the east half shaded in gray, noted as the Brazil boundary. The west half is colored, in irregular boundaries, following a key that defines deforestation in kilometers lost in 2008. Low rates of 0 to 17 kilometers lost are in blue, medium rates of 99-206 kilometers lost are in yellow, medium high rates of 206-545 kilometers lost are in orange, and high rates of 545 to 1287 kilometers lost are in red. In the center of the Amazon the western colored portion are high rates in red, bleeding into orange and yellow. The edges of the rainforest are lined in blue. A green line outlines the red municipalities and regions west, marking the interior of the amazon.
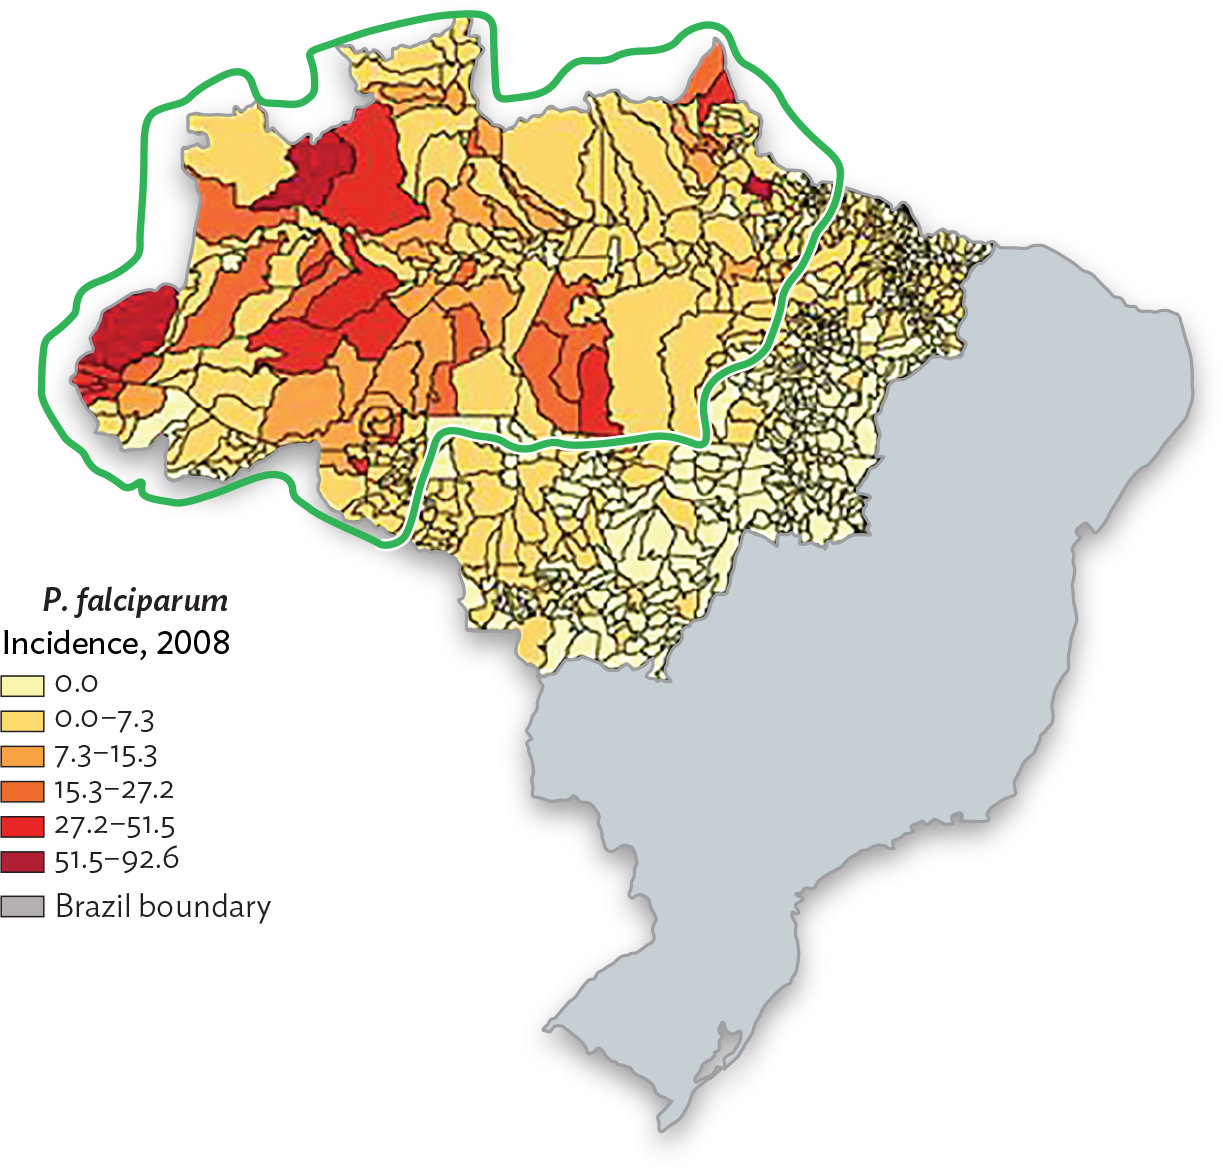
A map of P falciparum incidence in the Brazilian Amazon in 2008.The map is an irregular inverted triangle with the east half shaded in gray, noted as the Brazil boundary. A color scale is used to denote the incidence of malaria caused by Plasmodium falciparum in each municipality in 2008. light yellow indicates no incidence, orange indicates 15.3 through 27.2 incidence rate, red indicates 27.2 to 51.5 incidence, and dark red indicates 51.5 to 92.6 incidence. The dark red and red are concentrated in the western part of the forest, shading into light yellow at the eastern parts of the map. The highest prevalence is seen within the borders of the Amazon.
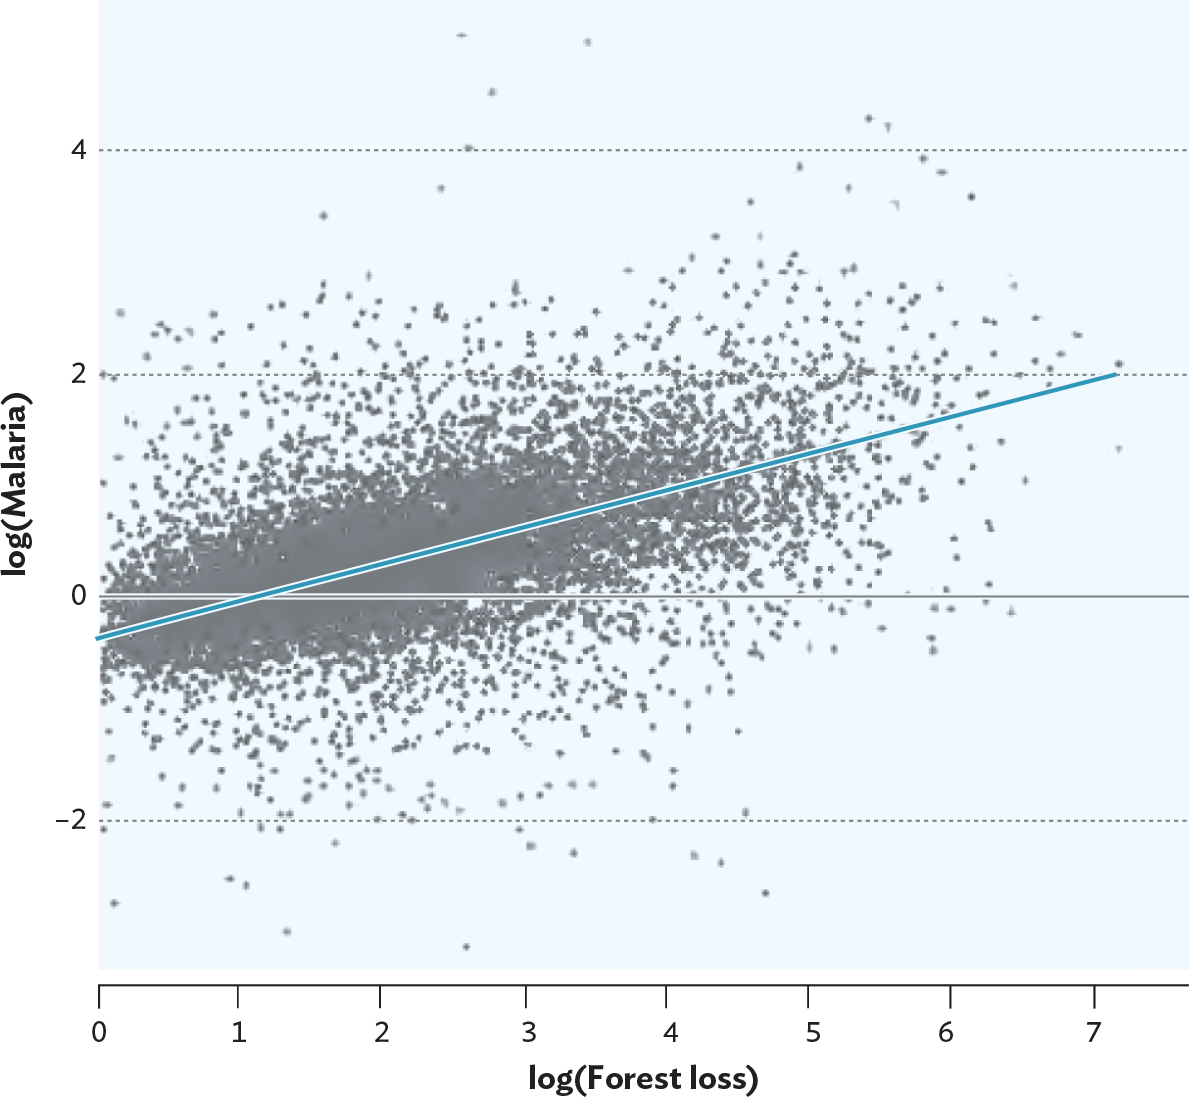
A graph of the relationship between malaria incidence and the amount of deforestation. The x-axis represents the logarithm of forest loss and ranges from 0 to 7, and the y-axis represents the logarithm of malaria incidence and ranges from negative 4 to 4. A line of best fit denotes the correlation between malaria and deforestation. It is drawn and connects the points 0 forest loss, negative 0.3 malaria to 7 forest loss, 2 malaria. Many dots representing municipalities’ data are crowded around the line, generally following a positive trend.
Deforestation practices will continue to create breeding areas for mosquitoes and bring humans closer to disease reservoirs and vectors. We can also expect global warming to change worldwide disease patterns. For instance, insect vectors now limited to tropical areas of the world will be able to migrate to higher (historically colder) latitudes, bringing infectious microbes with them. All this stirring up of the global environment not only fosters the spread of existing diseases but also builds breeding grounds in which new pathogens will evolve.
Having learned the language of infectious disease, you can now visualize the basic stages of an infection, explain how pathogens spread through a community, recognize key signs and symptoms of disease, and discuss how new pathogens emerge. With this awareness, you are now ready to see what makes microbes “tick.” The next chapters will describe the basic structure, biochemistry, genetics, and growth of microbes, and will illustrate how these features can impact infectious disease. You will also discover how microbial diversity maintains a healthy Earth and sustains all life on the planet.
SECTION SUMMARY