Describe the different kinds of information obtained by dark-field, phase-contrast, and fluorescence microscopy.
Describe how electron microscopy enables visualization of objects below the resolution limit of light, such as viruses and parts of cells.
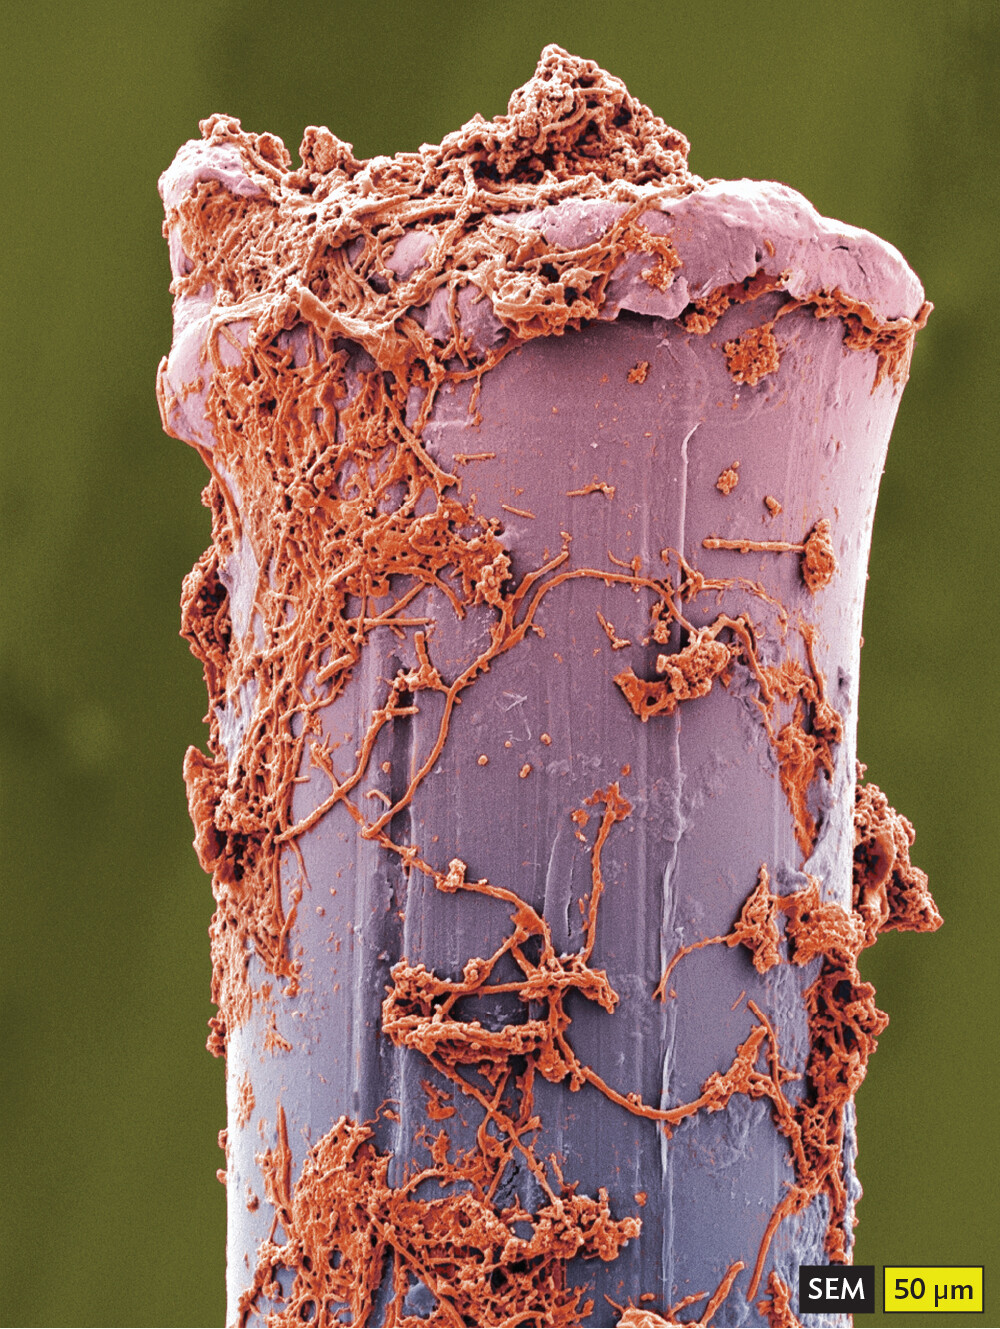
What other techniques are in our microscopy toolkit? Advanced optical techniques enable us to see microbes that are difficult or impossible to detect under a bright-field microscope. These advanced techniques take advantage of special properties of light waves such as fluorescence, or special sources of detection such as beams of electrons. For example, in Figure 3.23, scanning electron microscopy reveals the contours of dental bacteria on the surface of a toothbrush bristle.
Figure 3.23 Scanning Electron Microscopy Reveals Bacteria on a Toothbrush Bristle
More information
A scanning electron micrograph of bacteria on a toothbrush bristle. The bristle is a cylindrical shape with a roughened top surface. A multitude of bacterial cells, which have been colorized orange in the micrograph, are clumped together on the surface of the bristle. The bristle is about 1000 micrometers tall and 400 micrometers wide. The individual bacterial cells cannot be identified at this magnification. The cell clusters span several hundred micrometers.
Bacteria from dental plaque are colorized orange.
Dark-Field Observation Detects Unresolved Objects
In dark-field microscopy, the condenser contains an opaque central disk that blocks transmitted light, so the field appears dark. The only light rays we detect are those scattered by the object, as shown earlier in Figure 3.9D. For dark-field optics, an intense light source allows a microbe smaller than the wavelength of light to scatter enough light for detection. Detection does not allow resolution; in effect, the microbes are visualized as halos of bright light against a dark field, just as stars are observed against the night sky.
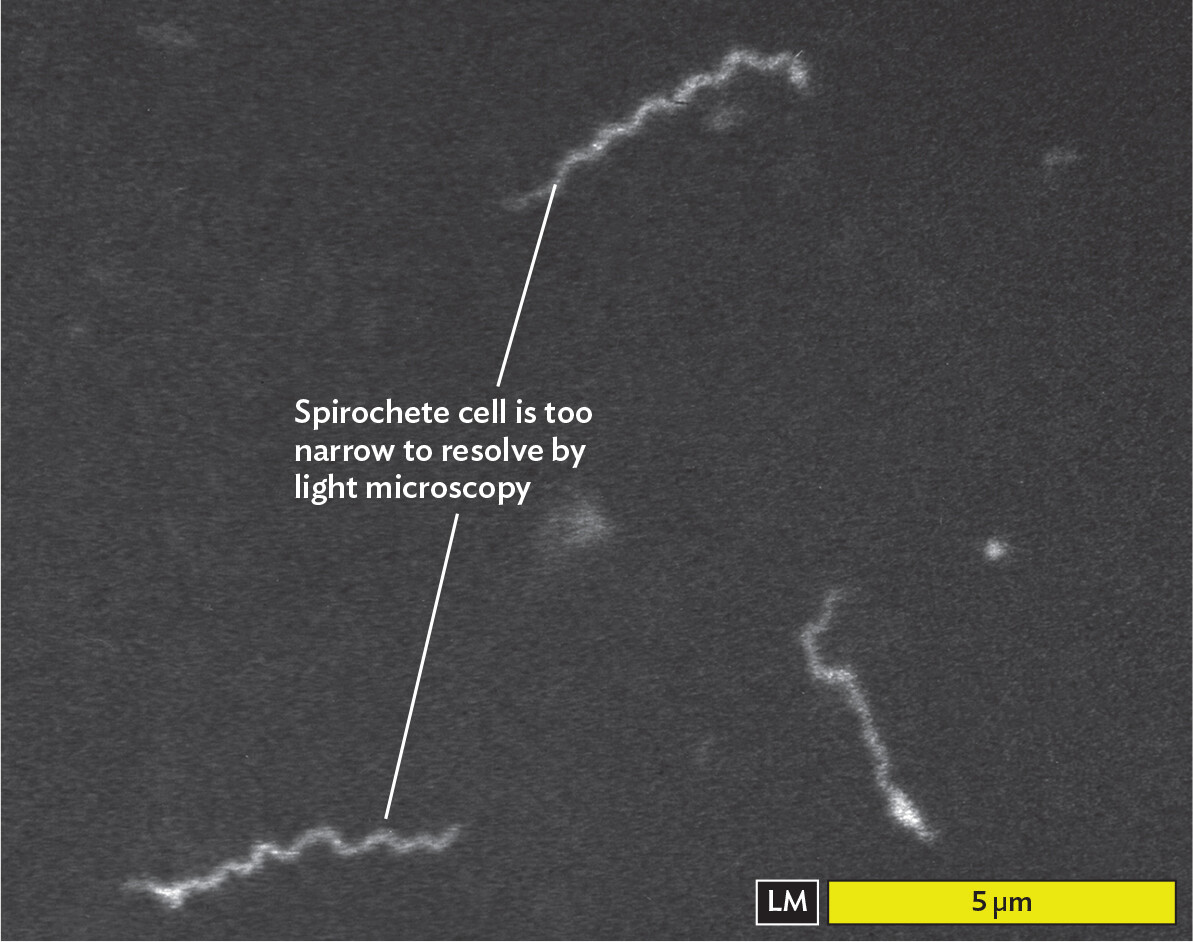
One use of dark-field microscopy is to detect Treponema pallidum, the bacterium that causes syphilis. A T. pallidum cell is a spirochete; the spirochetes are a major phylum of bacteria with a shape of tight coils. The coiled cell of Treponema is so narrow (0.1 µm) that its shape cannot be fully resolved by light microscopy. Nevertheless, T. pallidum can be detected by dark-field microscopy (Figure 3.24). In the dark-field image, the length of the cell is accurate, but the width of the cell body appears “overexposed,” or wider than the actual cell, because the scattered object lacks resolution.
Figure 3.24 Dark-Field Observation of Bacteria
More information
A light micrograph of Treponema pallidum cells as viewed under dark field observation. The bacterial cells are spirochetes which appear as long and slender wavy white lines on a dark background. Each cell is about 5 micrometers long and 0.1 micrometer wide. A note reads, spirochete cell is too narrow to resolve by light microscopy.
Treponema pallidum specimen from a patient with syphilis.
A limitation of dark-field microscopy is that any tiny particle, including specks of dust, can scatter light and interfere with visualization of the specimen. Unless the medium is extremely clear, it can be difficult to distinguish microbes of interest from particulates. Other methods of contrast enhancement, such as phase contrast and fluorescence, avoid this problem.
Phase-Contrast Microscopy
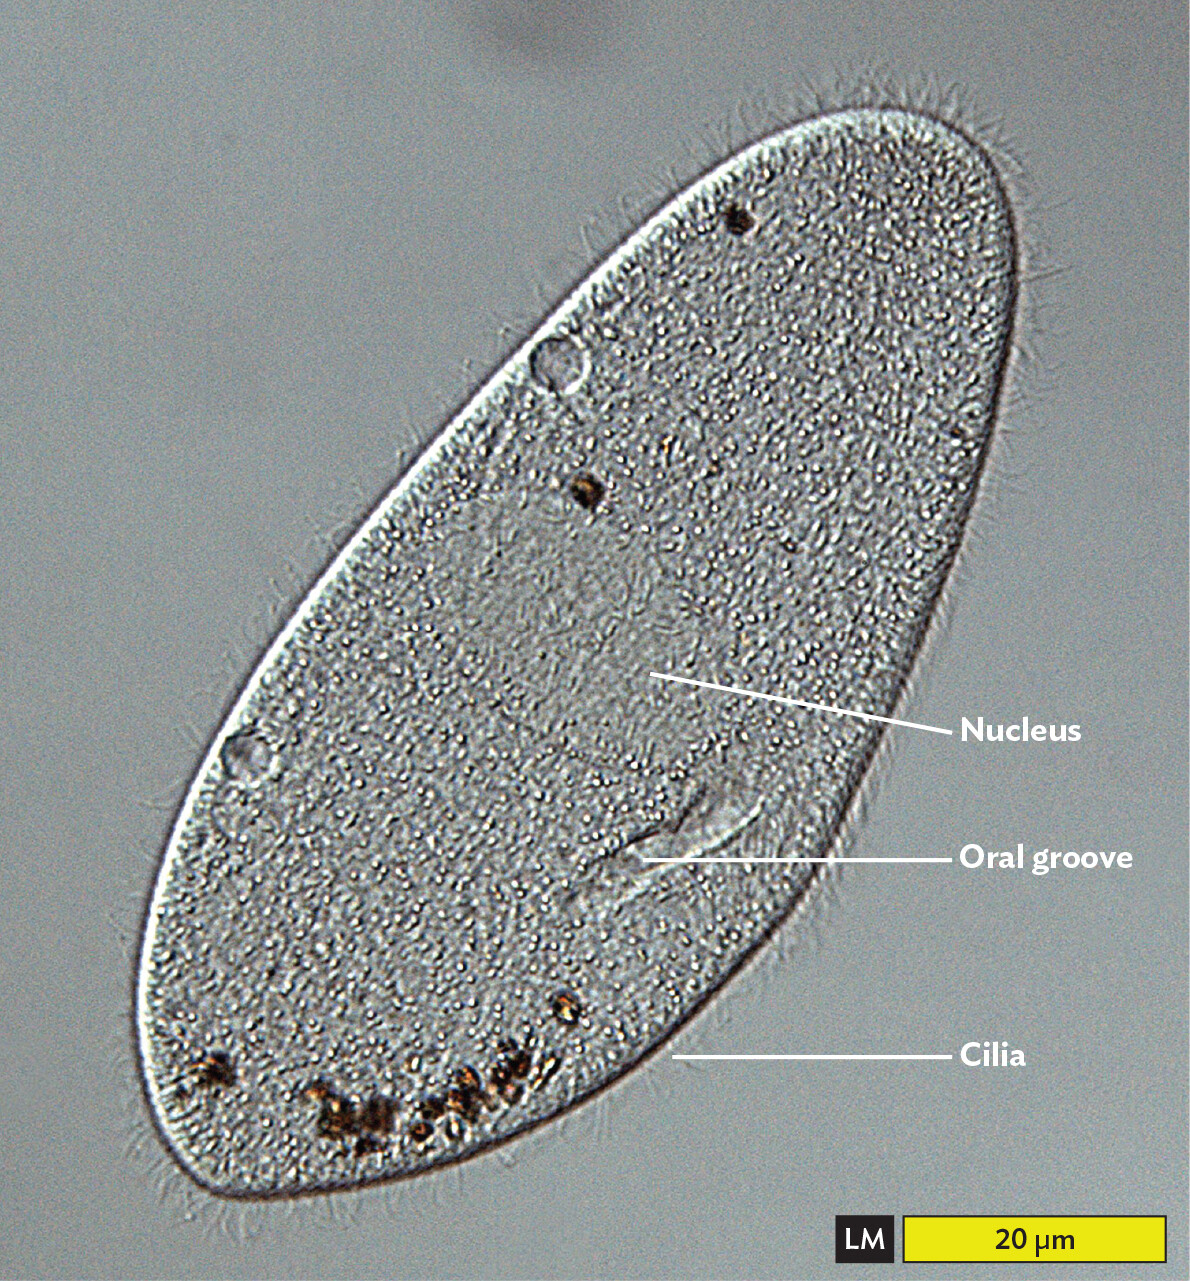
Phase-contrast microscopy exploits small differences in refractive index between the cytoplasm and the surrounding medium or between different organelles. This technique is particularly useful for eukaryotic cells, such as parasites, which contain many intracellular compartments. For example, Figure 3.25 shows a phase-contrast image of Paramecium, a freshwater protozoan that is part of the food web feeding invertebrates and fish (see Chapter 27). The Paramecium is covered with cilia (visible in Figure 3.25) that beat in waves to propel the organism through the water and move food.
Figure 3.25 Phase-Contrast Microscopy
More information
A phase contrast micrograph of a paramecium. The image is in greyscale. The paramecium is roughly ovoid in shape. It is about 120 micrometers in length and 40 micrometers in width. The impressions of a few internal organelles can be visualized. The cell has a dark, well defined outer membrane lined with cilia. The cilia are tiny, hair like projections extending from the cell. They cannot be visualized in great detail at this magnification. The majority of the cell interior is grainy. Centrally located in the paramecium is an oval nucleus, which has a thin, lightly defined membrane and less grainy interior. The nucleus is about 20 micrometers long and 15 micrometers wide. Near the nucleus is a roughly cylindrical impression called the oral groove. Other unidentified spherical structures are seen throughout the Paramecium.
Phase-contrast micrograph of Paramecium, a freshwater protozoan. The abrupt changes in refractive index at the cell’s edge makes it appear three-dimensional. Subcellular organelles show similar effects.
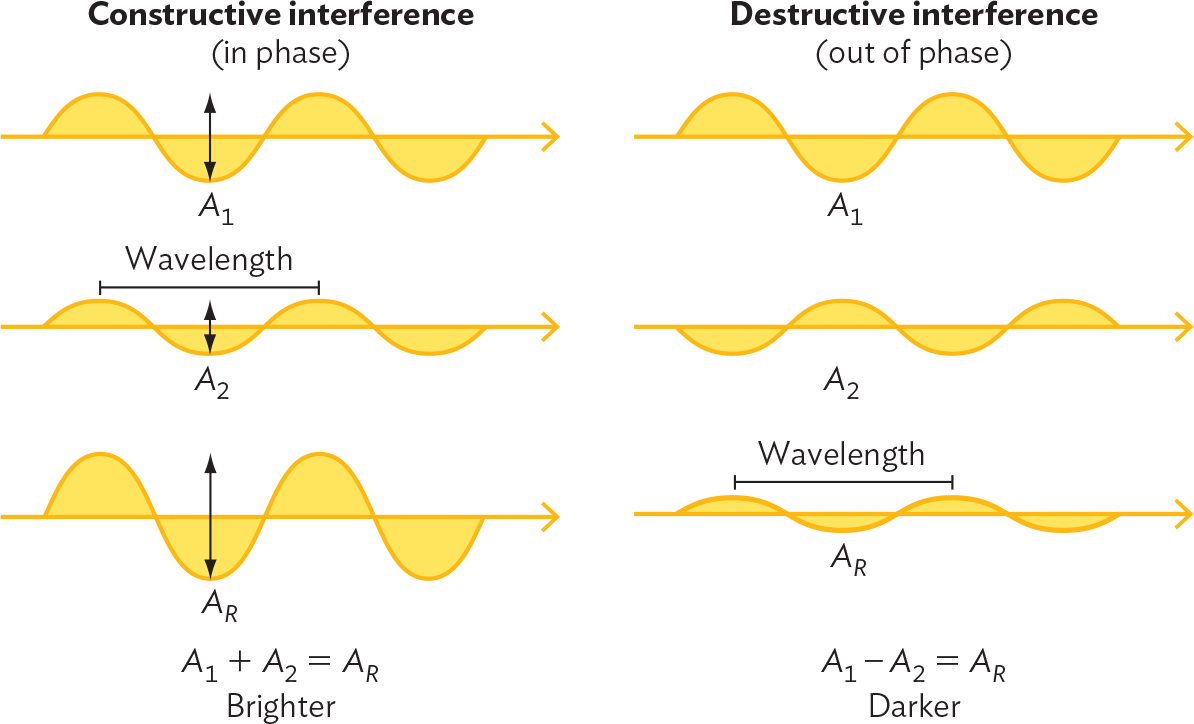
Phase-contrast microscopy makes use of the fact that living cells have relatively high contrast due to their high concentration of solutes. Given the size and refractive index of commonly observed cells, light is slowed by approximately one-quarter of a wavelength when it passes through the cell. The optical system slows the refracted light by an additional one-quarter of a wavelength, so that the light refracted through the cell is slowed by a total of half a wavelength compared with the light transmitted through the medium. When two light rays are out of phase by half a wavelength, they cancel each other’s amplitude, and that portion of the image appears dark. Figure 3.26 illustrates the addition of wave amplitudes in phase and the subtraction of wave amplitudes out of phase.
Figure 3.26 Constructive (Additive) and Destructive (Subtractive) Interference of Light Waves
More information
An illustration of constructive, or additive, and destructive, or subtractive, interference of light waves. The constructive or in phase interference has three wave diagrams. Each one has two peaks and two troughs. Each wave starts with a peak and ends with a trough. The wavelengths of the waves are the same. The amplitude of the first wave is labeled A subscript 1. The amplitude of the second wave is labeled A subscript 2. The amplitude of the third wave is labeled A subscript R. It has the largest amplitude. A subscript 1 plus A subscript 2 equals A subscript R. This results in a brighter light. The destructive or out of phase interference also has three wave diagrams. Each one has two peaks and two troughs. The wavelengths of the waves are the same. The amplitude of the first wave is labeled A subscript 1. It starts with a peak and ends with a trough. The amplitude of the second wave is labeled A subscript 2. It is smaller than A subscript 1. It starts with a trough and ends with a peak. The amplitude of the third wave is labeled A subscript R. It has the smallest amplitude. A subscript 1 minus A subscript 2 equals A subscript R. This results in a darker light.
In constructive (additive) interference, the peaks of the two light waves are in phase and rise together; their amplitudes combine to create a wave of greater amplitude. In destructive (subtractive) interference, the peaks of the waves are out of phase; their amplitudes cancel to create a wave of lesser amplitude.
Phase-contrast optics generates alternating regions of light and darkness in the image. Even small differences in refractive index can produce dramatic differences in contrast between the offset phases of light. In Figure 3.25, at the edge of the cell’s image, the abrupt change in refractive index creates an illusion of depth. Similar effects reveal subcellular organelles such as the nucleus and the oral groove.
Interference Microscopy
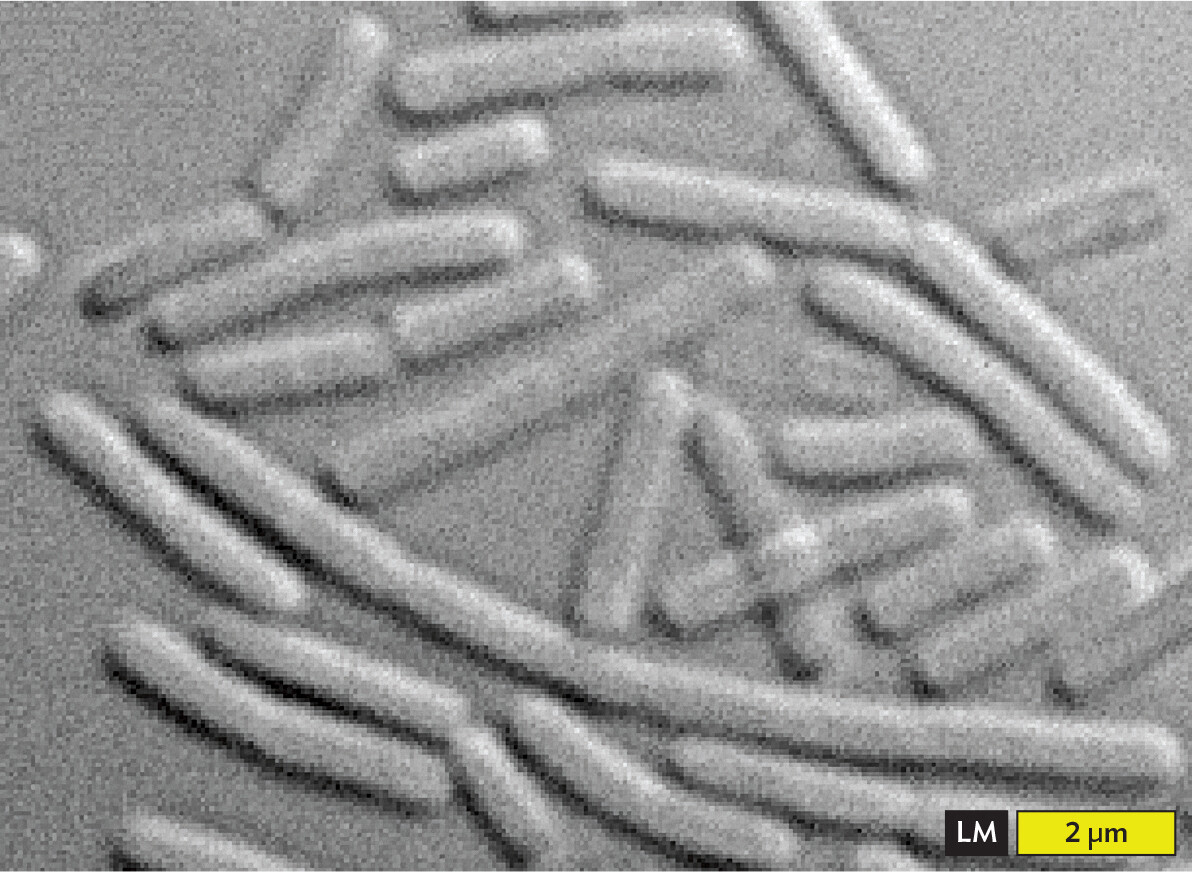
Other kinds of optical systems have been devised that use light interference to enhance cytoplasmic contrast. Interference microscopy enhances contrast by superimposing the specimen’s image on a second beam of light that generates an interference pattern. The interference pattern produces an illusion of three-dimensional shadowing across the specimen. For example, Figure 3.27 shows the shape of the dust-borne bacterium Bacillus subtilis illuminated by interference contrast. The shape of the cells is more clearly defined than it would be in conventional bright-field microscopy.
Figure 3.27 Interference Micrograph of Bacillus subtilis
More information
An interference micrograph of Bacillus subtilis. There are numerous rod shaped bacteria. Some are in chains and others are overlapping or clustered together. The cells have shadowed, darker edges and slightly lighter centers, giving them a 3 D appearance. The cells are each roughly 3 micrometers in length and 0.5 micrometer in width.
The apparent 3D effect is illusory. One bacterium appears as if crossed through another.
Fluorescence Microscopy
CASE HISTORY 3.3
From Hot Tub to Hospital
More information
A photo of a circular in ground hot tub. Metal railing lines the steps into the hot tub. The water bubbles and steams.
Jared was a 48-year-old healthy man who ran a business servicing whirlpool baths and hot tub spas in Columbus, Ohio. He began to experience dyspnea (shortness of breath) and watery diarrhea. Jared’s symptoms increased, including a dry cough, myalgia (muscle pain), nausea, and vomiting. After 6 days, he was admitted to a hospital in Columbus. The clinician noticed that Jared appeared flushed and had dry mucous membranes. His temperature was 39°C (102.2°F), and his pulse rate was 103 beats per minute. Chest radiographs showed pneumonia (lung infection) with consolidation (formation of a firm mass) of the left lower lobe. His C-reactive protein (CRP, a blood protein produced by the liver) was greater than 220 milligrams per liter (mg/l), a high level that indicates inflammation.
Before the onset of symptoms, Jared recalled having cleaned the filter of a hot tub spa at an elite downtown Columbus hotel. The water in hot tubs is filtered and sanitized by chlorination, but it can become contaminated by Gram-negative pathogens. Culture from Jared’s sputum and from the spa filter revealed Gram-negative bacilli consistent with Legionella pneumophila. The diagnosis was confirmed by fluorescence microscopy using direct fluorescent antibody (DFA) stain. The patient received intravenous amoxicillin and clarithromycin antibiotics for 8 days before his condition returned to normal.
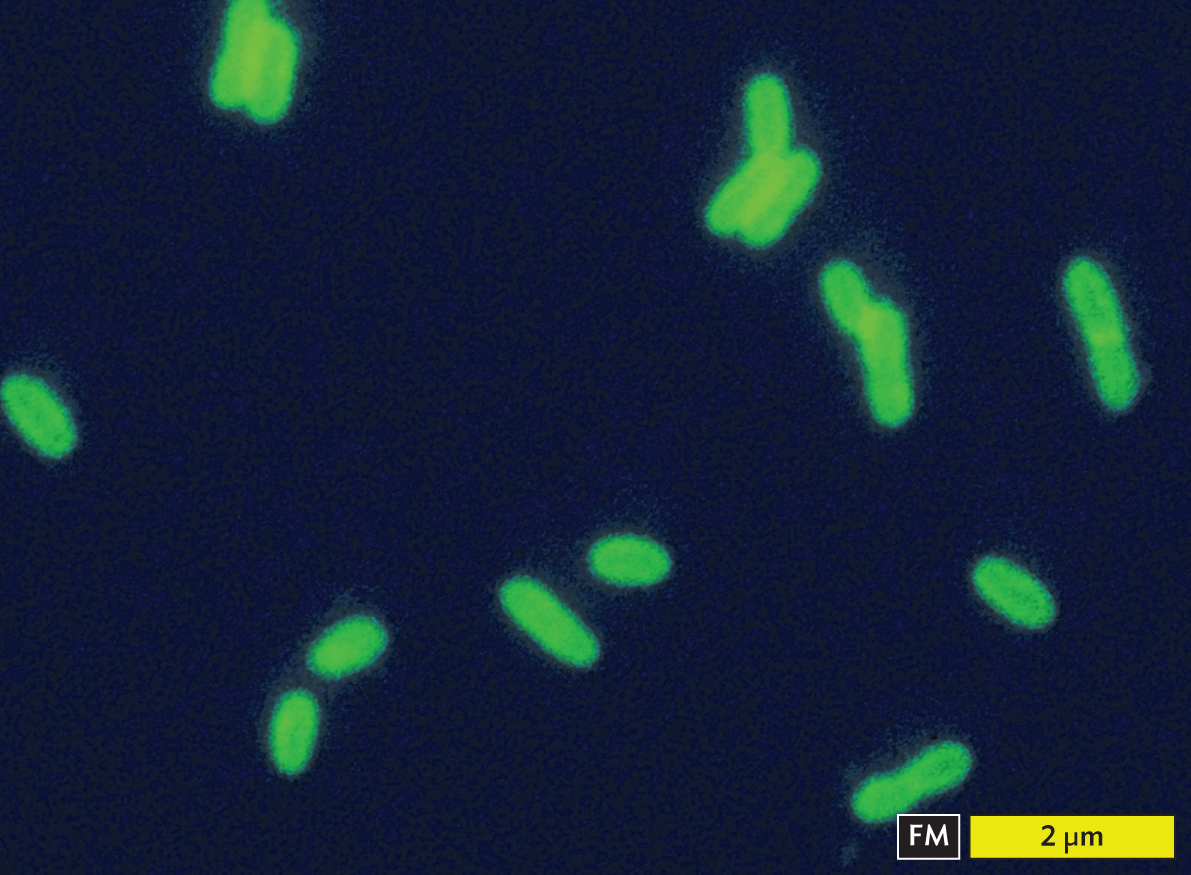
The bacteria from Jared’s sputum in this case history were shaped like small rods—just like many other species. How can we distinguish specific types of bacteria that look alike? Fluorescence microscopy (FM) is a tool that enables us to identify a single species, such as the Gram-negative, rod-shaped L. pneumophila (Figure 3.28). L. pneumophila is the cause of legionellosis, a form of pneumonia that can be rapidly fatal if not diagnosed in time. The bacteria grow intracellularly within amebas that contaminate water sources such as air-conditioning units or hot tub spas (as in the case history). During human infection, L. pneumophila grows within lung macrophages (white blood cells).
Figure 3.28Legionella pneumophila Visualized by Direct Fluorescent Antibody Stain
More information
A fluorescence micrograph of Legionella pneumophila using direct fluorescent antibody stain. There are several bright green rod shaped cells on a dark background. The cells appear to glow. Each cell is about 1 micrometer in length and 0.5 micrometer in width.
Fluorescent labeled bacteria appear brightly colored against a dark background.
Fluorescence microscopy offers a powerful way to detect specific microbes and subcellular structures while avoiding signals from dust and other nonspecific materials. Bacteria such as L. pneumophila and Mycobacterium tuberculosis can be identified by fluorescence microscopy of samples stained with a fluorescent antibody specific to the bacterial surface molecules.
Fluorescence occurs when a molecule absorbs light of one color and then emits light at another color of longer wavelength (lower energy). Light is absorbed at a specific wavelength (the excitation wavelength), which excites an electron to a higher energy level. The electron then falls to its original level by emitting a photon of lower energy and longer wavelength (the emission wavelength). The emitted photon has a longer wavelength (less energy) because part of the electron’s energy of absorption was lost as heat.
The wavelengths of excitation and emission are determined by the fluorophore, the fluorescent molecule used to stain the specimen. For detecting L. pneumophila, the fluorophore used is fluorescein, conjugated (attached) to an antibody that specifically binds the cell surface of L. pneumophila. In Figure 3.28, the fluorescence is brightest around the rim of each cell, where the maximal “depth” of the envelope fluoresces.
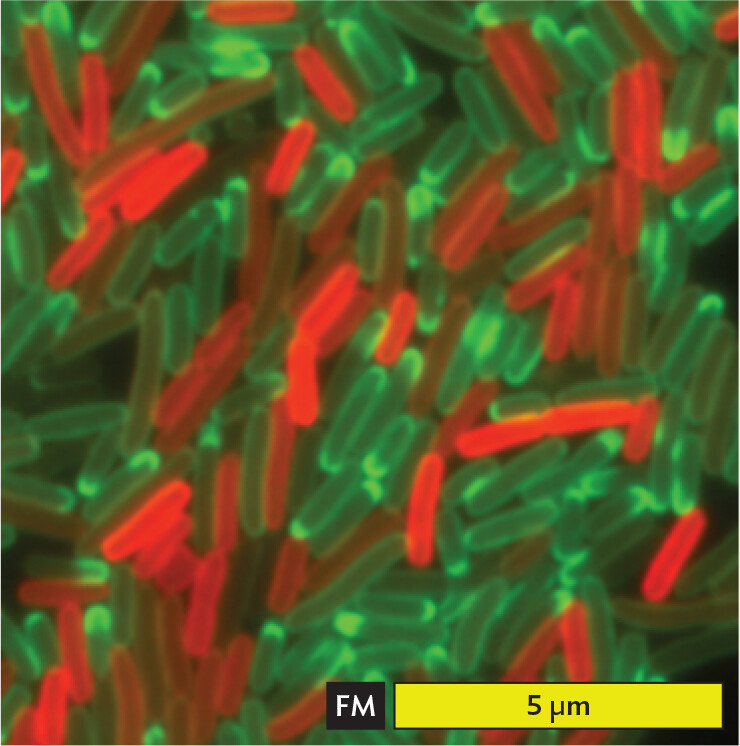
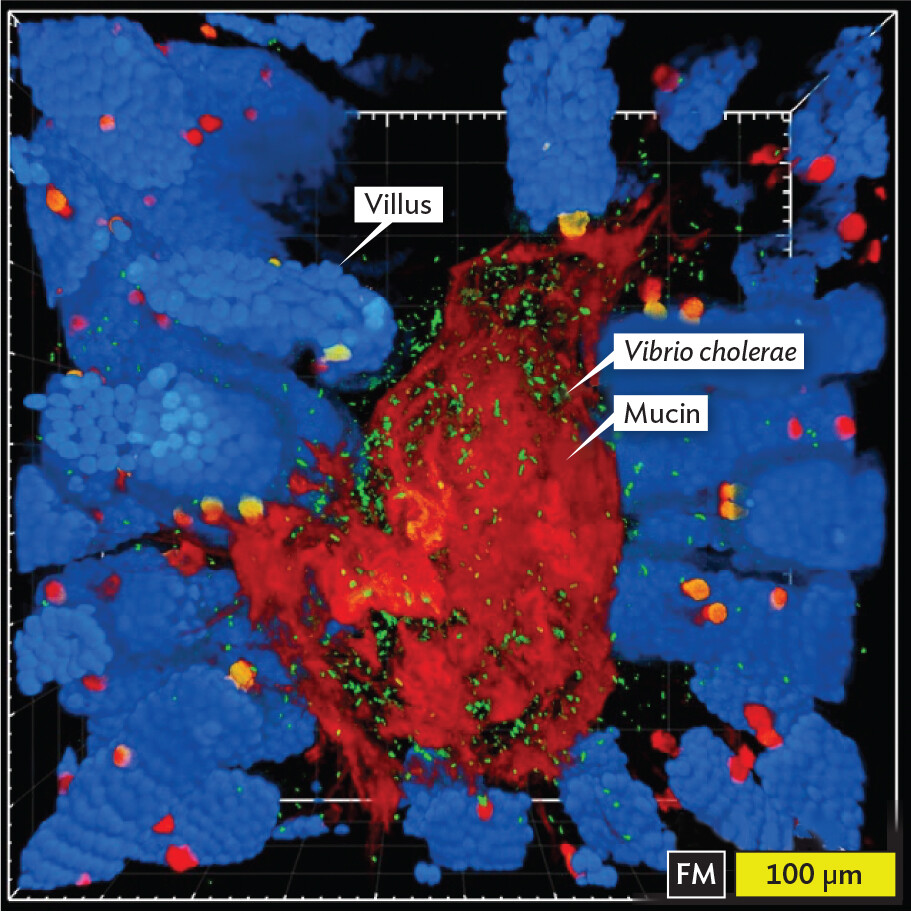
Fluorescent molecules offer amazing kinds of information about what happens inside cells and within microbial environments. In Figure 3.29A, Escherichia coli K-12 bacteria express tetracycline antibiotic resistance from a gene encoded on a plasmid, a small circle of DNA. The plasmid also encodes a protein that fluoresces red. As the plasmid is donated to tetracycline-sensitive cells (green), the sensitive cells become resistant to tetracycline (red). This experiment shows us how pathogens may acquire drug resistance in a hospital. In Figure 3.29B, an advanced type of fluorescence microscopy provides 3D images of pathogens within the body. Individual cells of Vibrio cholerae, the cause of cholera, are attached to the mouse intestinal epithelium.
Figure 3.29Fluorescence Microscopy Can Tell Us What Happens inside Cells
More information
A fluorescence micrograph of E coli K 12 cells. There are numerous rod shaped bacteria. Some are connected in chains. About a third to one half of the cells fluoresce bright red. About one half to two thirds of the cells fluoresce bright green. Each bacterium is about 1.5 micrometers in length and 0.5 micrometer in width.
A.E. coli K-12 bacteria express tetracycline resistance from a gene encoded on a plasmid, which also encodes a protein that fluoresces red. As the plasmid is donated to tetracycline-sensitive cells (green), the sensitive cells become resistant to tetracycline (red).More information
A fluorescence micrograph of mouse intestinal tissue. The micrograph shows a 3 D visual of mouse intestinal tissue. There are many blue globule shapes filling most of the area on the sides of the square field of view. One of these globules is labeled villus. There are some red dots scattered over the blue globules. There is a large red mass in the center labeled Mucin. Some tiny green specs can be seen in around the blue globules, but many are found in the center red mass. There are black holes in many of the places where most green specks are found. The green specks are labeled Vibrio cholerae. One blue globule, a villus, is about 150 micrometers long. The red mass of Mucin is about 300 micrometers tall and 200 micrometers wide. The green specks, the Vibrio cholerae cells, are each smaller than 1 micrometer.
B. Three-dimensional visualization of mouse intestinal tissue, with cell nuclei (blue fluorescence) secreting mucin (red) into the gut lumen. Vibrio cholerae cells fluoresce green. Source: William DePas and Dianne Newman, Caltech.
Electron Microscopy
In an electron microscope, beams of electrons generate images at resolution levels up to a thousandfold greater than that possible for light microscopy. Electron microscopy reveals microbes in remarkable detail. In research, we use the electron microscope to observe virus infection and propagation and to study subcellular structures such as ribosomes and toxin-secreting organelles.
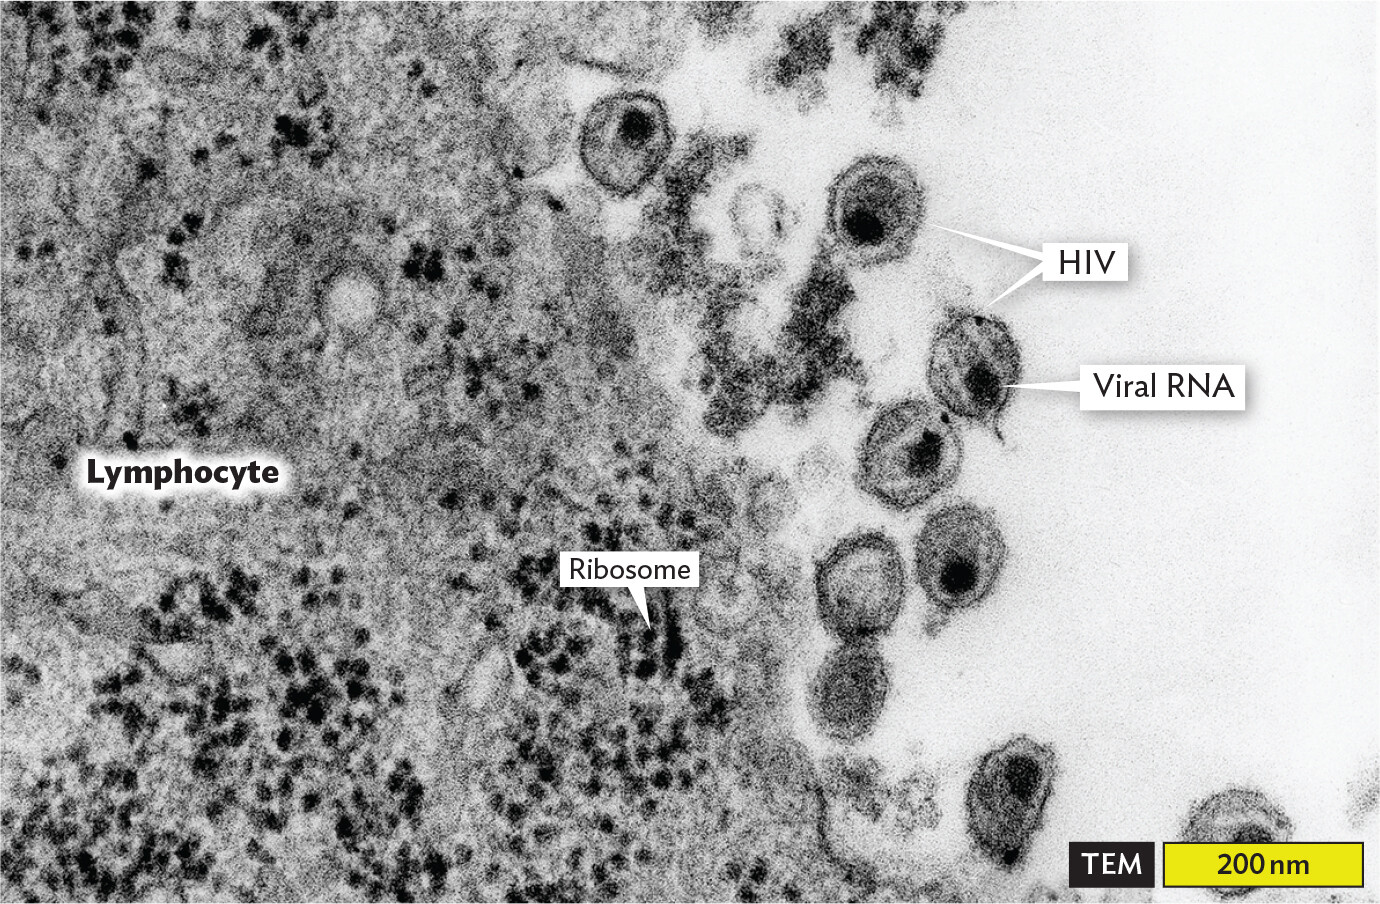
An important use of electron microscopy is observation of the life cycle of human immunodeficiency virus (HIV), the cause of acquired immunodeficiency syndrome (AIDS). Figure 3.30 shows an image generated by transmission electron microscopy (TEM). To generate a TEM image, the electron beams penetrate a thin section of tissue stained with an electron-dense heavy-atom salt. The image shows HIV particles budding out of an infected lymphocyte (blood cell involved in antibody production). The dark spot within each virus particle is its ribonucleic acid (RNA) genome, compacted by special proteins. But note that, in TEM, only a slice through the virion is seen. The TEM resolution is high enough to reveal individual ribosomes (small dark spots) within the cytoplasm of the infected cell.
Figure 3.30 Transmission Electron Micrograph (TEM) of HIV Particles Emerging from an Infected Lymphocyte
More information
A transmission electron micrograph of H I V particles emerging from an infected lymphocyte. The lymphocyte is a large gray mass covering half of the field of view. Only a portion of the lymphocyte is seen. There are numerous ribosomes within the lymphocyte which have the appearance of tiny dark spheres. Roughly spherical H I V particles emerge from the lymphocyte into the extracellular space. The H I V particles contain tightly packed viral R N A, which is seen as an irregularly shaped dark mass within each particle. Each H I V particle has a diameter of about 100 nanometers.
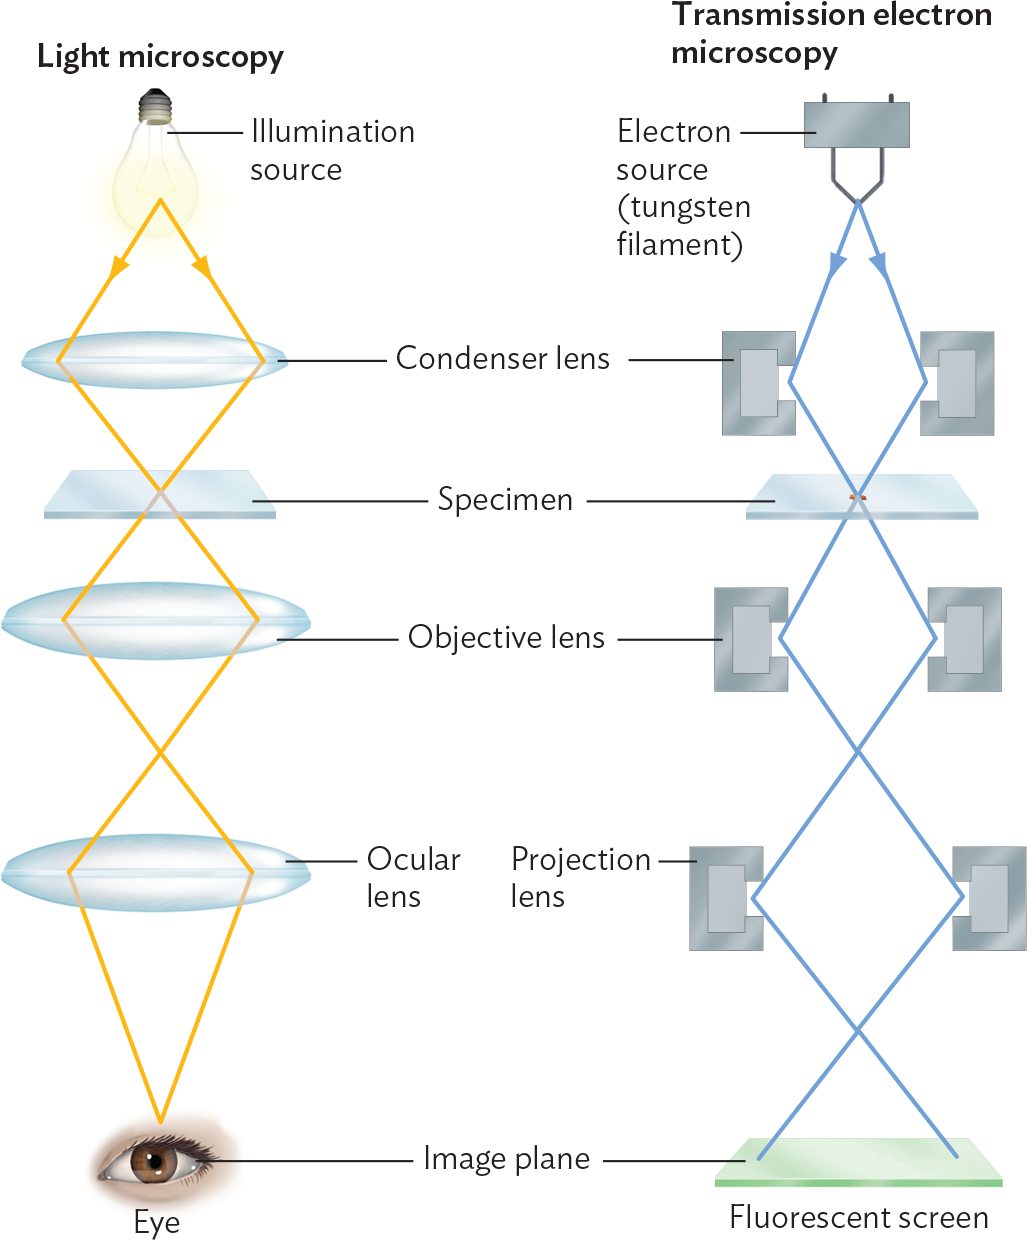
How does an electron microscope work? The apparatus requires an evacuated sample chamber and a series of magnetic lenses. The transmission electron microscope parallels the design of a bright-field microscope (Figure 3.31). The image is generated by a beam of electrons, instead of light. Electrons are ejected from a metal subjected to a voltage potential. The electrons travel in a straight line, like photons. And like photons, electrons interact with matter and exhibit the properties of waves. Beams of electrons are focused by means of a magnetic field. The shape of the magnet is designed to focus the beam of electrons in a manner analogous to the focusing of photons by a refractive lens. Overall, the electron beam passes through a magnetic condenser lens, a specimen, and a magnetic objective lens. A projection lens projects the image onto a fluorescent screen, and the final images are obtained by a digital camera.
Figure 3.31 Transmission Electron Microscopy (TEM) Compared with Light Microscopy
More information
A diagram comparing light microscopy and transmission electron microscopy. The two systems are shown side by side. In light microscopy the energy wave comes from an illumination source. In transmission electron microscopy, abbreviated T E M, the energy comes from an electron source of tungsten filament. In both systems the light or electron passes through a condenser lens, then through the specimen at the focal point, and then through an objective lens. In light microscopy the light then passes through an ocular lens and into an eye which is the image plane. In T E M the electron then passes through a projection lens and onto a fluorescent screen which is the image plate. The lenses of a light microscope are in an oval shape, and T E M’s lenses have a box shaped structure.
In a transmission electron microscope (right), the light source is replaced by an electron source consisting of a high-voltage current applied to a tungsten filament, which gives off electrons when heated. The electron beam is focused by magnetic lenses equivalent to the condenser, objective, and ocular lenses of a light microscope, and the image is projected onto a fluorescent screen by a projection lens.
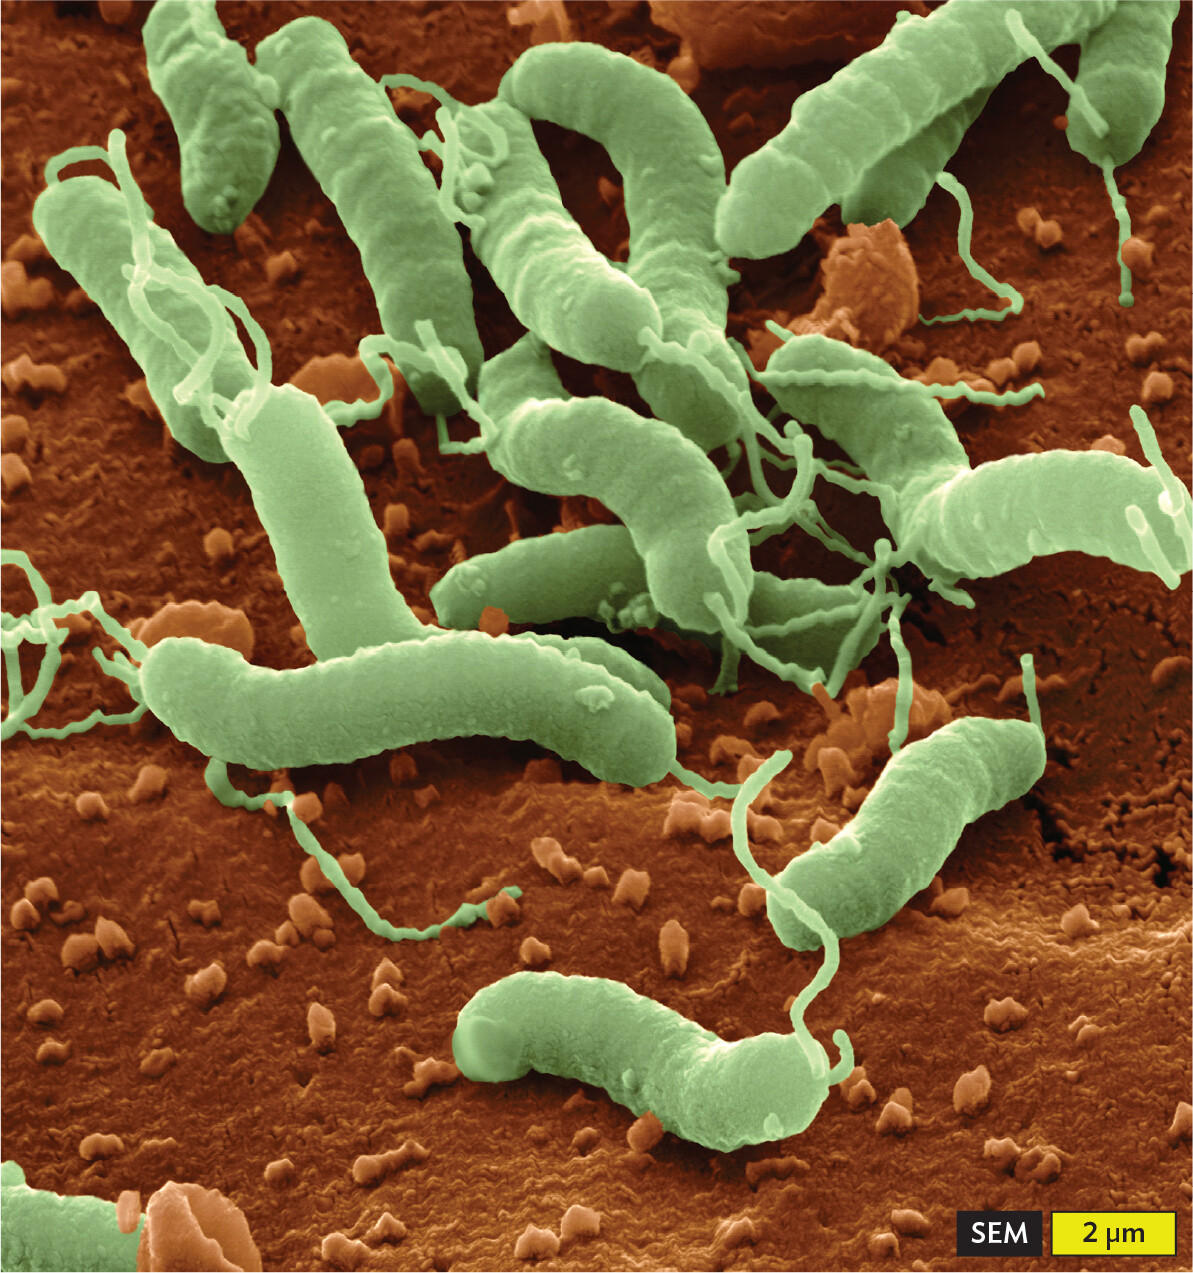
Another type of electron microscopy, which provides a better view of a cell’s surface structure, is scanning electron microscopy (SEM). In SEM, the electron beams scan the specimen and are reflected by stain molecules to reveal the contours of the specimen’s 3D surface. SEM can be performed for a wide range of microbe sizes. SEM was used to define the shape and habitat of Helicobacter pylori, the major cause of gastritis (Figure 3.32). H. pylori inhabits the human stomach, a region long believed too acidic to harbor life. In the 1980s, however, Australian scientist Barry Marshall reported finding a new species of bacterium in the stomach. The bacterium, Helicobacter pylori, proved difficult to isolate and culture, and for over a decade, medical researchers refused to believe Marshall’s report. Ultimately, electron microscopy (EM) confirmed the existence of H. pylori in the stomach and helped document its role in gastritis and stomach ulcers.
Figure 3.32Helicobacter pylori within the Crypt Cells of the Stomach Lining
More information
A scanning electron micrograph of Helicobacter pylori within the crypt cells of the stomach lining. The stomach lining has a ruched and bumpy appearance with small bead like structures across the surface. Rod shaped bacteria are present in the depressions of the intestinal lining. Thin strands of flagella extend outward from the bacteria. Each bacterium is about 8 micrometers in length and 2 micrometers in width. The stomach lining has been colorized brown in this micrograph. The bacteria have been colorized green.
H. pylori bacteria grow on the lining of the human stomach, a location previously believed too acidic to permit microbial growth. Colorized to indicate bacteria (green).
The scanning electron micrograph in Figure 3.32 shows H. pylori growing upon the gastric crypt cells. H. pylori bacteria are helical rod-shaped cells. The cell contours are well resolved by the scanning beam of electrons, an achievement far beyond a light microscope’s capacity. In Figure 3.32, note also the use of colorization to emphasize particular aspects of the image. Colorization is a process by which the observer adds color to aid interpretation. The color added does not indicate any natural coloration, which cannot be observed through electron microscopy.
An important limitation of traditional electron microscopy, whether TEM or SEM, is that usually it can be applied only to fixed, stained specimens. The fixatives and heavy-atom stains can introduce artifacts (false structures not present in the original organism), especially at finer details of resolution. Different preparation procedures have sometimes led to substantially different interpretations of structure.
The development of exceptionally high-strength electron beams now permits low-temperature cryo-electron microscopy (cryo-EM). In cryo-EM, the specimen is flash-frozen—that is, suspended in water and frozen rapidly in a refrigerant of high heat capacity (ability to absorb heat). The rapid freezing avoids ice crystallization, leaving the water solvent in a glass-like phase. The specimen retains water content and thus closely resembles its living form, although it is still ultimately destroyed by electron bombardment. The sample does not require staining because the high-intensity electron beams increase the signal intensity compared to that of earlier instruments. Another innovation in cryo-EM is tomography, in which images are projected from different angles of a transparent specimen. Tomography avoids the need to physically slice the sample for thin-section TEM. The images from EM tomography are combined digitally to visualize the entire object in three dimensions.
You can use the tools of microscopy described in this chapter to discover microbes in our environment and to reveal pathogens in human samples. Next, in Chapter 4, you will learn the molecular building blocks of the microbes you observe by microscopy. You will see how small molecules, such as phospholipids, form flexible membranes for cell compartments and how large macromolecules, such as DNA and proteins, store information. These molecules all function together within a cell, as we explore further in Chapter 5.
SECTION SUMMARY
Dark-field microscopy uses scattered light to detect objects too small to be resolved by light rays.
Phase-contrast microscopy (PCM) superimposes refracted light and transmitted light shifted out of phase so as to show small differences in refractive index as distinct patterns of light and dark. This method is used to observe transparent organelles with low contrast.
Interference microscopy superimposes interference bands on an image, accentuating small differences in refractive index.
Fluorescence microscopy (FM) detects specific cells or cell parts on the basis of fluorescence by a fluorophore. Cell parts can be labeled by a fluorophore attached to an antibody stain.
Transmission electron microscopy (TEM) is based on the focusing of electron beams that penetrate a thin sample, usually stained with a heavy-metal salt that blocks electrons. TEM obtains much higher resolution than light microscopy.
Scanning electron microscopy (SEM) involves scanning a 3D surface with an electron beam.
Thought Question 3.4 Compare fluorescence microscopy with dark-field microscopy. What similar advantage do they provide, and how do they differ?
SHOW ANSWERHIDE ANSWER
Both dark-field and fluorescence microscopy enable detection (but not resolution) of objects whose dimensions are below the wavelength of light. Dark-field technique is based on light scattering, which detects all small objects without discrimination. The technique is relatively simple and inexpensive. Fluorescence requires more complex optics to separate light at different wavelengths for excitation and emission. The fluorescence technique, however, provides a way to label specific parts of cells, such as cell membrane or DNA, or particular species of microbes by use of fluorescent antibody tags.
Thought Question 3.5 You have discovered a new kind of microbe, never observed before. What kind of questions about this microbe might be answered by light microscopy? What questions would be better addressed by electron microscopy?
SHOW ANSWERHIDE ANSWER
Light microscopy could answer questions such as: What is the overall shape of this cell? Does it form individual cells or chains? Is the organism motile? Only light microscopy can visualize an organism alive. Electron microscopy can answer questions about internal and external subcellular structures. For example, does a bacterial cell possess external structures such as flagella or pili? If the dimensions of the unknown microbe are smaller than the lower limits of a light microscope’s resolution, EM may be the only way to observe the organism. Viruses are often characterized by shape, and this shape is observed by electron microscopy.
Microscopy in which contrast is generated by variable values of refractive index within the specimen, leading to additive and subtractive interference patterns between the light that penetrates the specimen and the light transmitted outside the specimen.