eResearch Activity 1
Do Bacteria Make Neurotransmitters for the Human Brain?
Our intestines support a vast community of diverse bacteria that help digest our food. Some products of this bacterial digestion actually modulate the function of our nervous system—and possibly directly affect our brain. For example, bacteria that catabolize glutamic acid (an amino acid) release the waste product 4-aminobutanoate (GABA). In our nervous system, GABA is a major neurotransmitter. Could gut bacteria be producing our neurotransmitters?
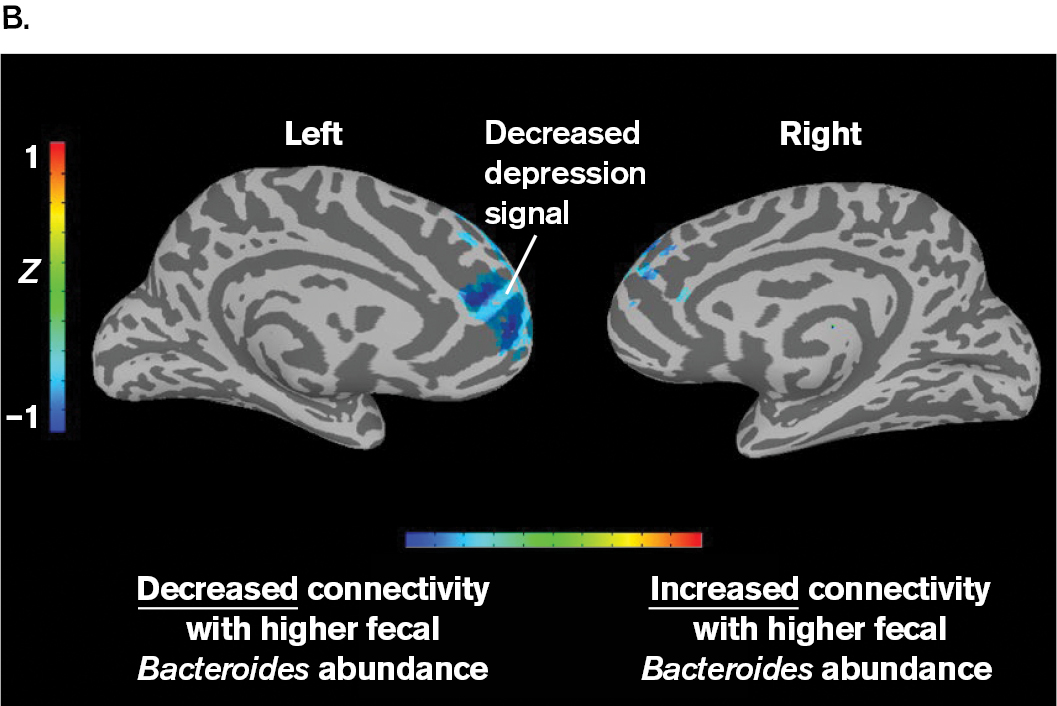
Philip Strandwitz, a young scientist at the Massachusetts Institute of Technology (MIT), set out to test the possibility that bacteria produce neurotransmitters that influence our brain. He focused on Bacteroides bacteria, which are known to catabolize many kinds of molecules in our gut. In a remarkable experiment, Strandwitz’s research team compared “functional connectivity” (a brain signal associated with depression) with the level of Bacteroides bacteria excreted in human feces (Fig. ERA 1.1). The human subjects had depressive disorder, which is associated with the brain region tested. Strandwitz asked whether functional connectivity as a depression signal might depend on Bacteroides bacteria. In fact, he found an inverse correlation between the Bacteroides and the depressive signal in the brain: The more Bacteroides were found in the gut microbiome, the lower the brain’s depression signal.

More information
A two part figure of a photo and a scan of Bacteroides bacteria show an inverse correlation with a brain signal of depression. Part A is a photo of Philip Strandwitz. Philip has red hair, a beard and a black button up shirt. He’s sitting in an office space in front of a computer.
More information
Part B is a scan of a brain. The scan shows the left and right sides of the brain including a colorized key. The color key goes from cooler tones to warm tones indicating decreased connectivity with higher fecal Bacteroides abundance at blue to increased connectivity with higher fecal Bacteroides abundance in red. Blue is seen in most of the prefrontal cortex on the left side of the brain. A small amount of blue is seen in the prefrontal cortex on the right side of the brain.
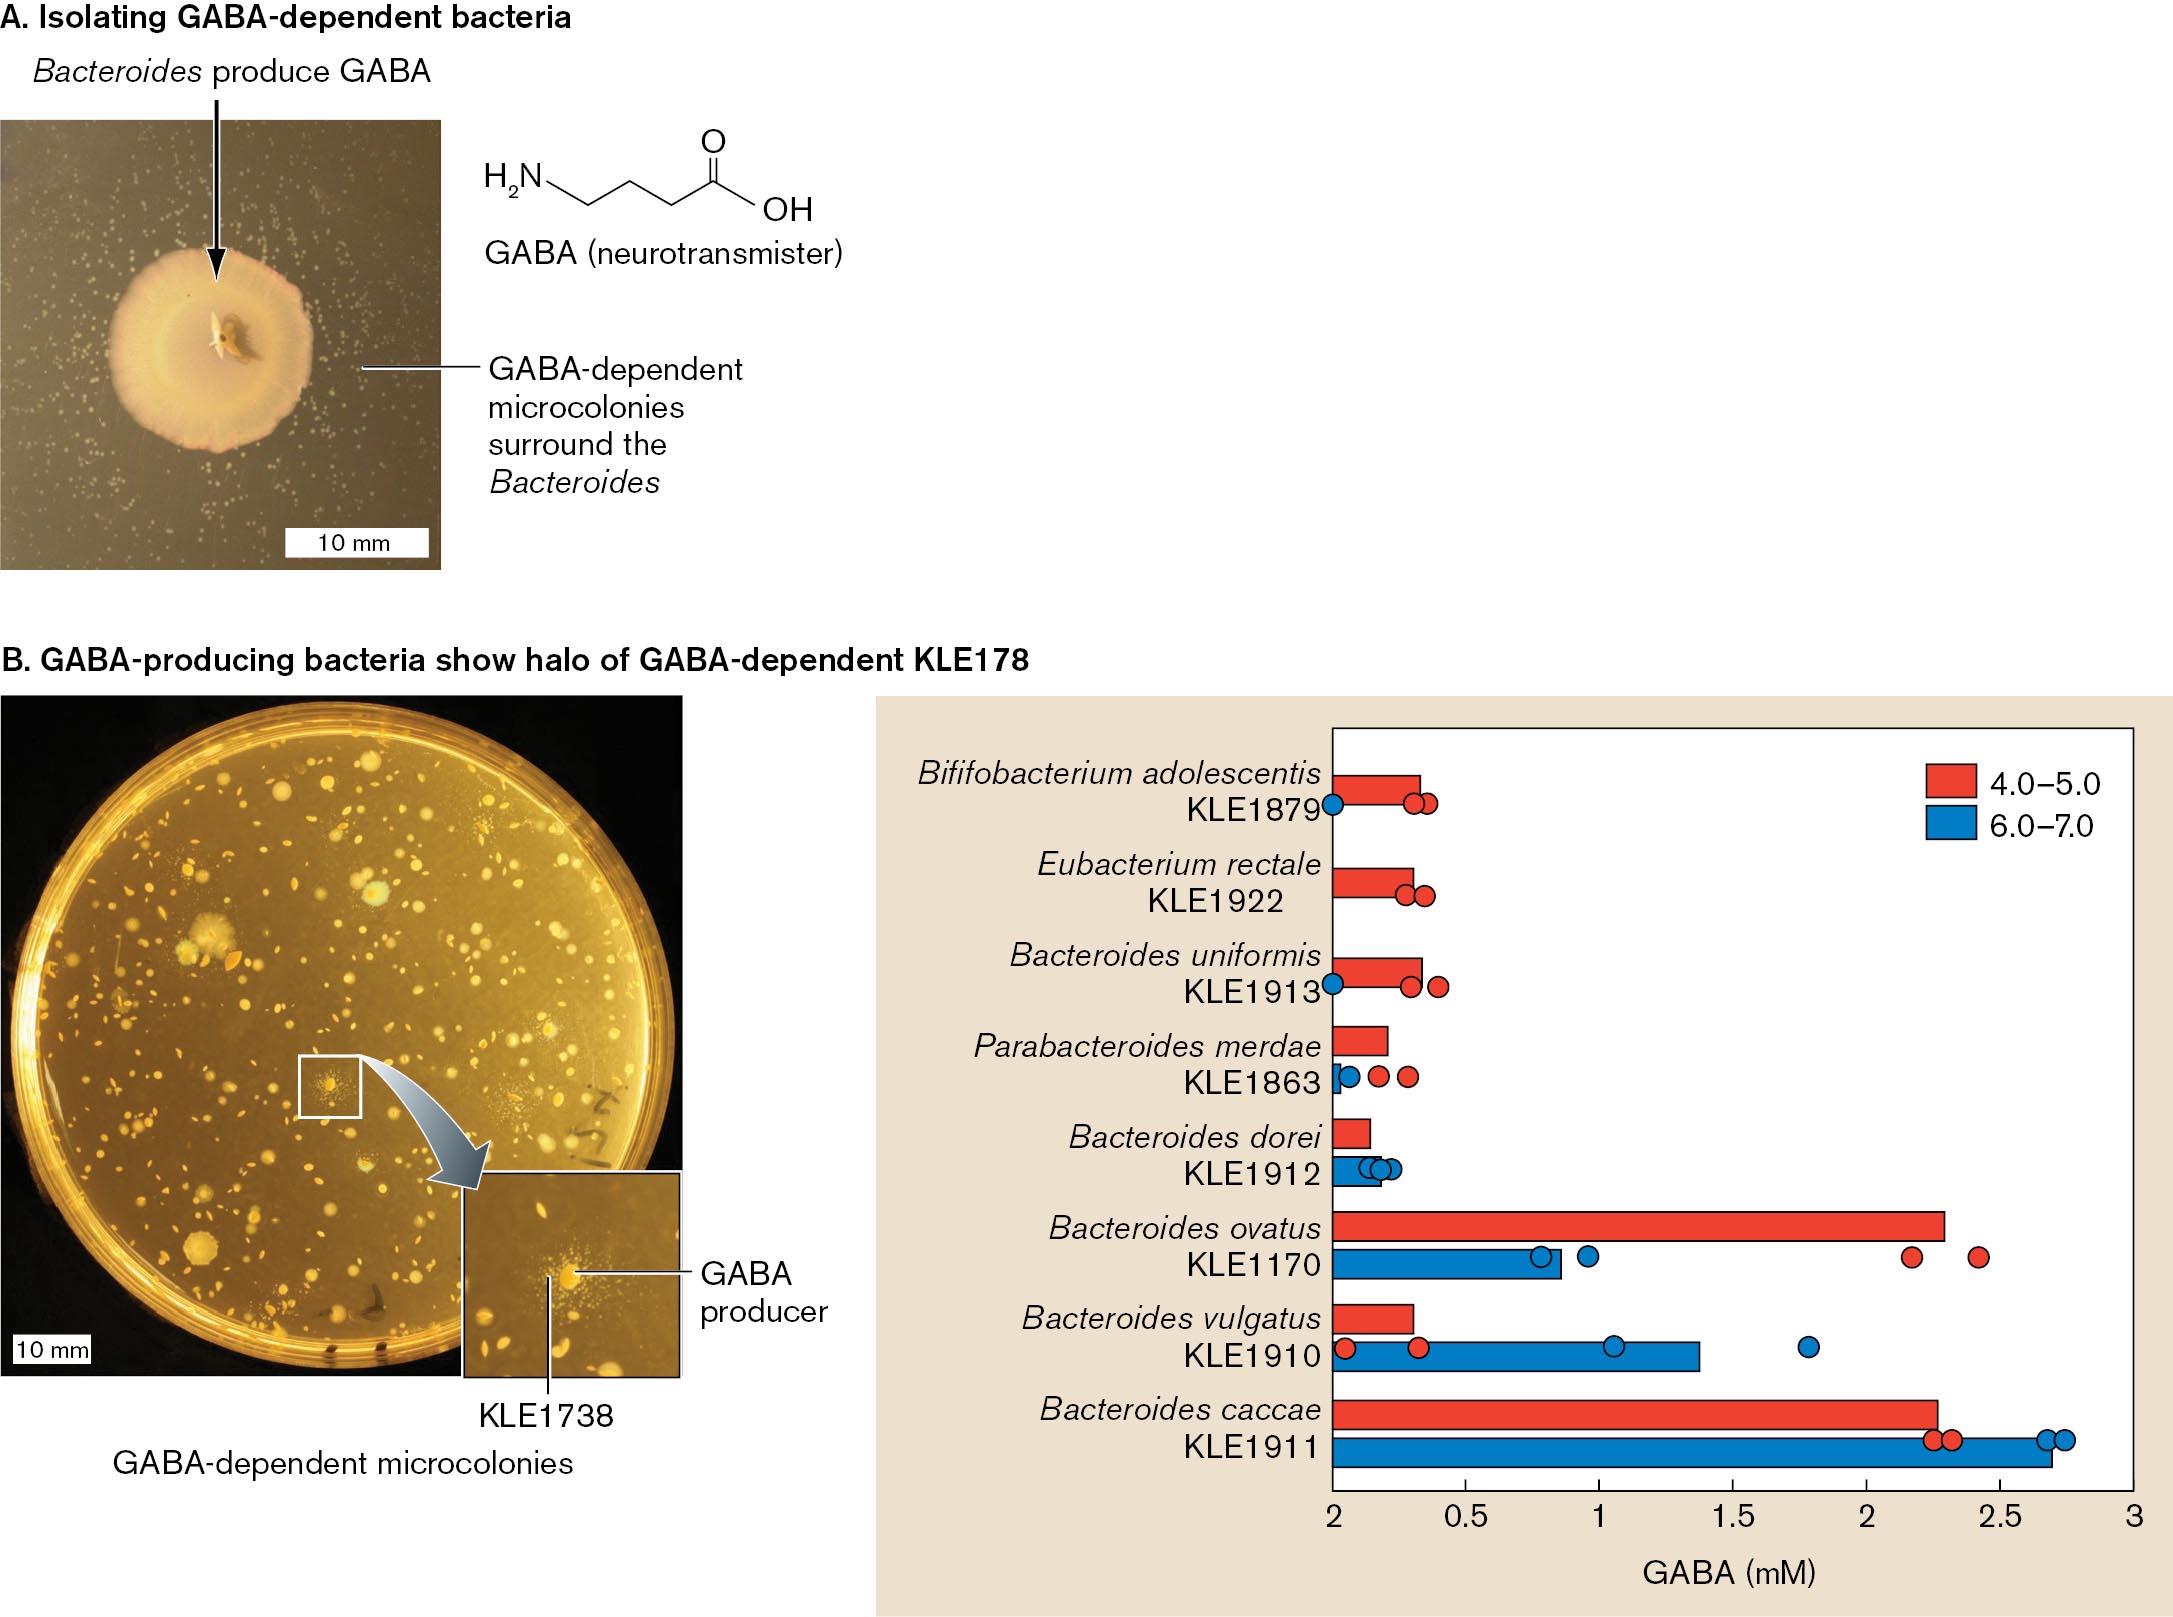
Strandwitz pursued a possible connection between mental depression and gut microbial metabolism. He knew that some Bacteroides strains convert glutamic acid (glutamate) to GABA, a neurotransmitter that may decrease anxiety and depression. Strandwitz wondered whether the gut microbiome includes GABA producers and consumers. To identify GABA consumers, bacteria from the human gut were plated on rich medium containing yeast extract. After up to a week, smaller colonies were then plated in the presence of Bacteroides (Fig. ERA 1.2A). One novel strain grew microcolonies in the presence of Bacteroides. This strain, designated KLE1738, was found to require GABA for growth and, remarkably, could not grow on glucose or any amino acids as a carbon source.
The GABA-dependent strain KLE1738 was then used to identify additional gut species that produce GABA. When gut bacteria were plated on a lawn of KLE1738, those colonies that produce GABA were each surrounded by a halo of KLE1738 microcolonies. These new GABA producers were then screened for GABA production. Some species produced GABA in response to acid stress (pH 4–5), which would occur from stomach passage, whereas others produced GABA at pH 6–7, which is typical of the intestinal tract (Fig. ERA 1.2B). Together, the GABA producers and consumers might maintain a steady-state GABA level in the gut. While no causation is proven, these observations have led Strandwitz and his team to pursue possible mechanisms by which gut GABA could affect neural connections in the brain.
More information
A two part figure of isolating gut bacteria that produce G A B A. Part A is a photo of Bacteroides producing G A BA on a petri dish. A chemical structure of G A B A is also included the chemical structure includes a 4 carbon chain with N H subscript 2 on the fourth carbon, a double bonded oxygen on the first carbon and an O H group bonded to the first carbon. The Bacteroides colony appears tan and circular. G A B A dependent microcolonies surround the Bacteroides.
Part B is a photo of a petri dish and a bar graph. The petri dish is growing a bacteria and it’s G A B A dependent K L E 178 microcolonies. The main bacterial colonies are seen as large white circles. The microcolonies are seen as halos around the main bacterial colony. The microcolonies are labeled K L E 1738. The graph shows multiple bacteria producing G A B A at various pH. The pH range of 4.0 to 5.0 is graphed in red. The pH range of 6.0 to 7.0 is graphed in blue. The x axis is G A B A production in milli molar. The y axis is the following bacterium Bilfifobacterium adolescentis, K L E 1879, Eubacterium rectale, K L E 1922, Bacteroides uniformis, K L E 1913, Parabacteroides merdae, K L E 1863, Bacteroides dorei, K L E 1912, Bacteroides ovatus, K L E 1170, Bacteroides vulgatus, K L E 1910, Bacteroides caccae, K L E 1911. All KLE species are graphed in blue. Bififobacterium adolescentis is graphed at 0.42 mM. Eubacterium rectale is graphed at 0.4 mM. Bacteroides uniformis is graphed at 0.42 mM. Parabacteroides merdae is graphed at 0.3 mM. Bacteroides dorei is graphed at 0.2 mM. Bacteroides ovatus is graphed at 2.3 mM. Bacteroides vulgatus is graphed at 0.38 mM. Bacteroides caccae is graphed at 2.25 mM. K L E 1879, K L E 1922, K L E 1913 are all graphed at 0. K L E 1863 is fraphed at .01 mM. K L E 1912 is graphed at 0.25 mM. K L E 1170 is graphed at 0.8 mM. K L E 1910 is graphed at 1.38 mM. K L E 1911 is graphed at 2.67 mM.
Further Exploration
What experiments in mice do you think might show more directly the mechanism of how gut bacterial GABA production modulates behavior? How might the role of steady-state GABA levels be tested? What human organ systems might mediate the connection between gut bacteria GABA and neural connections?
Strandwitz, Philip, Ki Hyun Kim, Darya Terekhova, Joanne K. Liu, Anukriti Sharma, et al. 2019. GABA-modulating bacteria of the human gut microbiota. Nature Microbiology 4:396–403.