Demand exists when an individual or group wants something badly enough to pay or trade for it. How much an individual or group actually buys depends on the price of the good or service. In economics, the amount of a good or service that buyers are willing and able to purchase at the current price is known as the quantity demanded.
Trade creates value
When the price of a good increases, consumers often respond by purchasing less of the good or buying something else. For instance, many consumers who would buy salmon at $5 per pound would likely buy something else if the price of salmon rose to $20 per pound. Therefore, as price goes up, quantity demanded goes down. Similarly, as price goes down, quantity demanded goes up. This negative (opposite) relationship between the price and the quantity demanded is the law of demand. The law of demand states that, all other things being equal, the quantity demanded falls when the price rises, and the quantity demanded rises when the price falls. The law of demand holds true over a wide range of goods and settings.
PRACTICE WHAT YOU KNOW
Markets and the Nature of Competition
More information
A worker at a farmers market fills a plastic bin with produce for a customer.
Is this a competitive market?
QUESTION: Which of the following are competitive markets? How will each firm price its products, and how much market power does each firm have?
gas stations at a busy interstate exit
a firm that develops a vaccine for a new disease
a fresh produce stand at a farmers’ market
ANSWERSANSWERS:
Because each gas station sells the same product and competes for the same customers, they often charge the same price. This is a competitive market. However, gas stations also differentiate themselves by offering conveniences such as fast food, clean restrooms, ATM machines, and so forth. The result is that individual stations have some market power.
The firm has something that people need and other sellers can’t provide. The developer can charge whatever customers will pay, without worrying about rivals offering the same vaccine at a lower price. This is not a competitive market.
Because consumers can buy fresh produce in season from many stands at a farmers’ market, individual vendors have very little market pricing power. They must charge the same price as other vendors in order to attract customers. This is a competitive market.
The Demand Curve
Incentives
A table that shows the relationship between the price of a good and the quantity demanded is known as a demand schedule. To discuss this idea (and to take a break from fish markets), let’s introduce a new hypothetical involving action hero and former athlete Dwayne “The Rock” Johnson. The Rock gets a lot of bumps and bruises in his active career, and Table 3.1 shows The Rock’s hypothetical demand schedule for healing crystals. When the price is $20.00 or more per crystal, The Rock will not purchase any crystals. However, below $20.00, the amount The Rock purchases is negatively related to the price. For instance, at a price of $10.00, The Rock demands 4 crystals. If the price rises to $12.50, he demands 3 crystals. Every time the price increases, The Rock buys fewer crystals. In contrast, every time the price falls, he buys more. If the price falls to zero, The Rock would demand 8 crystals. That is, even if the crystals are free, there is a limit to his demand because he would grow tired of using the crystals.
TABLE 3.1
The Rock’s Demand for Healing Crystals
Price of healing crystals
Number demanded
$20.00
0
17.50
1
15.00
2
12.50
3
10.00
4
7.50
5
5.00
6
2.50
7
0.00
8
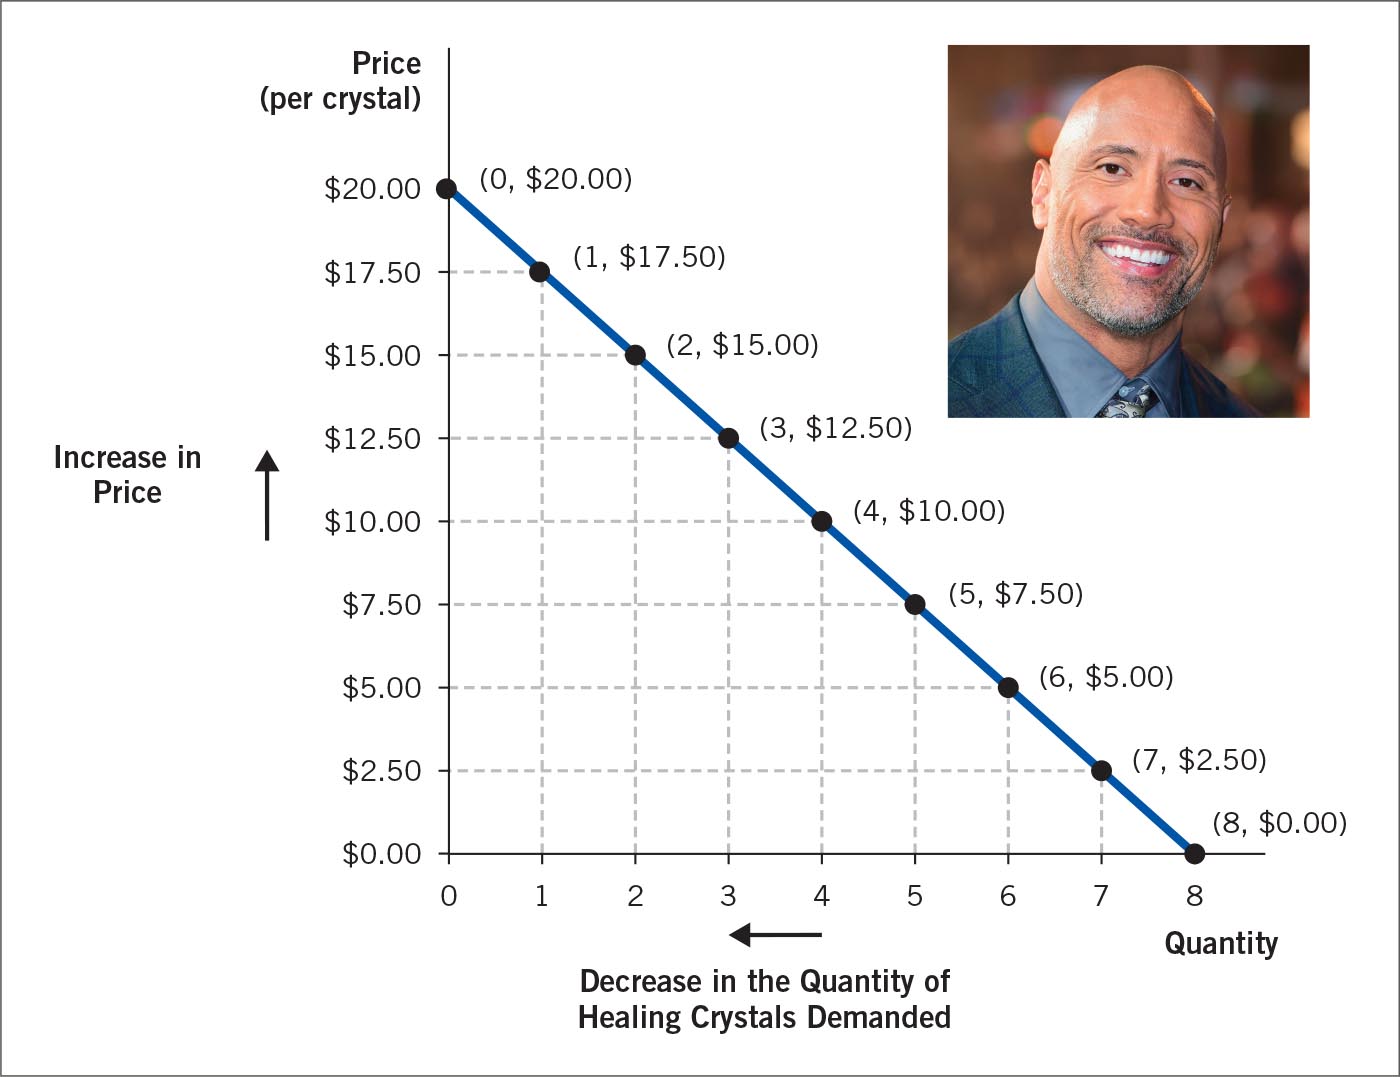
The numbers in The Rock’s demand schedule from Table 3.1 are plotted on a graph in Figure 3.1, known as a demand curve. A demand curve is a graph of the relationship between the prices in the demand schedule and the quantity demanded at those prices. For simplicity, the demand “curve” is often drawn as a straight line. Economists always place the independent variable, which is the price, on the y (vertical) axis and the dependent variable, which is the quantity demanded, on the x (horizontal) axis. The relationship between the price and the quantity demanded produces a downward-sloping curve. In Figure 3.1, we see that as the price rises from $0.00 to $20.00 along the y axis, the quantity demanded decreases from 8 to 0 along the x axis.
FIGURE 3.1
The Rock’s Demand Curve for Healing Crystals
The Rock’s demand curve for healing crystals plots the data from Table 3.1. When the price of a crystal is $10.00, he buys 4. If the price rises to $12.50, The Rock reduces the quantity he buys to 3. The figure illustrates the law of demand by showing a negative relationship between price and the quantity demanded.
More information
A demand curve. The Y axis shows price (per crystal), and the X axis shows quantity of healing crystals. The demand curve is linear with a negative slope indicating that as the price of healing crystals decreases, the quantity of healing crystals demanded increases and vice versa. An inset shows the actor known as The Rock.
Market Demand
So far, we have studied individual demand, but a market is composed of many different buyers. In this section, we examine the collective demand of all of the buyers in a given market.
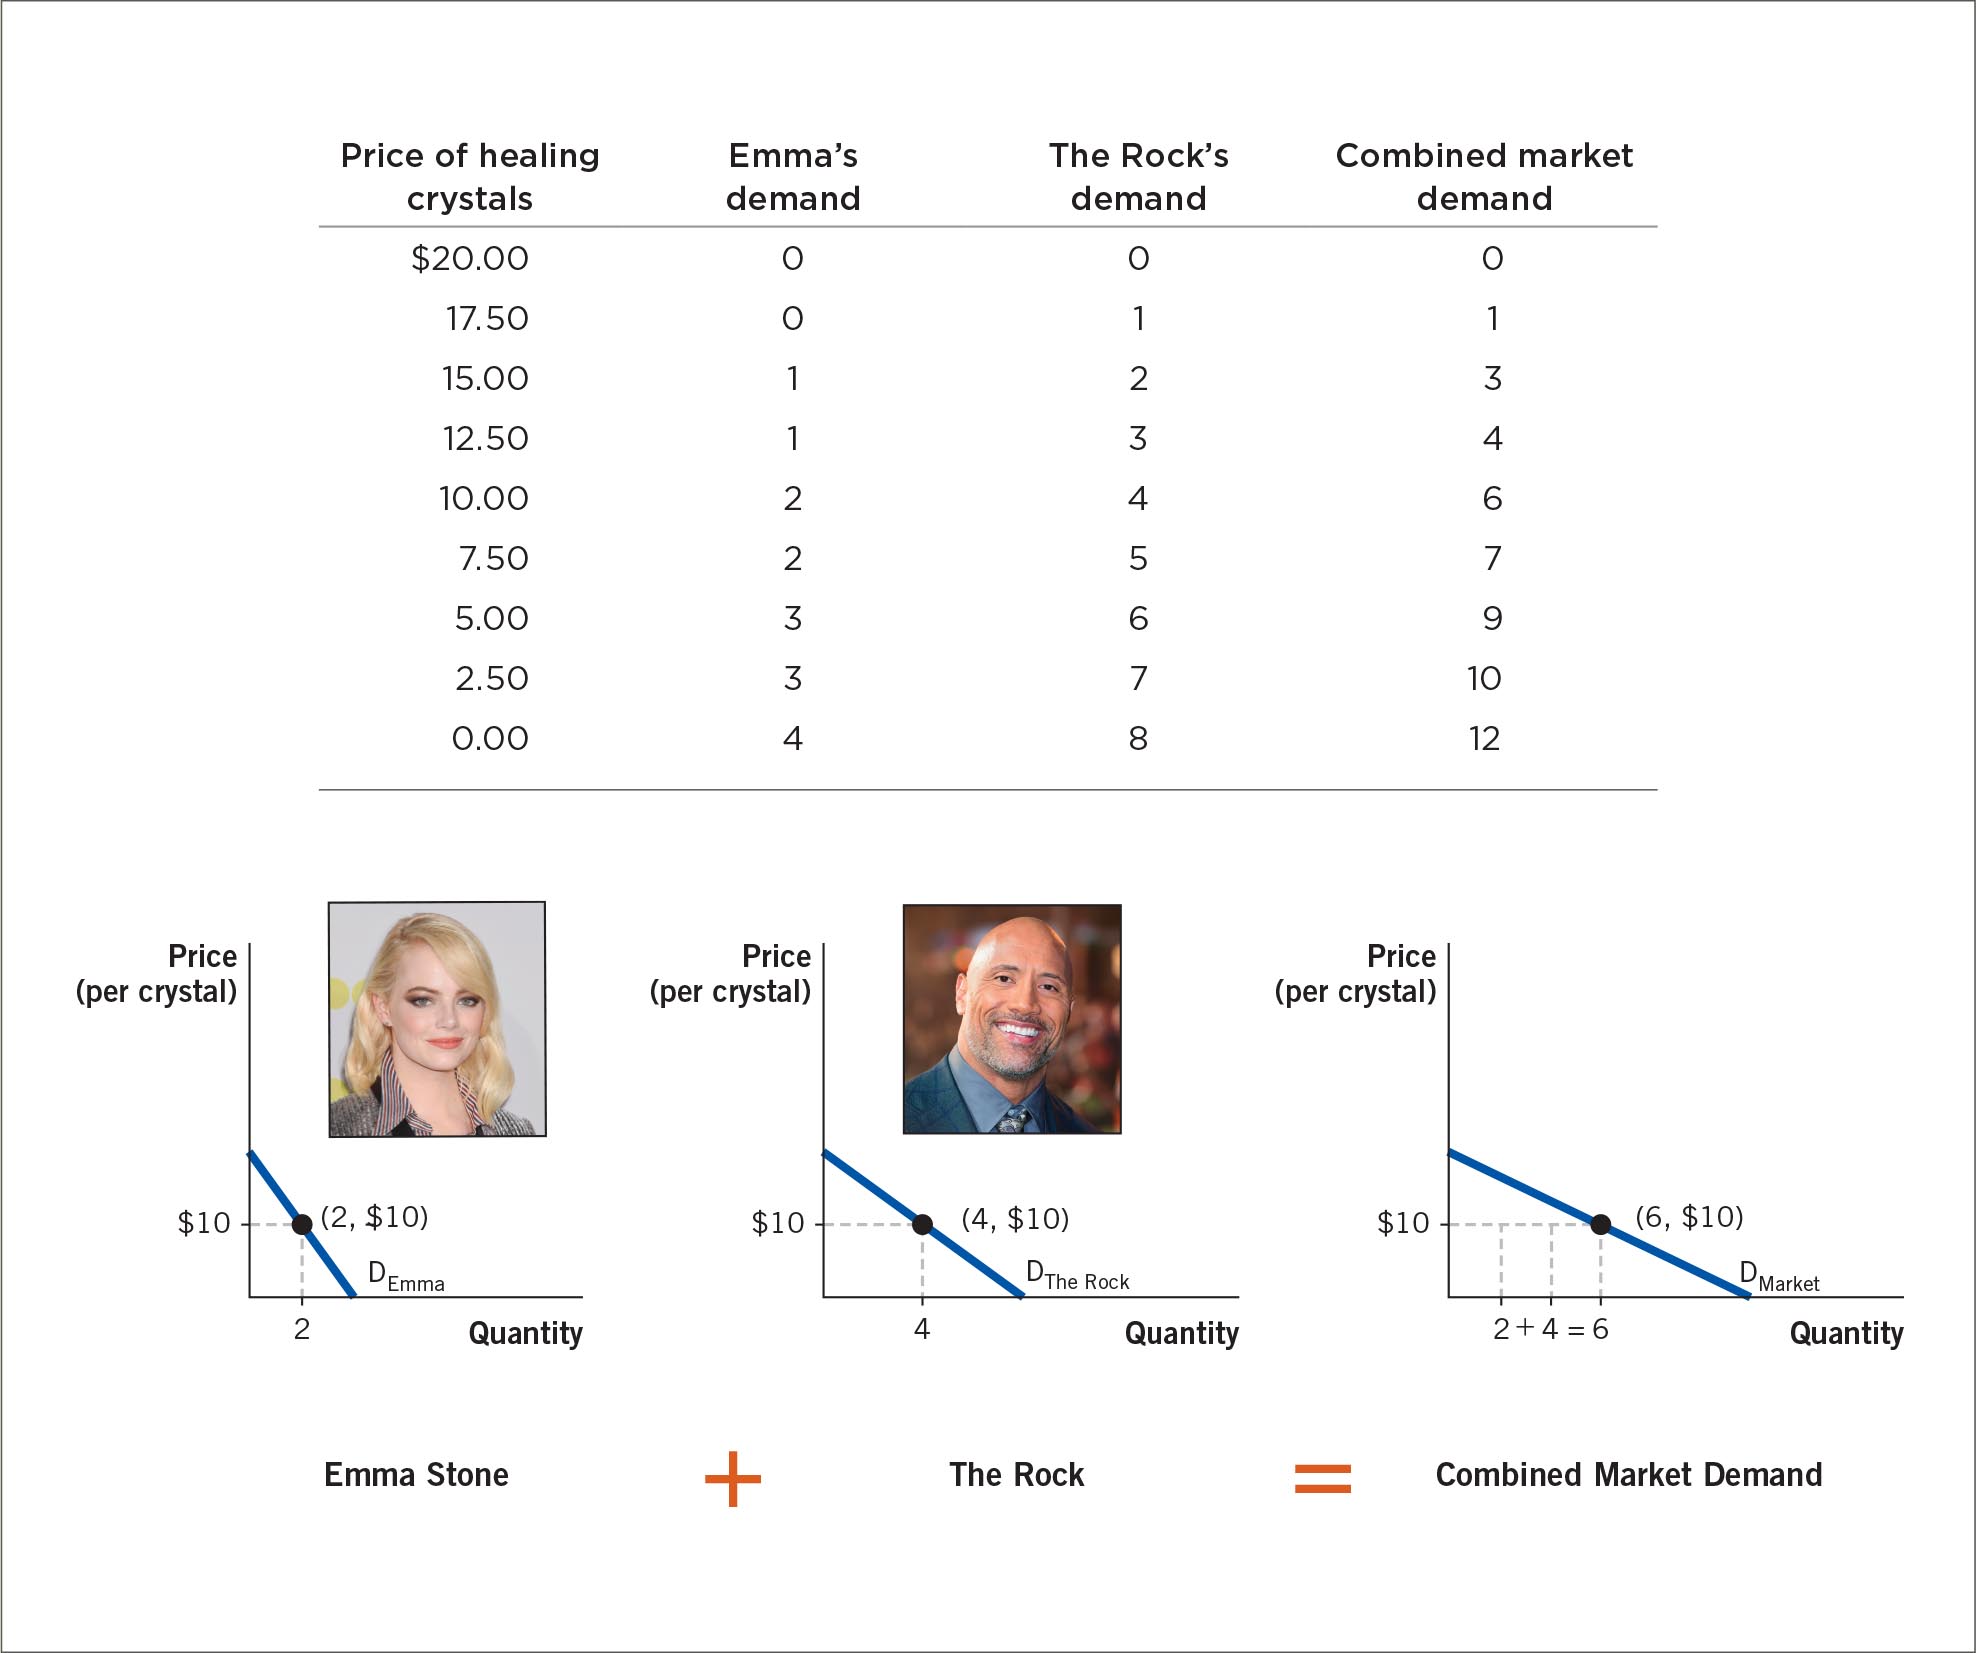
The market demand is the sum of all the individual quantities demanded by each buyer in a market at each price. During a typical day, thousands of individuals buy healing crystals. However, to make our analysis simpler, let’s assume that our market consists of only two buyers, The Rock and Emma Stone, each of whom enjoys using healing crystals. Figure 3.2 shows individual demand schedules for the two people in this market, a combined market demand schedule, and the corresponding graphs. At a price of $10, Emma buys 2 crystals, while The Rock buys 4. To determine the market demand curve, we add Emma’s 2 to The Rock’s 4 for a total of 6 crystals. As you can see in the table within Figure 3.2, by adding Emma’s demand and The Rock’s demand, we arrive at the total (that is, combined) market demand. Any demand curve shows the law of demand with movements along (up or down) the curve that reflect the effect of a price change on the quantity demanded of the good or service. Only a change in price can cause a movement along a demand curve.
Shifts of the Demand Curve
We have examined the relationship between price and quantity demanded. This relationship, described by the law of demand, shows us that when price changes, consumers respond by altering the amount they purchase. But in addition to price, many other variables influence how much of a good or service is purchased. For instance, news about the possible risks or benefits associated with the consumption of a good or service can change overall demand.
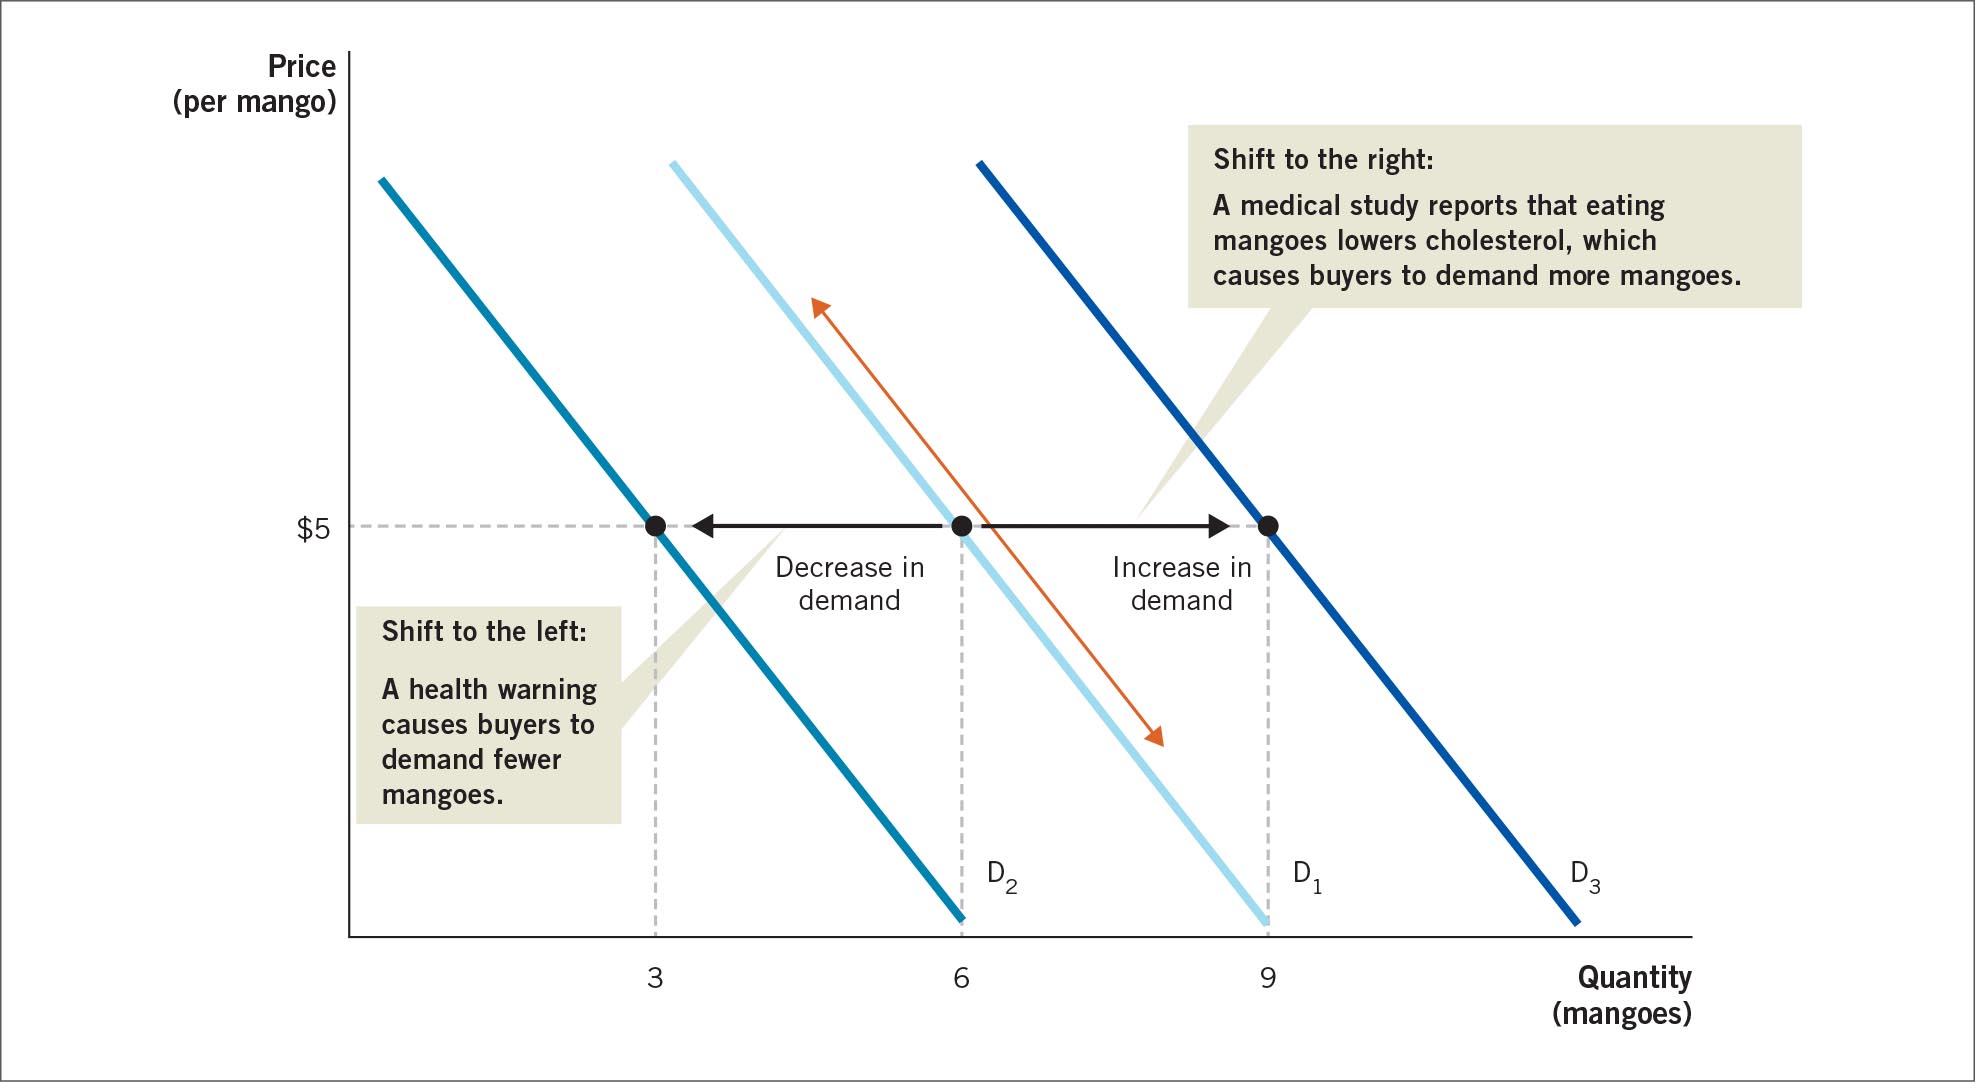
Suppose the government issues a nationwide safety warning that cautions against eating mango because of a recent discovery of Listeria bacteria in some mangoes. The government warning would cause consumers to buy fewer mangoes at any given price, and overall demand would decline. Looking at Figure 3.3, we see that an overall decline in demand will cause the entire demand curve to shift to the left of the original curve, from D1 to D2. Note that though the price remains at $5 per mango, demand has moved from 6 mangoes to 3. Figure 3.3 also shows what does not cause a shift of the demand curve: the price. The orange arrow alongside D1 indicates that the quantity demanded will rise or fall in response to a price change. A price change causes a movement along a given demand curve, but it cannot cause a shift of the demand curve.
FIGURE 3.2
Calculating Market Demand
To calculate the market demand for healing crystals, we add Emma Stone’s quantity demanded and The Rock’s quantity demanded.
More information
Emmas Stones demand curve, labeled D subscript Emma, is linear with a negative slope, and at quantity 2, the price per crystal is 10 dollars. An inset shows actress Emma Stone.
The Rocks demand curve, labeled upper D subscript The Rock, is linear with a negative slope, and at quantity 2, the price per crystal is 10 dollars. An inset shows the actor known as The Rock.
The combined market demand curve, labeled D subscript Market, is linear with a negative slope, and at the quantity 6, with 2 demanded by Emma and 4 demanded by The Rock, the price per crystal is 10 dollars.
Incentives
A decrease in overall demand shifts the demand curve to the left. What happens when a variable causes overall demand to increase? Suppose that the news media have just announced the results of a medical study indicating that a mango contains a natural substance that lowers cholesterol. Because of the newly discovered health benefits of the mango, overall demand for it will increase. This increase in demand shifts the demand curve to the right, from D1 to D3, as Figure 3.3 shows.
FIGURE 3.3
A Shift of the Demand Curve
When the price changes, the quantity demanded changes along the existing demand curve, as indicated by the orange arrow. A shift of the demand curve, indicated by the black arrows, occurs when something other than price changes.
More information
Three linear demand curves with negative slopes. The outer two are shifts of the one in the middle. On the x axis is quantity of mangoes and on the y axis is price per mango. The initial demand curve, D1, intersects a point at quantity 6 and price $5. An arrow shifting to the left of D1 indicates that a decrease in demand results in the new demand curve, D2, that intersects a point at quantity 3 and price $5. The cause of this is a health warning buyers to demand fewer mangoes. An arrow shifting to the right of D1 indicates that an increase in demand results in the new demand curve, D3, that intersects a point at quantity 9 and price $5. The cause is from a medical study report that eating mangoes lowers cholesterol, which causes buyers to demand more mangoes.
In our mango example, we saw that demand shifted because of changes in consumers’ tastes and preferences. However, many different variables can shift demand. These include changes in buyers’ income, the price of related goods, changes in buyers’ tastes and preferences, price expectations, the number of buyers, and taxes.
More information
A whole mango next to one that has been peeled and cut into cubes.
If a new medical study indicates that eating more mango lowers cholesterol, would this finding cause a shift in demand, or a movement along the demand curve?
Figure 3.4 provides an overview of the variables, or factors, that can shift demand. The easiest way to keep all of these elements straight is to ask yourself a simple question: Would this change cause me to buy more or less of the good? If the change reduces how much you would buy at any given price, you shift the demand curve to the left. If the change increases how much you would buy at any given price, you shift the curve to the right.
CHANGES IN BUYERS’ INCOME
When your income goes up, you have more to spend. Assuming that prices don’t change, individuals with higher incomes are able to buy more of what they want. Similarly, when your income declines, your purchasing power, or how much you can afford, falls. In either case, your income affects your overall demand.
Impact of a Shift in Demand
FIGURE 3.4
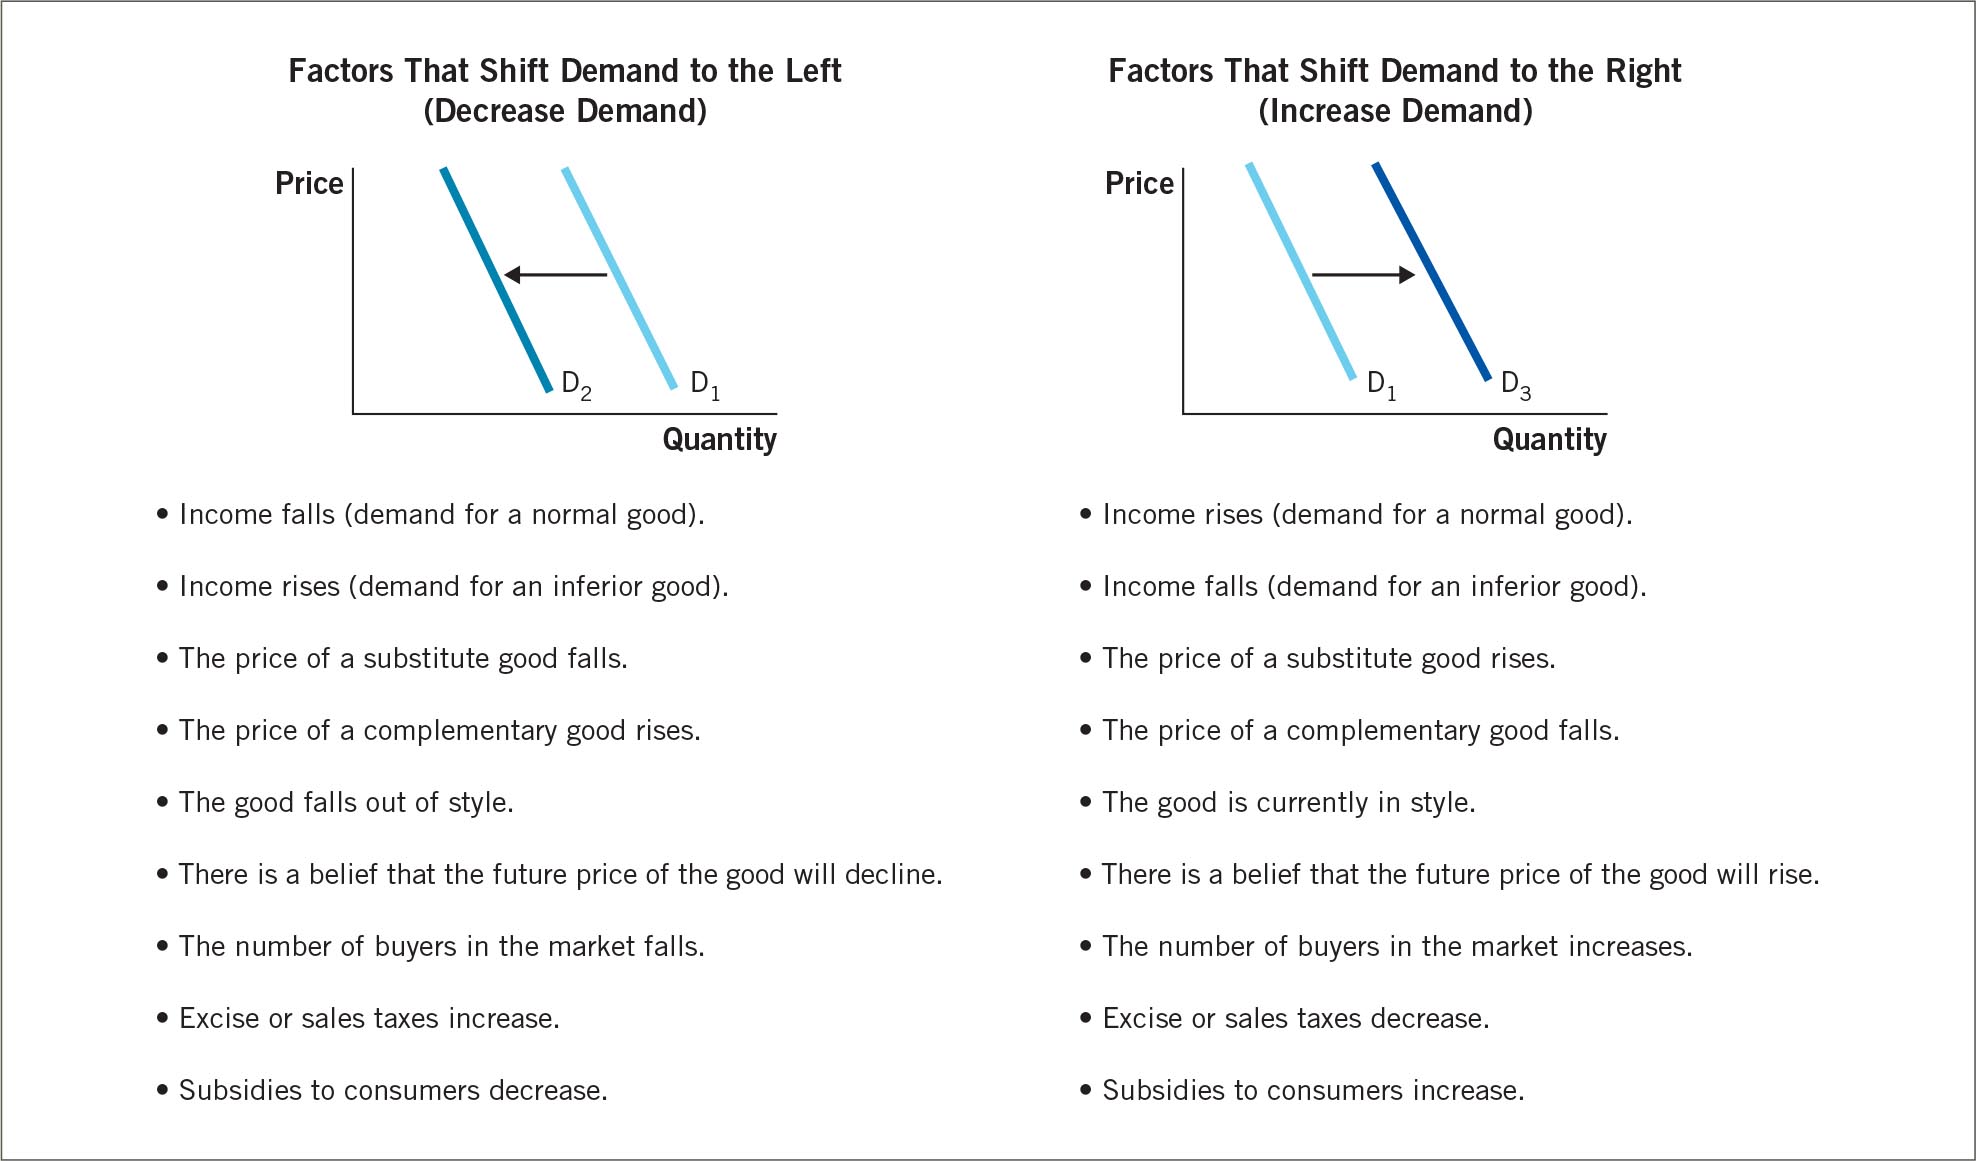
Factors That Shift the Demand Curve
The demand curve shifts to the left when a factor decreases demand. The demand curve shifts to the right when a factor increases demand. (Note: A change in price does not cause a shift. Price changes cause movements along the demand curve.)
More information
A set of two graphs of shifting demand curves with quantity on the x axis and price on the y axis. The first graph is titled Factors that shift demand to the left (Decrease Demand) and shows the demand curve shifting to the left. The second graph is titled Factors that Shift Demand to the Right (Increase Demand) and shows the demand curve shifting to the right. Underneath each demand curve is a bulleted list of characteristics and consequences of each graph. Some factors that shift demand to the left include: income falls, income rises, price of a substitute good falls, or price of a complementary good rises. Some factors that shift demand to the right include: income rises, income falls, the price of a substituted good rises, or the price of a complementary good falls.
When economists look at how consumers spend, they often differentiate between two types of goods: normal and inferior. Consumers will buy more of a normal good as their income goes up (assuming all other factors remain constant). An example of a normal good is a meal at a restaurant. When income goes up, the demand for restaurant meals increases and the demand curve shifts to the right. Similarly, if income falls, the demand for restaurant meals goes down and the demand curve shifts to the left.
While consumers with an increased income may purchase more of some things, the additional purchasing power will mean they purchase fewer inferior goods. An inferior good is one where demand declines as income rises. Examples include rooms in boardinghouses, as opposed to one’s own apartment or house, and hamburgers and ramen noodles, as opposed to filet mignon. As income goes up, consumers buy less of an inferior good because they can afford something better. Within a specific product market, you can often find examples of inferior and normal goods in the form of different brands.
Shifts vs. Movements Along the Demand Curve
THE PRICE OF RELATED GOODS
Another factor that can shift the demand curve is the price of related goods. Certain goods directly influence the demand for other goods. Complements are two goods that are used together. Substitutes are two goods that are used in place of each other.
Consider this pair of complements: smartphones and phone cases. What happens when the price of one of the complements—say, the smartphone—rises? As you would expect, the quantity demanded of the smartphone goes down. The demand for its complement, the phone case, also goes down because people are not likely to use one without the other.
Substitute goods work the opposite way. When the price of a substitute good increases, the quantity demanded declines, and the demand for the alternative good increases. For example, if the price of the PlayStation 4 goes up and the price of Microsoft’s Xbox remains unchanged, the demand for Xbox will increase while the quantity demanded of the PS4 will decline.
CHANGES IN TASTES AND PREFERENCES
Fashion goes in and out of style quickly. Walk into Nordstrom or another clothing retailer, and you will see that fashion changes from season to season and year to year. For instance, what do you think of Crocs? They first became popular in 2006 and are still a common sight today, but they cycle in and out of fashion, so it is safe to assume that in a few years they will once again go out of style. While something is popular, demand increases. As soon as it falls out of favor, you can expect demand for it to decrease. Tastes and preferences can change quickly, and this fluctuation alters the demand for a particular good.
Though changes in fashion trends are usually purely subjective, other changes in preferences are the result of new information about the goods and services we buy. Recall our example of shifting demand for mangoes as the result of either the Listeria infection or new positive medical findings. This is one example of how information can influence consumers’ preferences. Contamination would cause a decrease in demand because people would no longer want to eat mangoes. In contrast, if people learn that eating mangoes lowers cholesterol, their demand for the fruit will go up.
More information
The feet of someone wearing bright pink Crocs and walking a small dog.
Are these Crocs stylish or fit for the dumpster? It depends on consumers’ tastes in fashion at the time.
PRICE EXPECTATIONS
Have you ever waited to purchase a sweater because warm weather was right around the corner and you expected the price to come down? Conversely, have you ever purchased an airline ticket well in advance because you figured that the price would rise as the flight filled up? In both cases, expectations about the future influenced your current demand. If we expect a price to be higher tomorrow, we are likely to buy more today to beat the price increase. The result is an increase in current demand. Likewise, if you expect a price to decline soon, you might delay your purchases to try to get a lower price in the future. An expectation of a lower price in the future will therefore decrease current demand.
ECONOMICSin theMEDIA
Peter Quill’s Orb Auction
In Guardians of the Galaxy, treasure hunter Peter Quill recovers a mysterious orb from ancient ruins on the planet Morag. But when he delivers the orb to The Broker, who hired him, Quill reveals that someone else is after it, too: Ronan, a hulking blue-faced alien famed for his ruthlessness. Frightened, The Broker now wants nothing to do with the orb. Meanwhile, however, others are showing interest. The orb, you see . . .
Well, you should watch the film. Suffice it to say, a lot of people are after that orb. Besides Ronan, there’s The Collector, and there’s Thanos, a world-destroying supervillain, as well as Thanos’s adopted daughters, Gamora and Nebula.
More information
Gamora asks Peter Quill to hand over the orb.
Peter Quill quickly learns that demand for the orb is high.
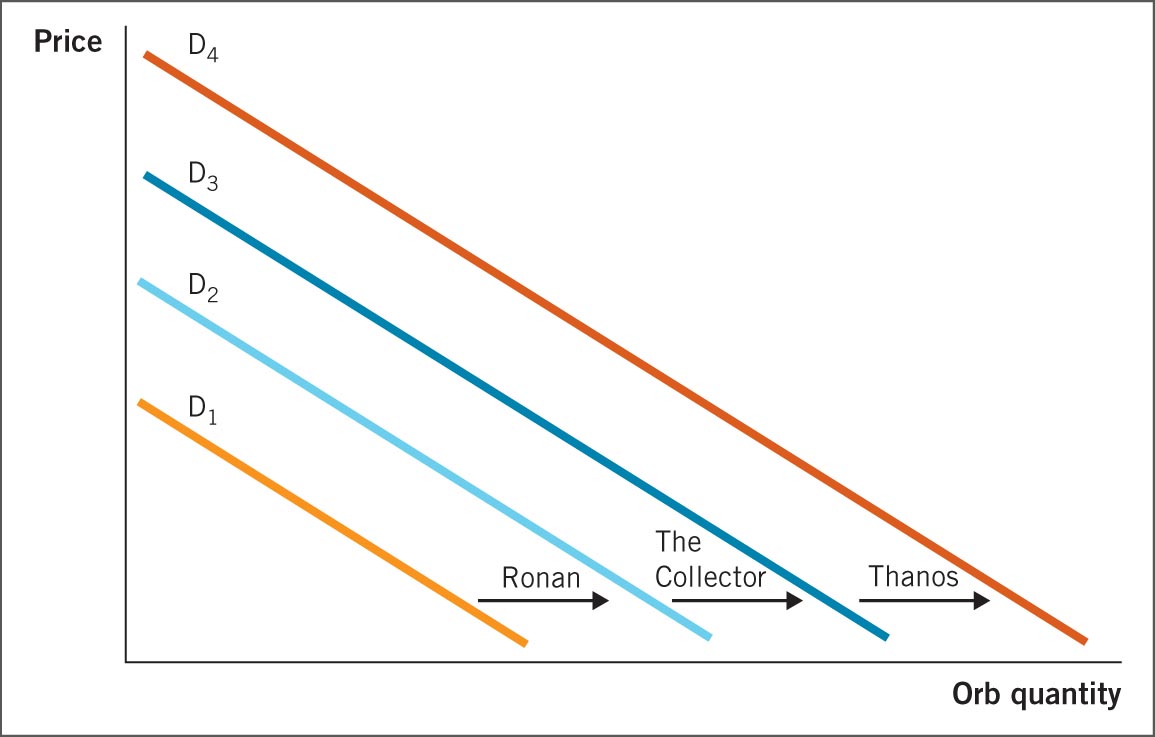
Once Quill learns the secret of the orb, he cooks up a plan to sell it to the highest bidder. Busy dodging blaster shots, Quill isn’t exactly thinking about economics. But if he were, he’d tell you that with more and more buyers trying to acquire the orb, the demand curve is shifting to the right, as shown in the figure. The shift should result in a higher price. Of course, this being an action thriller set in space, Quill’s plan is bound to hit some speed bumps.
More information
The orb demand curve shifts right as more and more characters seek the orb: first Ronan, then The Collector, then Thanos.
Demand Shift in Guardians of the Galaxy
THE NUMBER OF BUYERS
Recall that the market demand curve is the sum of all individual demand curves. Therefore, another way for market demand to increase is for more individual buyers to enter the market. The United States adds 3 million people each year to its population through immigration and births. All those new people have needs and wants, just as the existing population of 325 million does. Collectively, the new people add about 1% to the overall size of many existing markets on an annual basis.
PRACTICE WHAT YOU KNOW
Shift of the Curve or Movement along the Curve?
More information
Three types of pizzas resting on pans. One pizza has all pizza toppings on it, the second has pepperoni, and the third has ham and pineapple.
Cheap pizza or . . .More information
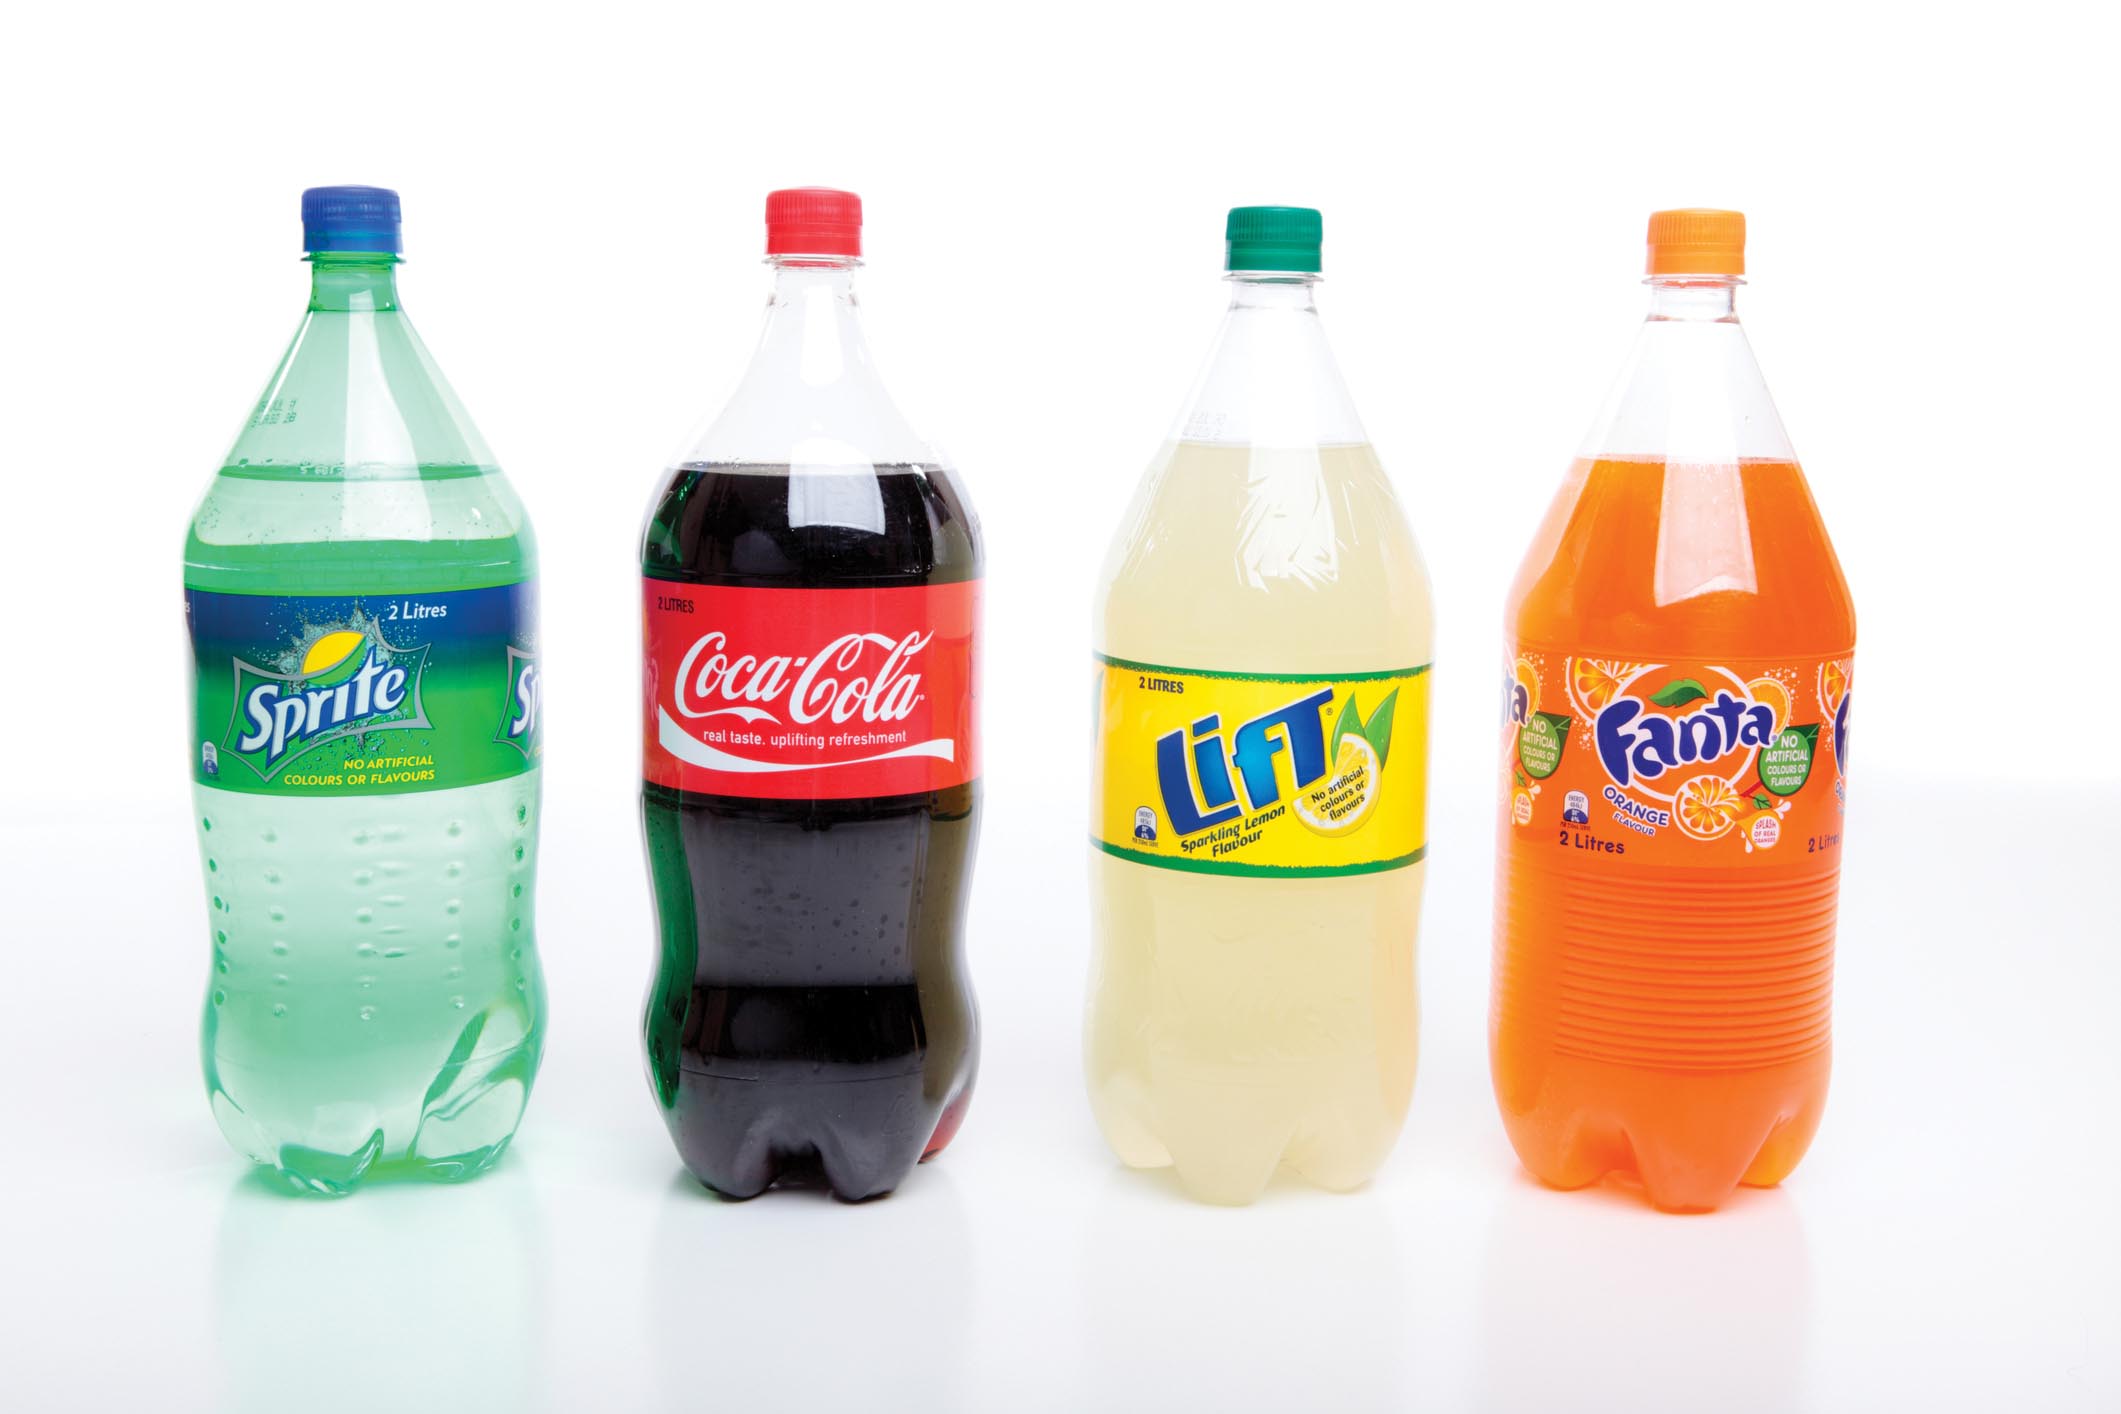
Four different brands of two-liter sodas: Sprite, Coca-Cola, Lift, and Fanta.
. . . cheap drinks?
QUESTION: Suppose that a local pizza place likes to run a late-night special. The owners have contacted you for some advice. One of the owners tells you, “We want to increase the demand for our pizza.” He proposes two marketing ideas to accomplish this goal:
Reduce the price of large pizzas.
Reduce the price of a complementary good—for example, offer two half-priced bottles or cans of soda with every large pizza ordered.
Which strategy will you recommend?
ANSWERANSWER:
Incentives
First, consider why late-night specials exist in the first place. Because most people prefer to eat dinner early in the evening, the pizzeria has to encourage late-night patrons to buy pizzas by stimulating demand. “Specials” are used during periods of low demand, when regular prices would leave the establishment largely empty.
Next, look at what the question asks. The owners want to know which option would “increase demand” more. The question is very specific; the owners are looking for something that will increase (or shift) demand.
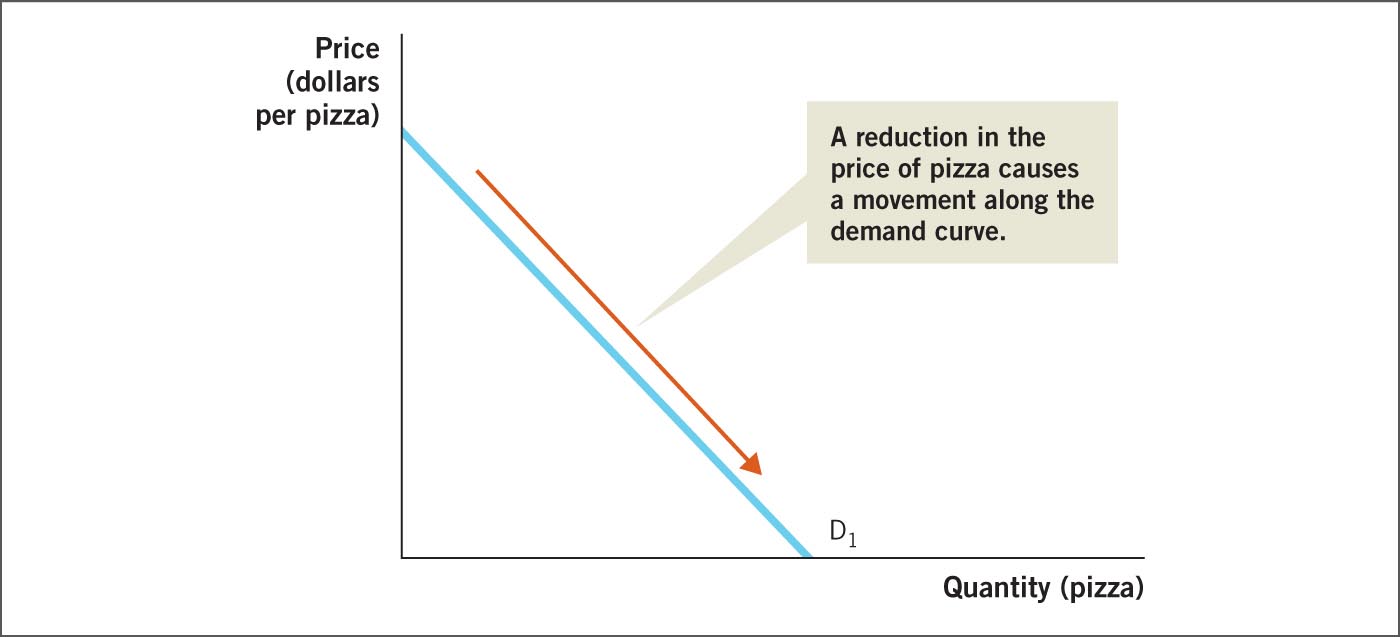
Consider the first option, a reduction in the price of pizzas. Let’s look at this option graphically (see next graph). A reduction in the price of a large pizza causes a movement along the demand curve, or a change in the quantity demanded.
More information
A supply and demand graph for pizza; price (in dollars per pizza) is on the Y-axis and Quantity of pizza is on the X-axis. A single downward linearly sloping line goes from a certain point on the Y-axis down to a point on the x-axis. An arrow points down along the line representing a reduction in the price of pizza causing movement along the demand curve.
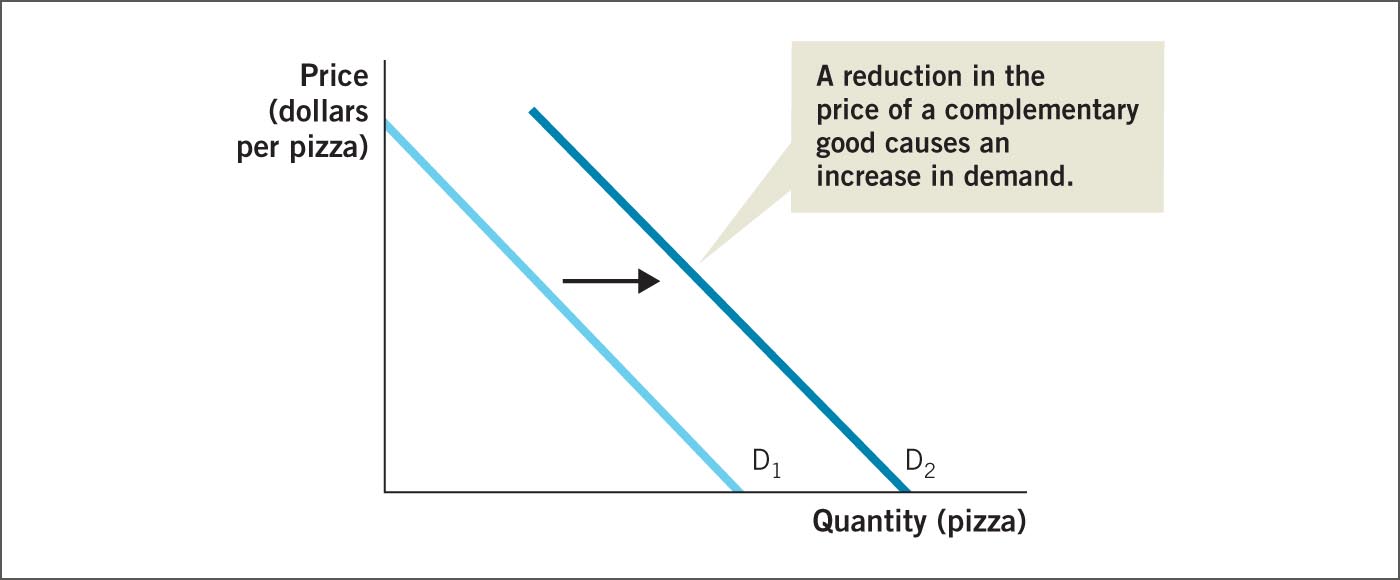
Now consider the second option, a reduction in the price of a complementary good. Let’s look at this option graphically (next graph). A reduction in the price of a complementary good (for example, soda) causes the entire demand curve to shift. This is the correct answer, because the question asks which marketing idea would increase (or shift) demand more.
Incentives
Recall that a reduction in the price of a complementary good shifts the demand curve to the right. The other answer, cutting the price of pizzas, causes a movement along the existing demand curve, which does not increase demand.
If you move along a curve instead of shifting it, you will analyze the problem incorrectly.
More information
A demand supply graph for pizza; price (dollars per pizza) is on the Y-axis and Quantity of pizza is on the X-axis. Two linear demand curves have the same negative slope: initial demand curve, D1, shifts to the right to demand curve, D2. A textbox reads, A reduction in the price of a complementary good causes an increase in demand.
The number of buyers also varies by age. Consider two markets—one for baby products (such as diapers, high chairs, and strollers) and the other for health care (including medicine, cancer treatments, hip replacement surgery, and nursing facilities). In countries with aging populations—for example, in Japan, where the birthrate has plummeted over several generations—the demand for baby products will decline and the demand for health care will expand. In other words, demographic changes in society are another source of shifts in demand. In many markets, ranging from movie theater attendance to home ownership, population trends play an important role in determining whether the market is expanding or contracting.
Incentives
TAXES AND SUBSIDIES
Changes in excise taxes (which are taxes on a single product or service) and sales taxes (which are general taxes on most goods and services) affect demand as well. Higher taxes lower demand because consumers must now pay the higher tax in addition to the price they pay for the good. Lower taxes reduce the overall cost to consumers and therefore increase demand.
The reverse is true for a subsidy, which is a payment made by the government to encourage the consumption or production of a good or service. A lot of times it’s a tax break, like the mortgage interest tax deduction, or tax credits on eco-friendly cars. In both cases, the tax break encourages consumers to purchase more of the subsidized good.
Complements are two goods that are used together. When the price of a complementary good rises, the quantity demanded of that good falls and the demand for the related good goes down.
Substitutes are two goods that are used in place of each other. When the price of a substitute good rises, the quantity demanded of that good falls and the demand for the related good goes up.

 ANSWERS
 ANSWERS:

 Impact of a Shift in Demand