What Effects Do Price Floors Have on Economic Activity?
We have seen the logical repercussions of a hypothetical price floor on milk and the incentives it creates. Now let’s use supply and demand analysis to examine two real-world price floors: minimum wage laws and sugar subsidies.
The Minimum Wage
The minimum wage is the lowest hourly wage rate that firms may legally pay their workers. Minimum wage workers can be skilled or unskilled and experienced or inexperienced. The common thread is that these workers, for a variety of reasons, lack better prospects.
A minimum wage functions as a price floor. Figure 6.9 shows the effect of a binding minimum wage. Note that the wage, or the cost of labor, on the y axis ($10 per hour) is the price that must be paid. However, the market equilibrium wage ($7), or WE, is below the minimum wage. The minimum wage prevents the market from reaching WE at E (the equilibrium point) because only the wages in the green area are legal. The minimum wage raises the cost of hiring workers. Therefore, a higher minimum wage will lower the quantity of labor demanded. At the same time, firms will look for ways to substitute capital for workers. As a result, a binding minimum wage results in unemployment in the short run because QSSR > QDSR.
FIGURE 6.9
Price Floors and a Binding Minimum Wage Market in the Short Run and Long Run
A binding minimum wage is a price floor above the current equilibrium wage, WE. At $10 per hour, the number of workers willing to supply their labor (SSR) is greater than the demand for workers (DSR). The result is a surplus of workers (which we recognize as unemployment). Because the supply of workers and demand for workers both become more elastic in the long run, unemployment expands (QSLR > QDLR).
More information
Minimum wage in the short run and the long run. On the y axis is wage per hour, and on the x axis is quantity in workers. In the short run, the supply curve, upper S subscript S R, is linear with a positive slope, and the demand curve, upper D subscript S R, is linear with a negative slope. In the long run, the supply curve, upper S subscript L R, is linear with a positive slope that is less than in the short run, and the demand curve, upper D subscript L R, is linear with a negative slope that is less than in the short run. The four curves intersect at the equilibrium point, E, where the equilibrium wage, upper W subscript E, is 7 dollars, and the equilibrium quantity is upper Q subscript E. A price floor, upper W subscript minimum, is set at 10 dollars. Because the quantity of workers demanded in the short run, upper Q subscript D subscript S R, at 10 dollars is less than the amount of workers supplied in the short run, upper Q subscript S subscript S R, there is unemployment in the short run. Because the quantity of workers demanded in the long run, upper Q subscript D subscript L R, at 10 dollars is less than the amount of workers supplied in the long run, upper Q subscript S subscript L R, there is unemployment in the long run. Due to the increased elasticity of the demand and supply curve in the long run, there is more unemployment in the long run than in the short run.
Incentives
Businesses generally want to keep costs down, so in the long run they will try to reduce the amount they spend on labor. They might replace workers with machinery, shorten work hours, offer reduced customer service, or even relocate to countries that do not have minimum wage laws. As we move past the short run, more people will attempt to take advantage of higher minimum wages. Like firms, workers will adjust to the higher minimum wage over time. Some workers who might have decided to go to school full-time or remain retired or who simply want some extra income will enter the labor market because the minimum wage is now higher. As a result, minimum wage jobs will become progressively harder to find and unemployment will increase. The irony is that in the long run, the minimum wage, just like any other price floor, has created two unintended consequences: a smaller demand for workers by employers (QDLR is significantly less than QE) and a larger supply of workers (QSLR) looking for jobs.
Proponents of minimum wage legislation are aware that it often creates unemployment. To address this problem, they support investment in training, education, and the creation of government jobs programs to provide more work opportunities. While jobs programs increase the number of minimum wage jobs, training and additional education enable workers to acquire skills needed for jobs that pay more than the minimum wage. Economists generally believe that education and training programs have longer-lasting benefits to society as a whole because they enable workers to obtain better-paying jobs on a permanent basis.
The Minimum Wage Is Sometimes Nonbinding
Most people believe that raising the minimum wage is a simple step that the government can take to improve the standard of living of the working poor. However, in some places the minimum wage is nonbinding and therefore has no impact on the market. Why would we have a minimum wage if it is largely nonbinding?
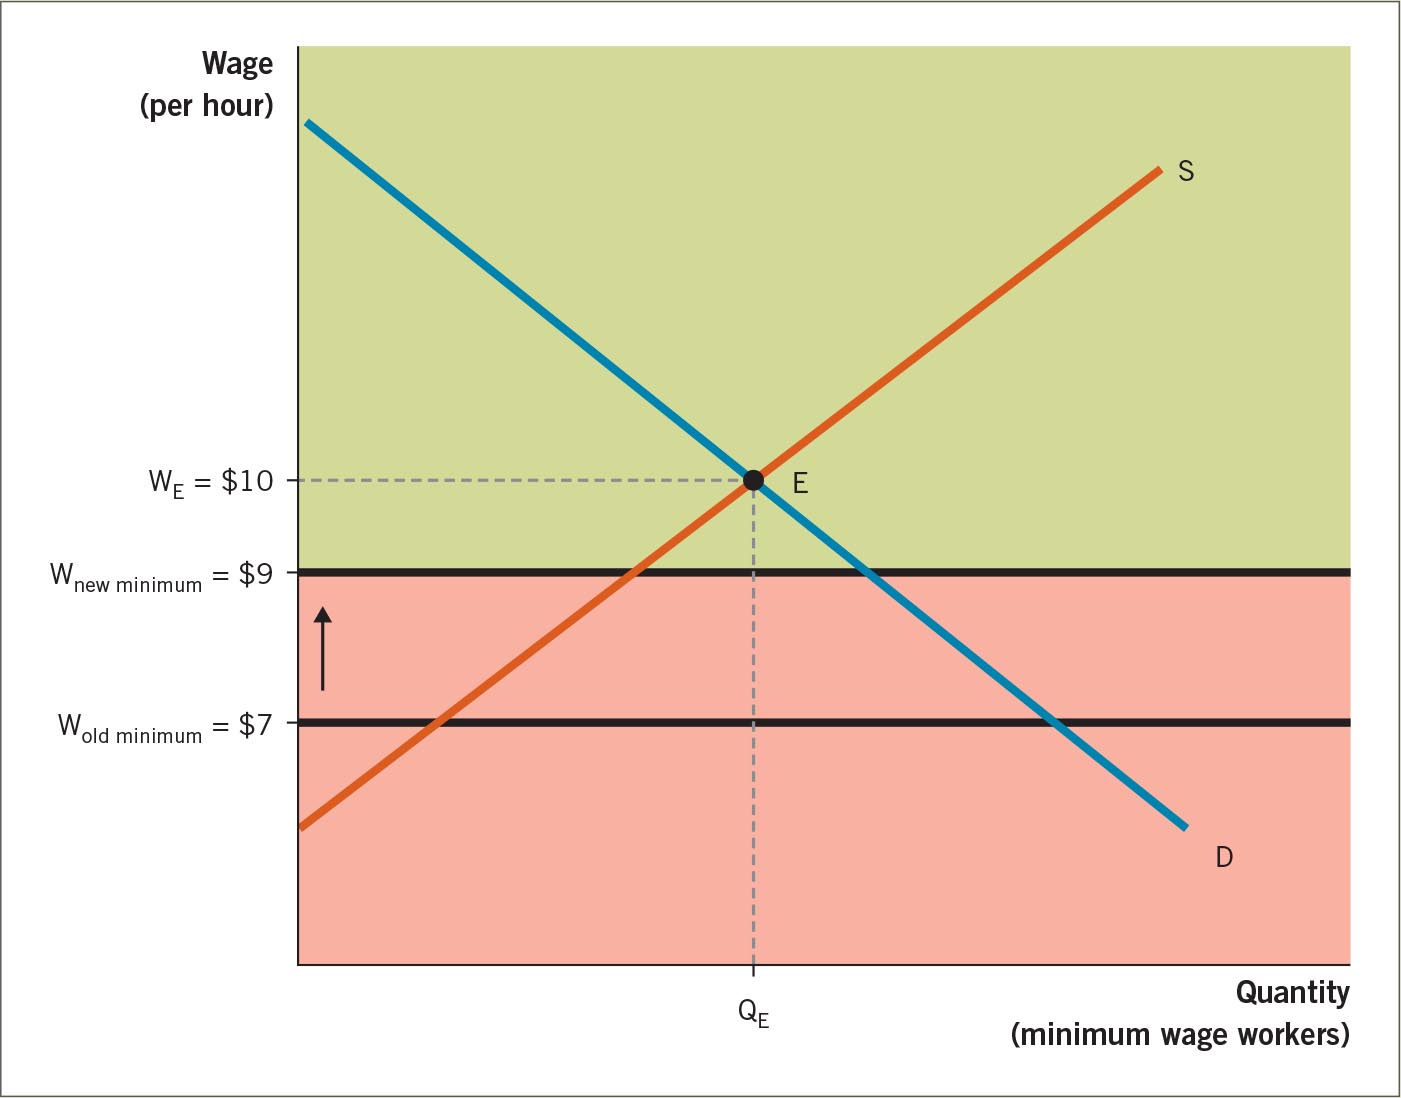
To help us answer this question, consider the two nonbinding minimum wage rates ($7 and $9) shown in Figure 6.10. A minimum wage of $7 per hour is far below the equilibrium wage of $10 (WE), so at that point supply and demand push the equilibrium wage up to $10. Suppose that politicians decide to raise the minimum wage to $9. This new minimum wage of $9 would remain below the market wage, so there would be no impact on the labor market for workers who are willing to accept the minimum wage. Therefore, an increase in the minimum wage from $7 to $9 an hour will not create unemployment. Unemployment will occur only when the minimum wage rises above $10.
FIGURE 6.10
A Nonbinding Minimum Wage
An increase in the minimum wage from $7 to $9 remains nonbinding. Therefore, it will not change the demand for labor or the unemployment rate. If the minimum wage rises above the market wage, unemployment will occur.
More information
Labor supply and demand with a nonbinding wage floor. On the y axis is wage per hour, and on the x axis is quantity of minimum wage workers. The supply curve, S, is linear with a positive slope, and the demand curve, D, is linear with a negative slope. The supply and demand curves intersect at the equilibrium point, E, where the equilibrium wage, upper W subscript E, is 10 dollars, and the equilibrium quantity is upper Q subscript E. An old minimum wage, upper W subscript old minimum, is set at 7 dollars. An upward pointing arrow indicates that the minimum wage shifts upward to upper W subscript new minimum, which is set at 9 dollars. Because upper W subscript new minimum of 9 dollars is lower than the equilibrium wage, the minimum wage remains nonbinding.
In recent years, many locations have seen a push to raise the minimum wage to $15 an hour. However, the supply of low-skill labor shrank dramatically in 2020 and 2021, due to generous unemployment and childcare benefits during the COVID-19 pandemic, coupled with employees who were reluctant to go back to work as the pandemic became endemic. As a result, entry-level wages for low-skill workers are now above $15 in several metropolitan areas. In these places, a $15 minimum wage will be nonbinding. San Francisco, for example, adopted a $15 minimum wage in 2018, but as of 2021, the average starting wage for low-skill jobs in that city is $17.80.
DATA SNAPSHOT
Minimum Wage: Always the Same?
A minimum wage is a price floor, a price control that doesn’t allow prices—in this case the cost of labor—to fall below an assigned value. Although the media and politicians often discuss the minimum wage in the United States as if there is only one minimum wage, there are numerous minimum wages in the USA. In states where the state minimum wage is not the same as the federal minimum wage, the higher of the two wage rates takes effect.
DYNAMIC DATA FIGURE
REVIEW QUESTIONS
Suppose you live in Oklahoma and are looking for a job. The state minimum wage rate is $7.25/hour, the federal minimum wage rate is $7.25/hour, and the market equilibrium wage for the job is $8.00/hour. What wage will you be paid? Are the state and national minimum wages binding or non-binding price floors?
Suppose Wisconsin increases its minimum wage from $7.25/hour, which is below the market wage for low-skill labor, to $11.00/hour, which is above the market wage. Using supply and demand curves, show how this might increase the number of unemployed workers.
That’s not to say that efforts to raise the minimum wage in other places will have the same impact as in San Francisco. In many parts of the United States, the minimum wage is binding. Note, also, that when a minimum wage is binding and causes some unemployment, this does not automatically mean that low-wage workers are harmed overall. If enough low-wage workers stay employed when the minimum wage is increased, the total payroll that workers receive can still increase, even though some workers will have lost their jobs.
Price Floors
ECONOMICS IN THE REAL WORLD
WHY IS SUGAR SO EXPENSIVE IN THE UNITED STATES?
Sugar is one of life’s small pleasures. It can be extracted and refined from sugarcane and sugar beets, two crops that can be grown in a variety of climates around the world. Sugar is both plentiful and cheap. As a result, Americans enjoy a lot of it—an average of over 100 pounds of refined sugar per person each year!
Incentives
We would consume a lot more sugar if it were not subject to price controls. After the War of 1812, struggling sugarcane producers asked the government to pass a tariff (tax) that would protect domestic production. Over the years, price supports of all kinds have served to keep domestic sugar production high. The result is an industry that depends on a high price to survive. Under the current price-support system, the price of U.S.-produced sugar is roughly two times the world price. This situation has led to a bizarre set of incentives whereby U.S. farmers grow more sugar than they should and use land that is not well suited to the crop. For instance, sugarcane requires a subtropical climate, but most of the U.S. crop is grown in Louisiana, a region that is prone to hurricanes in the summer. As a result, many sugarcane crops there are completely lost. Have farmers turned to other, more locally suited crops? Not so much! What’s happened is that frost-resistant strains have been developed that will grow farther inland, at colder locations.
Why do farmers persist in growing sugarcane in Louisiana? The answer lies in the political process: sugar growers have effectively lobbied to keep prices high through tariffs on foreign imports. Because lower prices would put many U.S. growers out of business and cause the loss of many jobs, politicians have given in to their demands.
More information
A bottle of Coca-Cola Classic from the United States.
Which of these is the real thing? The Coke on the right, with high-fructose corn syrup, was made in the United States; the other, with sugar, was made in Mexico.
Meanwhile, the typical sugar consumer is largely oblivious to the political process that sets the price floor. It has been estimated that the sugar subsidy program costs consumers over $1 billion a year. To make matters worse, thanks to corn subsidies, high-fructose corn syrup has become a cheap alternative to sugar and is often added to processed foods and soft drinks. In 1980, Coca-Cola replaced sugar with high-fructose corn syrup in its U.S. factories to reduce production costs. However, Coca-Cola continues to use sugarcane in many Latin American countries because it is cheaper there. Research shows that high-fructose corn syrup causes a metabolic reaction that makes people who ingest it more inclined to obesity. This is an example of an unintended consequence that few policymakers could have imagined.
PRACTICE WHAT YOU KNOW
How Would Price Controls Affect Internet Access?
More information
A group of smiling, young people join hands to create a web-like network.
In today’s Internet age, four degrees of separation are all that stand between you and the rest of the world.
Price of Internet
Connections demanded (millions of units)
Connections supplied (millions of units)
$60
10.0
62.5
50
20.0
55.0
40
30.0
47.5
30
40.0
40.0
20
50.0
32.5
10
60.0
25.0
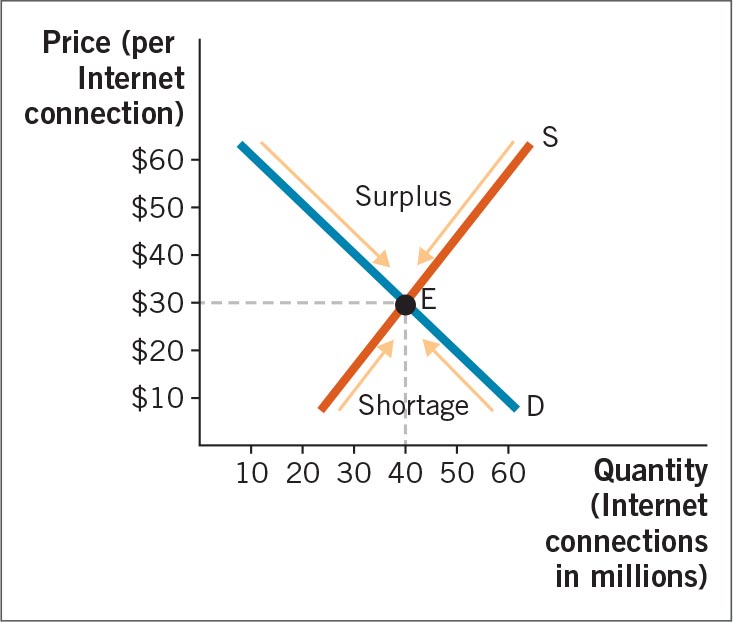
QUESTION: What are the equilibrium price and equilibrium quantity of Internet service?
ANSWERANSWER:First, look at the table to see where quantity supplied and quantity demanded are equal. At a price of $30, consumers purchase 40 million units and producers supply 40 million units. Therefore, the equilibrium price is $30 and the equilibrium quantity is 40 million. At any price above $30, the quantity supplied exceeds the quantity demanded, so there is a surplus. The surplus gives sellers an incentive to cut the price until it reaches the equilibrium point, E. At any price below $30, the quantity demanded exceeds the quantity supplied, so there is a shortage. The shortage gives sellers an incentive to raise the price until it reaches the equilibrium point, E.More information
A graph of equilibrium in the market for Internet connections. The equilibrium price is 30 dollars, and the equilibrium quantity is 40 million connections. At higher prices, a surplus would cause producers to cut the price. At lower prices, a shortage would cause producers to raise the price.
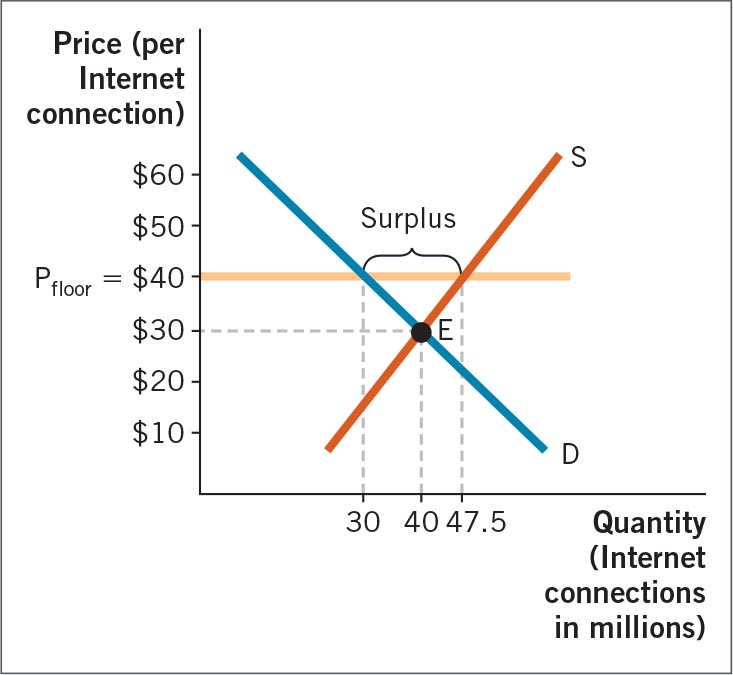
QUESTION: Suppose that providers convince the government that maintaining high-speed access to the Internet is an important element of technology infrastructure. As a result, Congress approves a price floor at $10 above the equilibrium price to help companies provide Internet service. How many people are able to connect to the Internet?
ANSWERANSWER:Adding $10 to the market price of $30 gives us a price floor of $40. At $40, consumers demand 30 million connections. Producers provide 47.5 million connections. The result is a surplus of 17.5 million units (shown in the graph). A price floor means that producers cannot cut the price below that point to increase the quantity that consumers demand. As a result, only 30 million units are sold. So only 30 million people connect to the Internet.More information
A graph of a price floor in the market for Internet connections. A price floor of 40 dollars is binding when the equilibrium price is 30 dollars. There is a surplus, because 47.5 million connections are supplied but only 30 million are demanded.
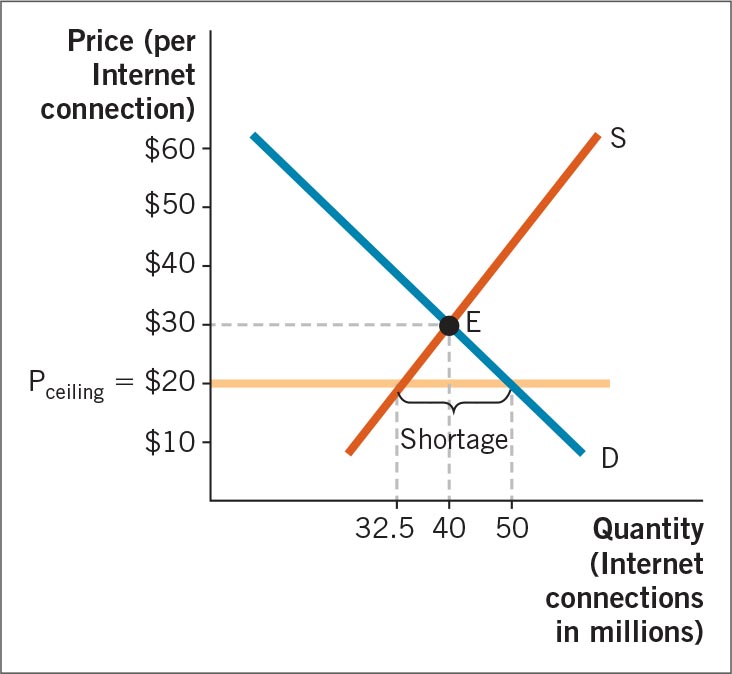
QUESTION: When consumers realize that fewer people are purchasing Internet access, they demand that the price floor be repealed and a price ceiling be put in its place. Congress acts immediately to remedy the problem, and a new price ceiling is set at $10 below the market price. Now how many people are able to connect to the Internet?
ANSWERANSWER:Subtracting $10 from the market price of $30 gives us a price ceiling of $20. At $20 per connection, consumers demand 50 million connections. However, producers provide only 32.5 million connections. The result is a shortage of 17.5 million units (shown in the graph). A price ceiling means that producers cannot raise the price, which will cause an increase in the quantity supplied. As a result, only 32.5 million units are sold, so only 32.5 million people connect to the Internet.More information
A graph of a price ceiling in the market for Internet connections. A price ceiling of 20 dollars is binding when the equilibrium price is 30 dollars. There is a shortage, because 50 million connections are demanded but only 32.5 million are supplied.
QUESTION: Which provides the greatest access to the Internet: free markets, price floors, or price ceilings?
ANSWERANSWER:With no government intervention, 40 million connections are sold. Once the price floor is established, 30 million people have an Internet connection. Under the price ceiling, 32.5 million people have an Internet connection. Despite legislative efforts to satisfy both producers and consumers of Internet service, the best solution is to allow free markets to allocate the good.


 ANSWER
 ANSWER: