LEARNING GOAL
Summarize the historical and contemporary methods used to study the functions of different brain regions.
LEARNING GOAL
Summarize the historical and contemporary methods used to study the functions of different brain regions.
An adult human brain—your brain—weighs about 3 pounds (1.4 kilograms). It may not be huge, but it is incredibly complex. Think of the brain as a collection of neurons that interact with one another in massive circuits. These neural circuits have developed throughout human evolution to help us survive in the environments where humans have lived. In adapting to those environments, the human brain has evolved. As a result, specialized mechanisms in the brain regulate our breathing, food intake, sexual behavior, and body fluids. Likewise, because our ancestors had to protect themselves from danger, sensory systems have evolved in the brain to aid our navigation and help us recognize friends and foes.
Early Studies of the Brain How do we know so much about the brain? By the beginning of the nineteenth century, early psychologists understood that the brain was the basis of mental activity. In addition, anatomists understood the brain’s basic structure reasonably well. But debates raged over how the parts of the brain produced specific mental processes, such as memory and problem solving. Did different parts of the brain do different things? Or were all the parts equally important in all mental activities?
In the early nineteenth century, the neuroscientist Franz Gall and his assistant, the physician Johann Spurzheim, proposed their theory of phrenology. Gall and Spurzheim based their theory on the idea that different areas of the brain perform different functions (Figure 2.11a). Phrenology was the attempt to assess personality traits and mental abilities by measuring bumps on the human skull, and it was popular until the 1930s. At that time, a company made psychographs, which were devices intended to analyze personality based on the locations and sizes of skull bumps (Figure 2.11b). The general public could even try these psychographs at fairs and amusement parks. People paid attention to phrenology because it was based on the seemingly scientific principle that brain functions have specific locations in the brain, but at the time, the technology was not available to test the theory scientifically. Eventually, scientists found that bumps on the skull are not related to personality. But the idea that certain areas of the brain are related to certain thoughts, behaviors, and functions was an important insight.
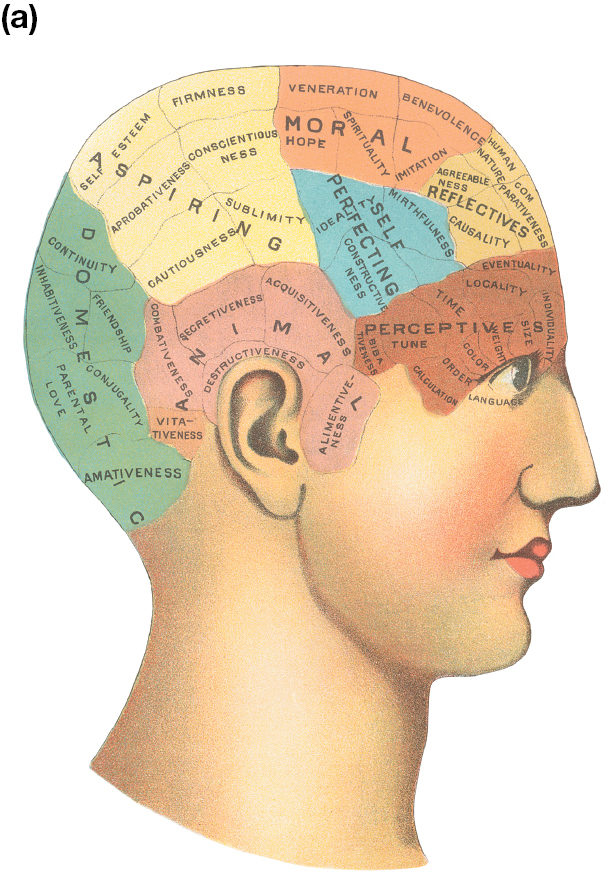
It shows how each region of the brain corresponds with an aspect of the personality. The main categories are domestic, animal, aspiring, moral, self-perfecting, reflective, and perceptive.
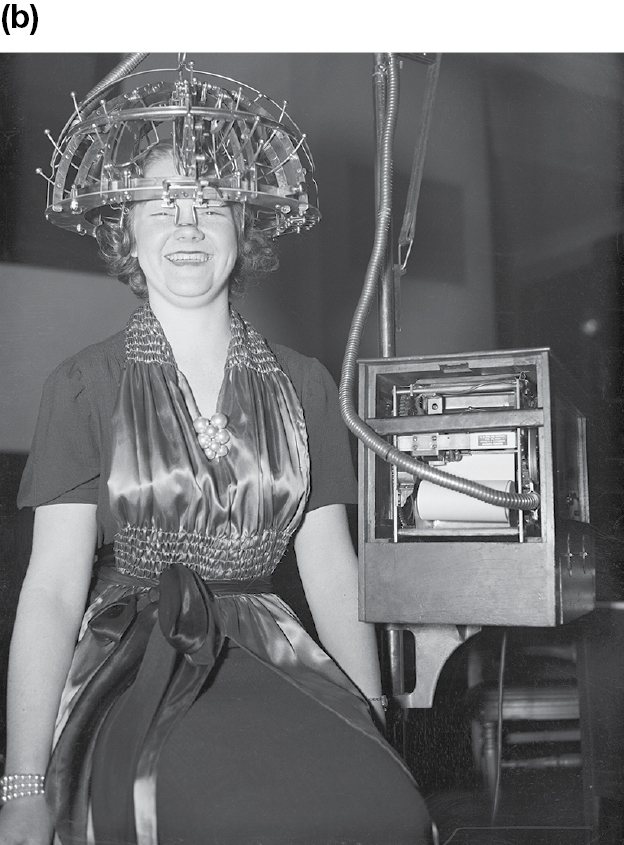
A large dome on top of her head is connected to some sort of computer device. She looks very pleased with what is happening.
FIGURE 2.11 Phrenology and the Psychograph
(a) In phrenological maps, which have long been debunked, each region of the skull is associated with a different personality feature to reflect processes that were believed to occur in the brain under the skull.(b) Psychographs were sold to the public and were claimed to “do the work of a psychoanalyst” by revealing “your talents, abilities, strong and weak traits, without prejudice or flattery.”
The first strong evidence that brain regions perform specialized functions came from the work of the physician and anatomist Paul Broca (Finger, 1994). In 1861, Broca performed an autopsy on a patient who had been able to understand language but had lost the ability to say anything other than one word. When Broca examined the patient’s brain, he found a large section of damaged tissue in the front left side (Figure 2.12a). Broca concluded that this particular region in the left hemisphere of the brain was important for speech. Broca’s idea has survived the test of time. This left frontal region, now confirmed to be crucial for producing speech, is known as Broca’s area (Figure 2.12b).
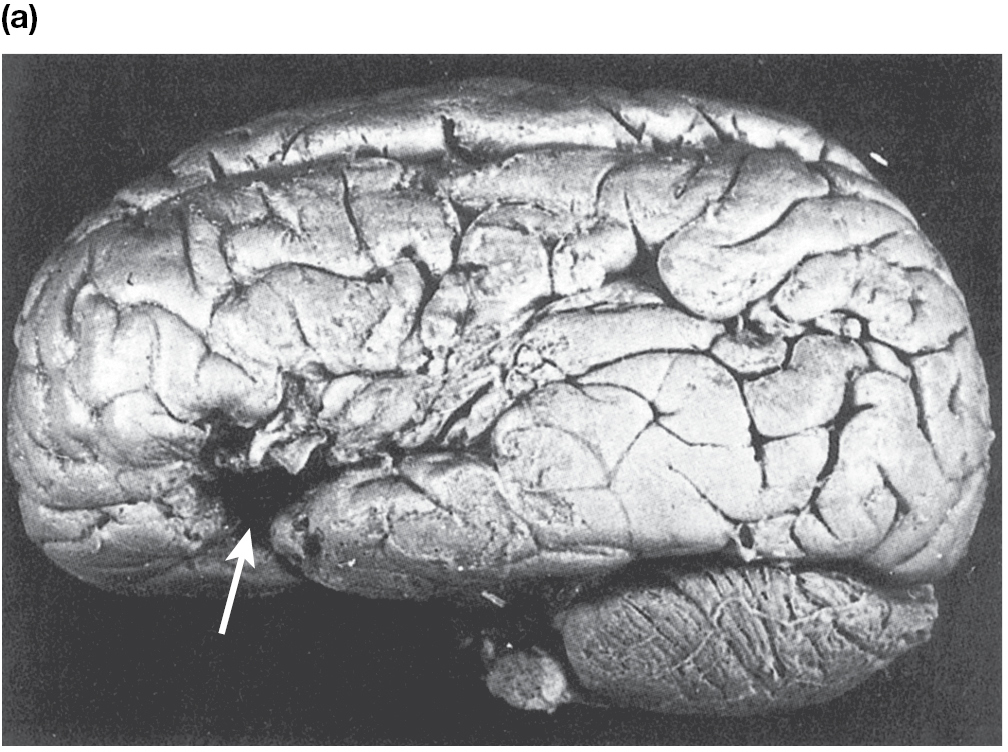
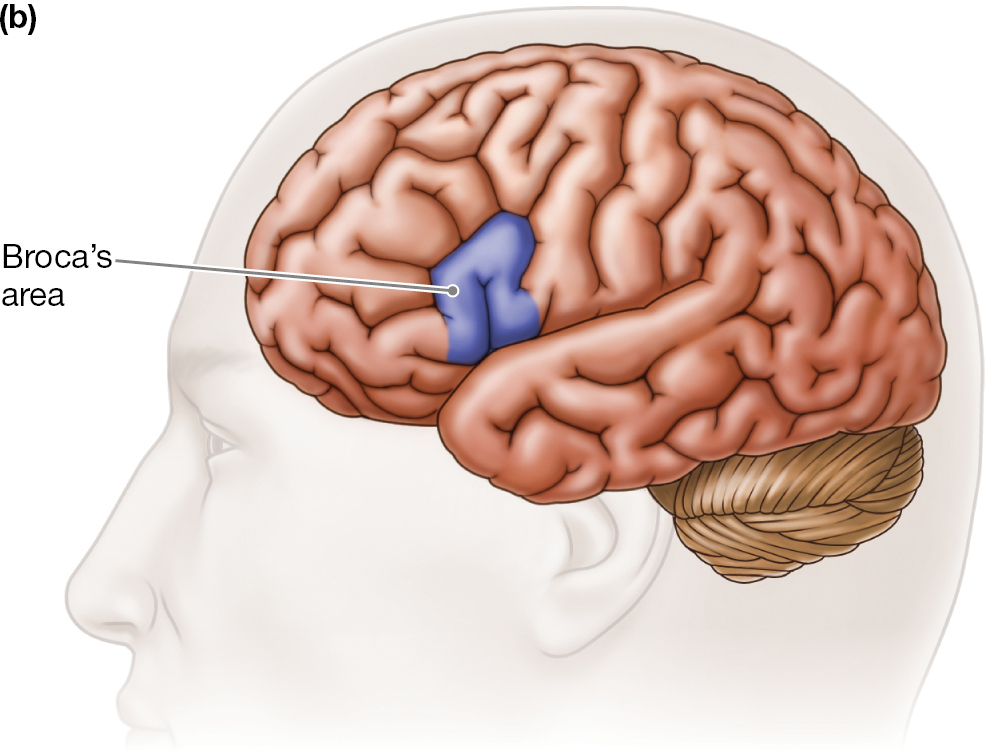
FIGURE 2.12 Broca’s Area
(a) Paul Broca studied a patient’s brain and identified the damaged area in the left frontal lobe as crucial for producing speech. (b) This illustration shows the location of this region, called Broca’s area.
Modern Brain Research For most of human history, theorists and researchers did not have methods for studying mental activity as it occurred in the working brain. Over the last century, scientists have developed various methods to study the brain in action.
The first method developed was a way to record the electrical activity of neurons firing in the brain. Using this method, a researcher fits electrodes onto the participant’s scalp. The electrodes act like small microphones, but they pick up the brain’s electrical activity instead of sounds. The device that records this activity is called an electroencephalograph (EEG; Figure 2.13a). This measurement is useful because different behavioral states produce different and predictable EEG patterns. For example, an EEG can reveal when someone is falling asleep. EEG patterns also show that the brain is very active even when the body is at rest or asleep, especially during dreams.
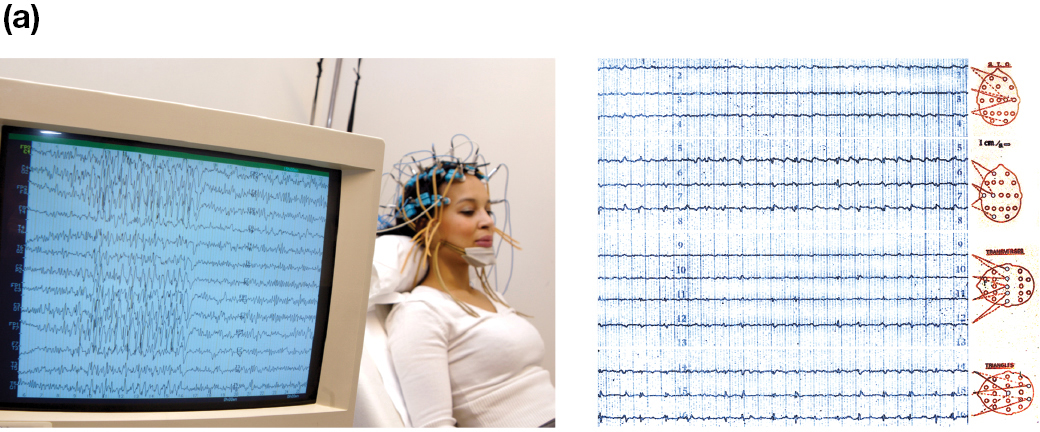
The woman has many electrodes attached all over her head. There is an example of the brain wave read out to the right of the picture.
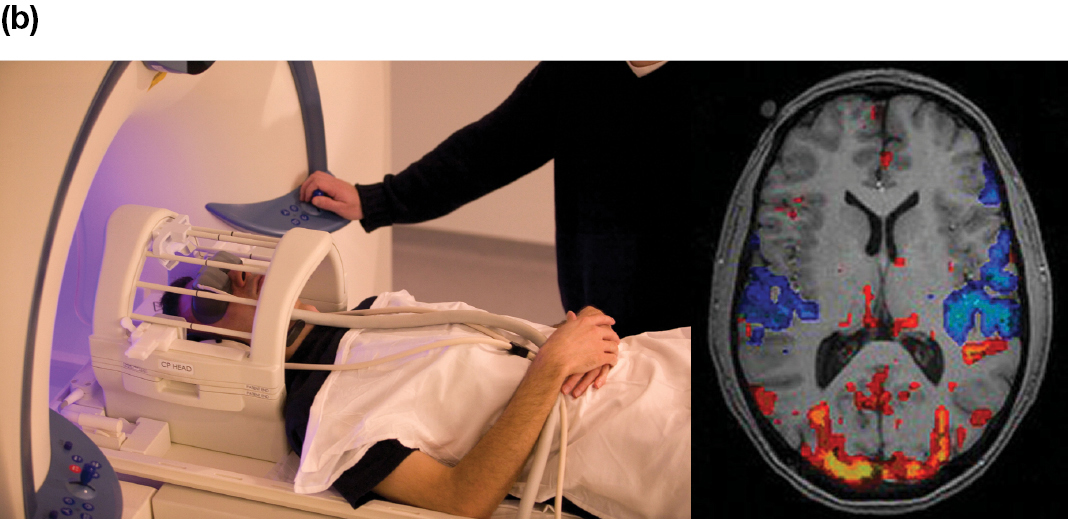
To the right of the image, there is an example of the results from a f M R I. It highlights areas of the brain which are showing the most activity.
To the right of the picture, it shows a close-up version of what the machine provides. There is an area highlighted in the brain near the front left side.
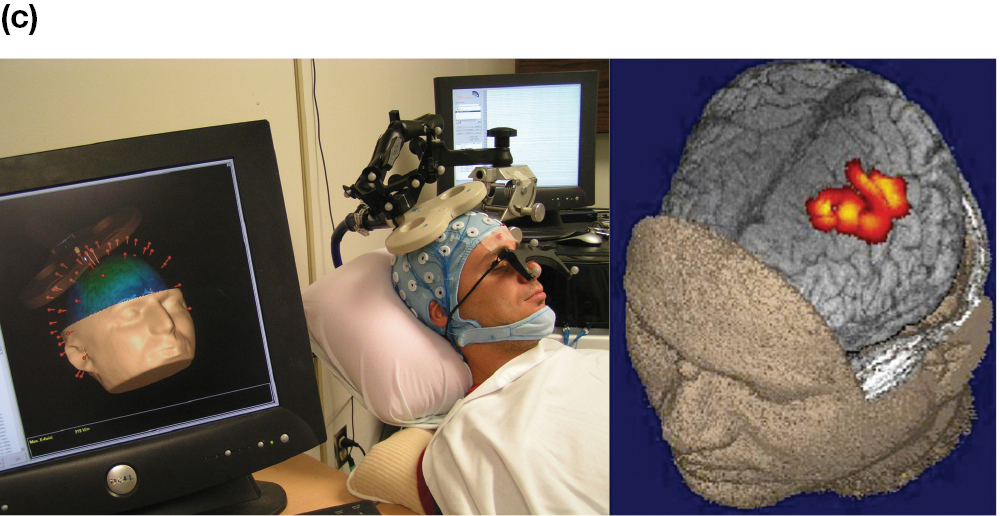
FIGURE 2.13 Measures of Brain Activity
Several methods of measuring how the brain responds to tasks or events provide insight into how mental activity and behavior depend on our biological processes. (a) An electroencephalograph (EEG) measures the brain’s electrical activity. (b) Functional magnetic resonance imaging (fMRI) maps mental activity during a mental task by measuring the blood’s oxygen level in the brain. (c) Transcranial magnetic stimulation (TMS) momentarily disrupts brain activity in a specific brain region.
The brain’s electrical activity is associated with changes in the flow of blood carrying oxygen and nutrients to the active brain regions. These changes can be measured with several different brain imaging methods.
The main brain imaging method used today in psychological research is functional magnetic resonance imaging, or fMRI for short (Figure 2.13b). This technique measures changes in the blood’s oxygen level. These changes let researchers indirectly assess the brain’s blood flow. Using this method, they are able to map the working brain. For example, the research participant performs a mental task (thinks about something), such as deciding whether a person is in a picture. During the task, the researchers scan the participant’s brain. Next, the participant does a task that differs from the first in only one way, such as deciding whether a house is in a picture. The researchers then compare brain images to examine differences in activity between the two tasks.
One of the most important findings from brain imaging research is that many different brain regions work together to produce psychological activity. Networks of brain regions are involved in everything you do, everything you think, and everything you feel (Herbet & Duffau, 2020). Researchers have spent the past decade mapping out how brain regions are connected and how they work together. To achieve this mapping, the Human Connectome Project was launched in 2010 as a major international research effort (Van Essen et al., 2013). It has produced numerous important findings about how the brain works to produce psychological activity (A. C. Janes et al., 2020). This greater knowledge of brain connectivity may be especially useful for understanding how brain circuitry differs in people with psychological disorders (Tozzi et al., 2020).
Brain imaging does not show that activity in a brain region causes the mental activity or behavior. Rather, brain imaging is a correlational method. Recall from Chapter 1 that correlation does not equal causation. However, researchers can use experimental methods to determine whether a brain region is important for a task. To do so, they compare performances when that area is working effectively and when it is not. The method used for this purpose is transcranial magnetic stimulation, or TMS for short (Figure 2.13c). This technique uses a very fast and powerful magnetic field to momentarily disrupt activity in a specific brain region. For example, placing the TMS coil over areas of the brain involved in language will disrupt a person’s ability to speak. This technique has its limitations. In particular, it can be used only to examine brain areas close to the scalp. When used along with imaging, however, it is a powerful method for examining which brain regions are necessary for specific psychological functions.
Modern research using these methods has greatly advanced our understanding of the brain. For researchers who want to understand the inner workings of the brain, these methods are equivalent to the telescope for astronomers.
In the following study units, you will learn about the two parts of the CNS: the spinal cord and the brain. You will also learn how brain research reveals the three main divisions of the brain: the hindbrain, the midbrain, and the forebrain. Each of these divisions is associated with particular mental processes and particular behaviors, as summarized in Figure 2.14.
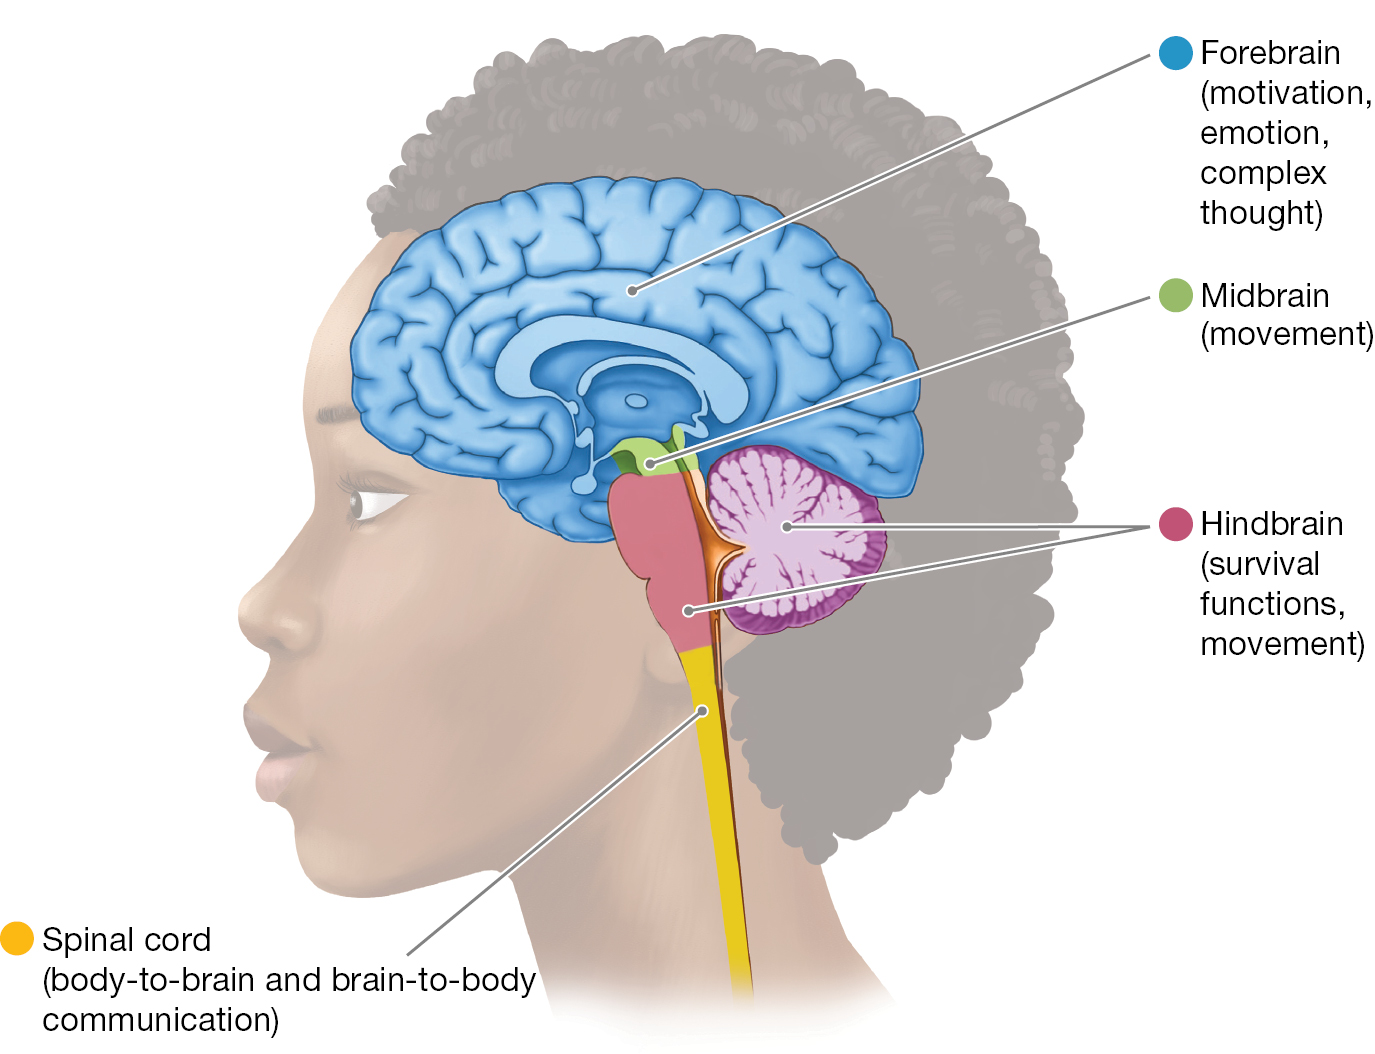
The Forebrain is very large and covers both hemispheres. A label reads forebrain (motivation, emotion, complex thought). The midbrain is very small and is located below the forebrain but above the hindbrain and spinal cord. A label reads midbrain (movement). The Hindbrain is small and circular and is located below the back of the forebrain. A label reads hindbrain (survival functions, movement). The spinal cord is directly below the hindbrain. A label reads spinal cord (brain-body communication).
FIGURE 2.14 Three Main Brain Divisions
Shown here are the hindbrain, the midbrain, and the forebrain, plus the spinal cord.
LEARNING GOAL CHECK: REVIEW