Learning Objectives
- Identify three characteristics that reflect the quality of data.
- Describe measures of central tendency and variability.
- Discuss the rationale for inferential statistics.
After a researcher has conducted a study and collected data, the next step is to analyze the data to reveal the results. This section examines the characteristics that make for good data and the statistical procedures that researchers use to analyze data.
If you collect data to answer a research question, the data must be valid. Valid data should accurately measure the constructs (or concepts) that you think they measure, reflect the way the phenomenon of interest occurs outside of the laboratory, and reveal effects due specifically and only to manipulation of the independent variable.
Construct validity is the extent to which variables measure what they are supposed to measure. For example, suppose that at the end of the semester your psychology professor gives you a final examination that consists of chemistry problems. This kind of final examination would lack construct validity—it would not accurately measure your knowledge of psychology (FIGURE 2.26).
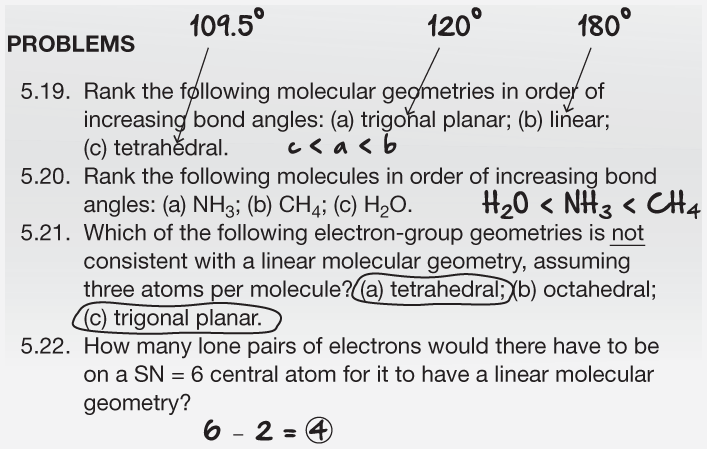
FIGURE 2.26
Construct Validity
Imagine having to answer questions like this on your psychology final. The results would lack construct validity because the course is about psychology, not chemistry.
Now imagine you are a psychological researcher. You hypothesize that “A students” spend more time studying than “C students.” To test your hypothesis, you ask students to self-report the amount of time they spend studying. However, what if C students tended to do other things—such as sleeping, playing video games, or scrolling on Instagram—while they claimed to be studying? If this were the case, the data would not accurately reflect studying and would therefore lack construct validity.
External validity is the degree to which the findings of a study can be generalized to other people, settings, or situations. A study is externally valid if (1) the participants adequately represent the intended population, and (2) the variables were manipulated and measured in ways similar to how they occur in the “real world.”
Internal validity is the degree to which the effects observed in an experiment are due to the independent variable and not to confounds. For data to be internally valid, the experiment must be well designed and well controlled (FIGURE 2.27). That is, the participants across all groups must be as similar as possible, and there must be a control group (FIGURE 2.28). Only by comparing experimental groups to control groups can you determine that any changes observed in the experimental groups are caused by the independent variable and not something else (for example, practice or the passage of time). Internal validity follows from the principles of the experimental method described in Sections 2.7 and 2.8, such as random assignment to conditions, adequately large sample sizes, and control over known and unknown confounds.
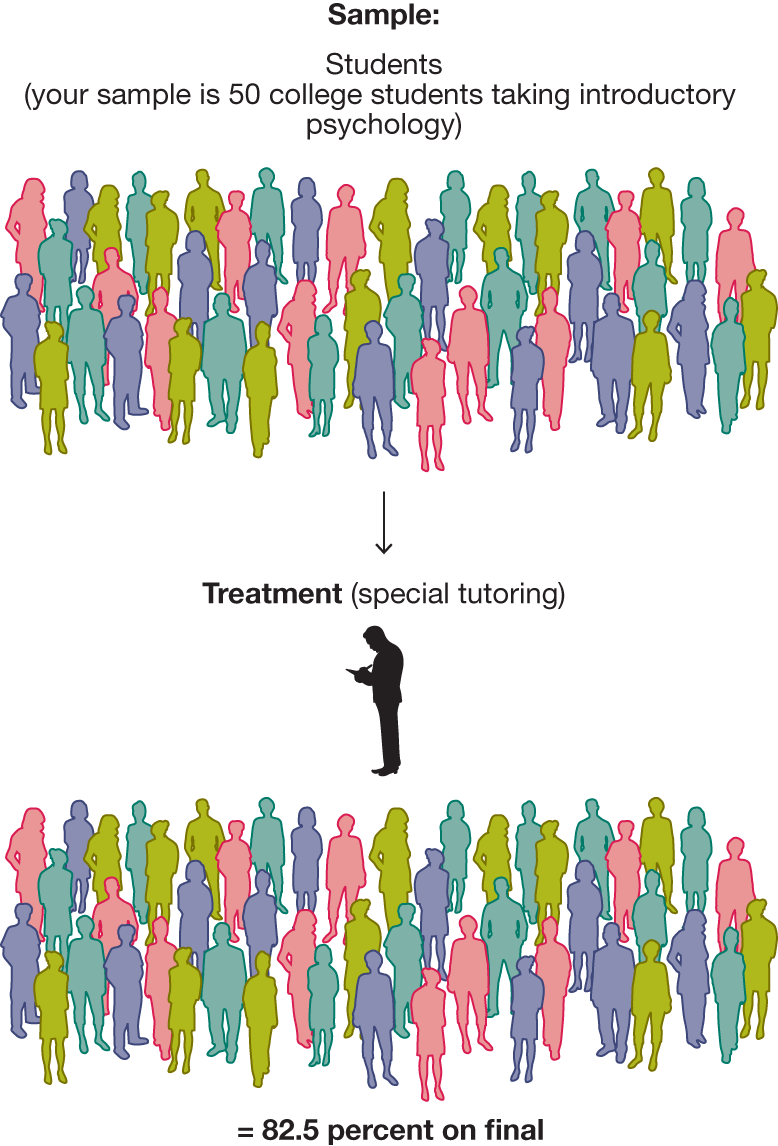
FIGURE 2.27
A Study Lacking Internal Validity
In this study, your entire sample is one experimental group that receives the treatment of special tutoring. You determine the group’s average score on the final exam, but you cannot compare that result with the result from a control group.
FIGURE 2.28
A Study with Internal Validity
In this better study, you divide the sample into an experimental group and a control group. Only the experimental group receives the treatment. You can then compare that group’s results with the results from the control group.
Another important aspect of data is reliability, the stability and consistency of a measure over time. If the measurement is reliable, the data collected will not vary substantially over time. For instance, one option for measuring the duration of studying would be to have an observer use a stopwatch. However, there will probably be some variability in when the observer starts and stops the watch relative to when the student actually starts studying. Consequently, the data in this scenario would be less reliable than data collected by an automated feature in an online study system that measured how much time students spent working on assignments.
The third and final characteristic of good data is accuracy, the degree to which the measure is error free. A measure may be reliable but still not accurate. Psychologists think about this problem by turning it on its head and asking: How do errors seep into a measure?
Suppose you use a stopwatch to measure the duration of studying. The problem with this method is that each measurement will tend to overestimate or underestimate the duration (because of human error or variability in recording times). This type of problem is known as a random error or unsystematic error. Although an error is introduced into each measurement, the value of the error differs each time. But suppose the stopwatch has a glitch, so that it always overstates the time measured by 1 minute. This type of problem is known as a systematic error or bias, because the amount of error introduced into each measurement is constant. Generally, systematic error is more problematic than random error because the latter tends to average out over time and therefore is less likely to produce inaccurate results.