Methods Used to Study Sex/Gender Similarities and Differences
What are some methods and statistics used in studying sex/gender similarities and differences?
Before reviewing data on sex/gender differences in cognitive skills, personality, and behavior, it’s important to discuss commonly used research terminology and statistics. Human sex difference is an index term in PsychINFO, and there are over 79,000 peer-reviewed studies with this index term. Since the results of these studies may vary, it’s useful to consider how researchers combine results from many studies to examine the big picture. This involves meta-analysis, a process that statistically combines results from a large number of studies. It’s essentially a study of studies in which findings from existing studies serve as the data used in the new summary study. A meta-analysis has the potential of combining data from thousands of studies that look at millions of people. A more recent technique is meta-synthesis, which statistically combines the results of many meta-analyses (Zell et al., 2015).
Once again, it’s important to note that the field of psychology has traditionally been, and continues to be, geared toward detecting and reporting difference. There are no index terms in PsychINFO about sex or gender similarities. However, if you search for “sex similarities” or “gender similarities” (putting quotation marks around the words), you’ll find fewer than 500 results. Additionally, while researchers’ statistical tools measure difference, there are no tools to measure similarity (Nelson, 2015). When a study looking for sex/gender differences doesn’t find any, the findings are considered “non-significant” (e.g., no significant differences are found) and generally remain unpublished, leading to the file drawer problem (Rosenthal, 1979). In other words, studies that don’t find differences are often filed away (in the metaphorical circular file, or trash bin). For this reason, the field is biased toward finding and explaining difference.
Although the file drawer problem is a challenge, it may not be insurmountable. A lot of published studies report scores for women and men separately, even when they weren’t designed to explore sex/gender differences. These studies may find similarities between women and men but still get published because their main finding is about something else. Therefore, meta-analyses and meta-syntheses can be used with some level of confidence to determine the level of sex/gender difference. In fact, some meta-analyses account for the bias toward difference by reporting a fail-safe number, which represents how many non-significant and non-published results would need to exist for the findings that they report to be eliminated (Chaplin & Aldao, 2013). Other meta-analyses examine both published and unpublished studies, such as data sets from dissertations (see Else-Quest et al., 2012).
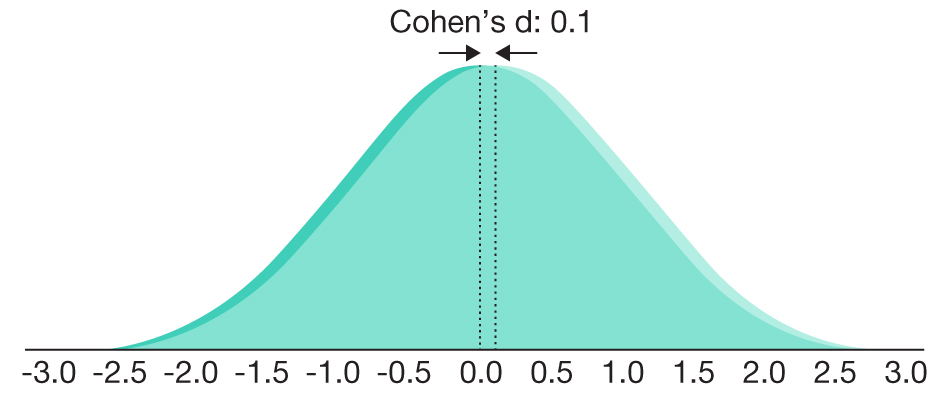
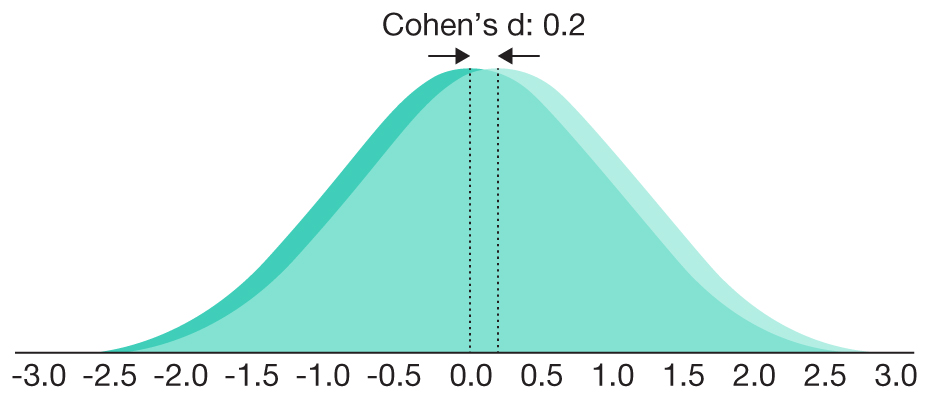
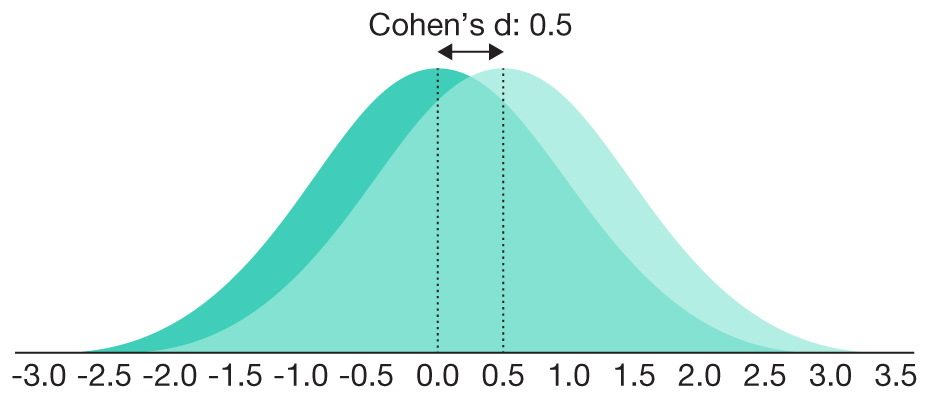
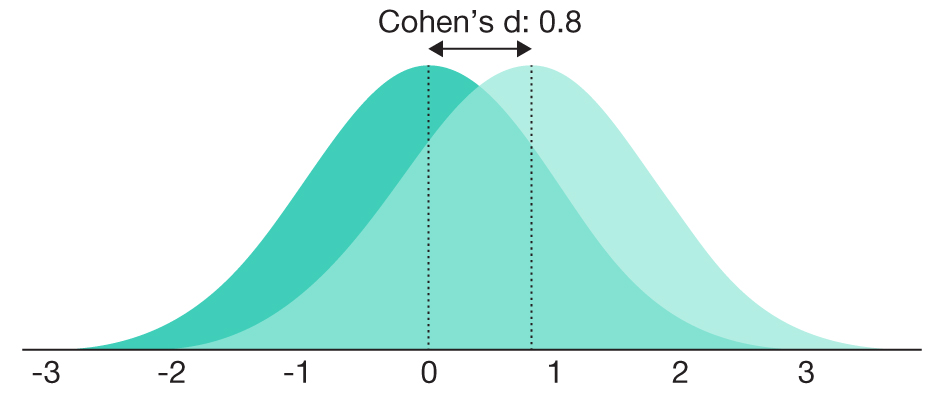
When data from many studies are combined in a meta-analysis or meta-synthesis, the results are generally presented in terms of an effect size, or a d statistic (Cohen, 1988). This number indicates how big or small a difference is. As Table 3.2 shows, an effect size of 0.1 (or less) is considered negligible, meaning any difference is essentially assumed not to exist. An effect size of 0.2 is considered small, 0.5 is considered medium, and 0.8 is considered to be a large difference between groups. It is also important to understand how to interpret the d statistic. It’s a general convention to report effect sizes such that positive d scores reflect men scoring higher than women and negative d scores reflect women scoring higher than men. Although not all studies do this (Priess & Hyde, 2010), we’ll use this convention when reporting effect sizes.
It’s important to remember that even when a large effect is found to exist, this doesn’t mean that women and men are two completely distinct groups. After all, taxonomic analysis has shown that women and men are not distinct groups on most variables (Carothers & Reis, 2013). To think about this in terms of effect sizes, consider that even with a large effect there would be a 69% overlap between women and men, as Table 3.2 shows. The overlap is even greater with smaller effects, and small effect size differences are the most common in sex/gender difference research. If the effect size is small, 92% of women and men would have similar scores—indicating a great deal of overlap.
Another statistic to consider is variability, or the degree to which the scores are spread out. Imagine a set of five scores with an average of 100. If the scores were 99, 100, 100, 100, and 101, there would be low variability. But if the scores were 50, 75, 100, 125, and 150, there would be greater variability. Men and women may have similar scores on average, but their scores may differ in variability—in other words, even though the groups don’t differ on average, there may be more of one group who score very low and very high.
In her review of how assumptions about sex/gender difference have served to justify women’s subordinate status, psychologist Stephanie Shields wrote in 1975: “The variability hypothesis is all but absent from contemporary psychological work, but if it ever again promises a viable justification for existing social values, it will be back as strongly as ever” (Shields, 1975, p. 751). Indeed, the variability hypothesis did come back. In 2005, Larry Summers, then president of Harvard University, spoke at a conference on diversifying the science and engineering workforce to address why there are proportionally fewer women than men in the sciences. He noted that “in the special case of science and engineering, there are issues of intrinsic aptitude, and particularly of the variability of aptitude” (Summers, 2005, para. 6). His comments caused a firestorm of controversy at the time—probably because they sounded very similar to statements made historically to justify claims about women’s supposed inferiority.
TABLE 3.2 Common Effect Size Standards
|
Effect Size: d |
Effect Size: Label |
Percentage overlap between groups |
What does it look like? |
|
0.1 |
Negligible |
96.01% |
 |
|
0.2 |
Small |
92.03% |
 |
|
0.5 |
Medium |
80.26% |
 |
|
0.8 |
Large |
68.92% |
 |
The Big Picture
Overall, are women and men more similar or different, and what is the degree of overlap?
Researchers have reviewed data from many meta-analyses to gain an overall picture of the extent of sex/gender differences. In 2005, psychologist Janet Hyde reviewed 46 meta-analyses. She found that 30% of the effect sizes were negligible (d < 0.1) and 48% were small (d = 0.11 to 0.35). Therefore, 78% of sex/gender differences were either negligible or small. In 2015, researchers conducted an updated review using meta-synthesis of 106 meta-analyses with 386 different reported results (Zell et al., 2015). The total number of participants across all the studies reviewed was over 12 million. The meta-synthesis found an effect size for the overall difference between women and men of 0.21, a small effect. Overall, women and men were found to have a great deal in common—over 90% of women and men overlapped, but there was a small overall difference. When the authors of the meta-synthesis looked specifically at the 386 different meta-analytic results, they found, similar to Hyde (2005), that 85.5% of the effect sizes indicated either negligible or small differences.
Interestingly, the meta-synthesis authors also provided some support for the file drawer problem, in which only studies that find statistically significant sex/gender differences get published (Zell et al., 2015). When the authors incorporated results from both published and unpublished studies, there was a slightly smaller effect size (d = 0.19) than when using only published studies (d = 0.24).