One of the most widely used personality tests in the world is the Minnesota Multiphasic Personality Inventory (MMPI).1 This test was designed for use in the clinical assessment of individuals with psychological difficulties, but it has also been used for many other purposes, such as employment screening. Another widely used test is the California Psychological Inventory (CPI), which is similar to the MMPI in many ways but is designed for use with so-called “normal” or nondisturbed individuals. Others include the Sixteen Personality Factor Questionnaire (16PF); the Strong Vocational Interest Blank (SVIB), used to help people choose suitable careers; the Hogan Personality Inventory (HPI), used by employers for personnel selection; and many more.
Many personality tests, including those just listed, are omnibus inventories, which means they measure a wide range of personality traits. The NEO Personality Inventory, for instance, measures five broad traits along with 30 subscales or “facets” (Costa & McCrae, 1997).2
Others measure just one trait. Tests are available to measure shyness, self-consciousness, self-monitoring, empathy, attributional complexity, nonverbal sensitivity, and so on. No one has done an exact count, but there must be thousands of such tests, and new ones appear every day.
S-Data Versus B-Data Personality Tests
To use the terms introduced in Chapter 2, most personality tests provide S data. They ask you what you are like, so the score you receive amounts to a summary of how you describe yourself. The “self-monitoring” scale asks how closely you watch other people for cues as to how to behave. The “attributional complexity” scale asks about the level of complexity in your thinking about the causes of behavior. The first question on the widely used Stanford Shyness Survey is simply “Do you consider yourself to be a shy person?” The possible responses are “yes” or “no” (Zimbardo, 1977). You can probably guess how this item is scored.
Other personality tests yield B data. The MMPI is a good example. It presents items—such as “I prefer a shower to a bath”—not because the tester is interested in the literal answer, but because answers to this item are informative about some aspect of personality, in this case, empathy. Preferring a shower is the empathic response, for some reason (Hogan, 1969).
Simply asking people whether they are smart turns out to be a poor way to measure intelligence.
Is intelligence a personality trait? Psychologists have differing opinions (what’s yours?). Either way, tests of intelligence, or IQ tests, also yield B data. Imagine trying to assess intelligence using an S-data test, asking questions such as, “Are you an intelligent person?” and “Are you good at math?” Researchers have actually tried this, but simply asking people whether they are smart turns out to be a poor way to measure intelligence (Furnham, 2001). So, instead, IQ tests ask people questions of varying difficulty, such as reasoning or math problems, that have specific correct answers. These right or wrong answers comprise B data. The more right answers, the higher the IQ score.
Some experts in assessment have proposed that tests based on (what I call) B data be labeled “performance-based” instruments (McGrath, 2008). These include the IAT, the MMPI, and IQ tests, which were just described. They also include instruments that traditionally have been called “projective” tests.
Projective Tests
THE PROJECTIVE HYPOTHESIS Projective tests were originally based on a theory called the projective hypothesis (Frank, 1939). The theory is this: If somebody is asked to describe or interpret a meaningless or ambiguous stimulus—such as an inkblot—her answer cannot come from the stimulus itself, because the stimulus actually does not look like, or mean, anything. The answer must instead come from (be a “projection” of) her needs, feelings, experiences, thought processes, and other hidden aspects of the mind (Murray, 1943). The answer might even reveal something the person does not know about herself. (Notice that this could never happen with S data.)
This is the theory behind the famous Rorschach inkblot (Exner, 1993; Rorschach, 1921). Swiss psychiatrist Hermann Rorschach dropped blots of India ink onto note cards, folded the cards in half, and then unfolded them. The result was a set of symmetric, complex blots.3 Over the years, uncounted psychiatrists and clinical psychologists have shown these blots to their clients and asked them what they saw.
Of course, the only literally correct answer is “an inkblot,” but that is not considered a cooperative response. Instead, the examiner is interested in whether the client will report seeing a cloud, a devil, her father, or whatever. I once heard a clinical psychologist describe a client who reported seeing a “crying St. Bernard.” The woman who gave this response was grieving over a boating accident in which she accidentally killed her husband. The psychologist interpreting her response noted that dogs don’t cry, but people do, and the traditional role of a St. Bernard is as a rescuer. This interpretation illustrates how whatever the client sees, precisely because it is not actually on the card, may reveal something about the contents of her mind. It also illustrates that the thoughts revealed by the inkblot response might not necessarily be deep, hidden, or mysterious. While it was interesting and probably useful for this therapist to know that his client was still upset about the accident, it wasn’t exactly surprising.
Interpretation is sometimes subtler. Consider these two responses to Card I of the Rorschach (which I am not supposed to show you, but you will be able to guess what it looks like). One client said: “This is a butterfly. Its wings are ripped and tattered, and it doesn’t have very long to live.” Another client responded to the same card by saying: “This is a butterfly. I don’t know what to make of these white spaces; I don’t know any kind of butterfly with white spots on its wings quite like that. They really shouldn’t be there, but I guess its wings are ripped” (McGrath, 2008, p. 471).
Psychologist Robert McGrath (2008) noted that the first response seems to reveal some morbid preoccupations, due to its reference to death and redundant use of the words “ripped” and “tattered.” The second response seems to reveal a tendency to obsess or overanalyze. This kind of interpretation is difficult to verify, and it stems from the assumption that responses to inkblots reflect the basic way personality operates. Because one client thought the butterfly didn’t have long to live, the inference was that she was preoccupied with death; because the other client overanalyzed the Rorschach card, the inference was that he was obsessive in daily life as well.
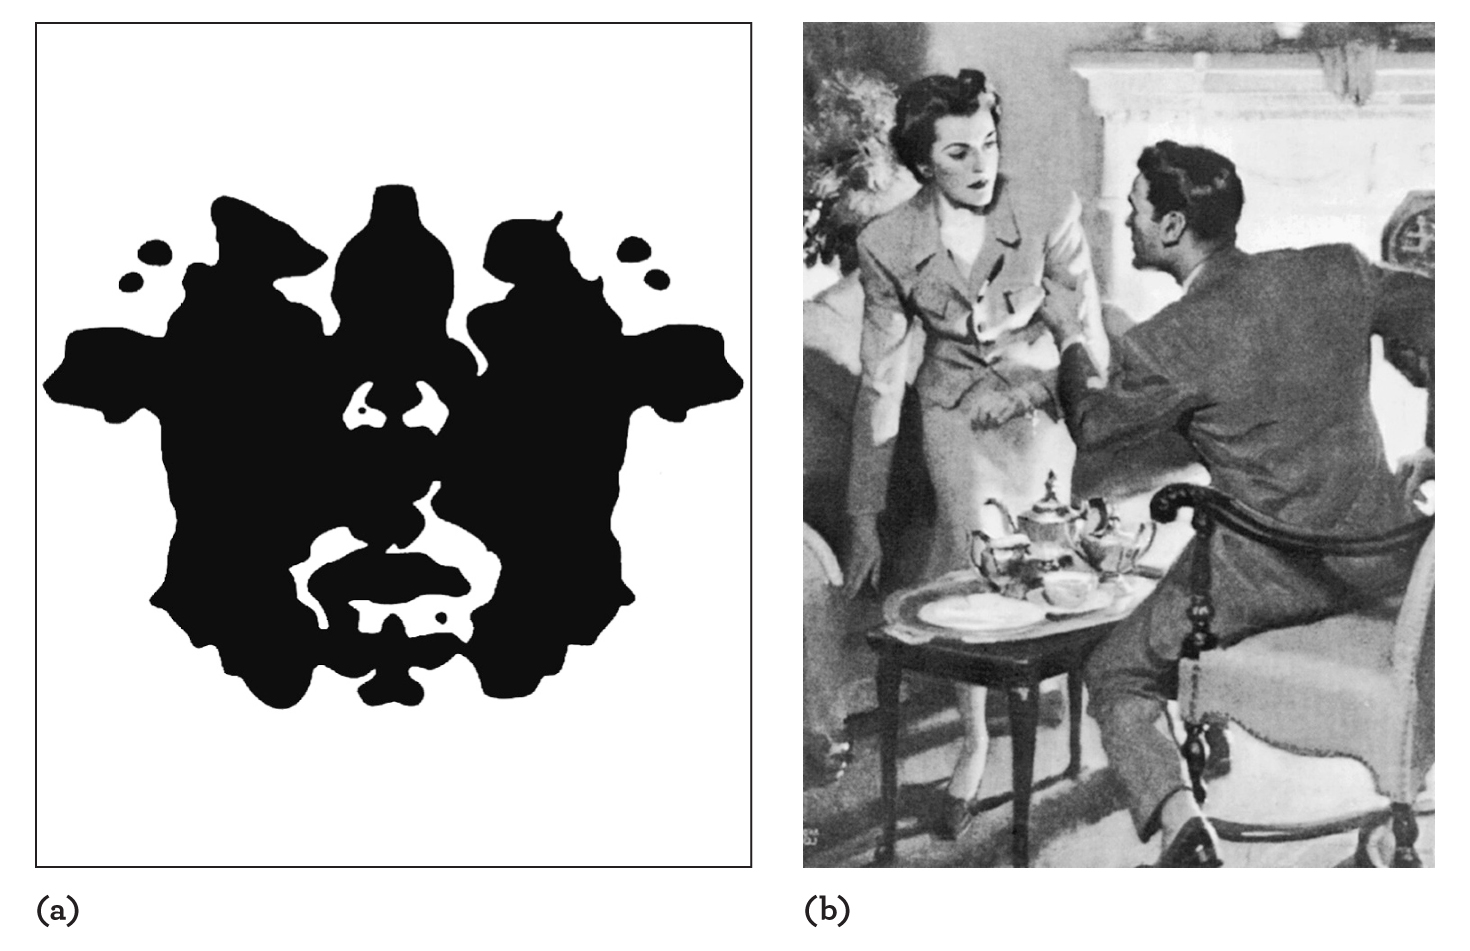
Figure 3.1Two Projective Tests (a) Rorschach inkblot: This picture resembles—but is not—one of the inkblots in Rorschach’s famous test. The real blots traditionally are not published so that someone taking the test will see them for the first time. (b) Thematic Apperception Test: The task is to make up stories about a series of pictures like these. Themes in the stories are interpreted as indicating “implicit motives” of which the person might not himself be aware.
The same logic has led to the development of numerous other projective tests. The Draw-A-Person test requires the client to draw (you guessed it) a person, and the drawing is interpreted according to what kind of person is drawn (e.g., a man or a woman), which body parts are exaggerated or omitted, and so forth (Machover, 1949). Large eyes might be taken to indicate suspiciousness or paranoia; heavy shading might mean aggressive impulses; and numerous erasures could be a sign of anxiety. The classic Thematic Apperception Test (TAT) asks clients to tell stories about a set of drawings of people and ambiguous events (Morgan & Murray, 1935; Murray, 1943). A more recent version uses pictures that include “a boy in a checked shirt . . . a woman and a man on a trapeze, two men in a workshop, and a young woman working on the [balance] beam” (Brunstein & Maier, 2005, p. 208). The themes of these stories are used to assess the client’s motivational state (McClelland, 1975; Smith, 1992). If a person looks at an ambiguous drawing of two people and thinks they are fighting, for example, this might reveal a need to be aggressive; if the two people are described as in love, this might reflect a need for intimacy; if one is seen as giving orders to the other, this might reflect a need for power.
Projective tests of a sort can even be administered to people “from a distance,” without them getting anywhere near a psychologist (Winter, 1991). Psychologists have tried to assess needs and other aspects of personality by analyzing the content of stories, essays, letters, and even political speeches.
The projective hypothesis behind all these tests is an interesting and seemingly reasonable idea, and interpretations of actual responses can be fascinating. A large number of practicing clinicians swear by their efficacy. However, research data on the validity of these tests—the degree to which they actually measure what they are supposed to measure—is scarcer than you might expect (Lilienfeld, Wood, & Garb, 2000).
To again use the terminology introduced in Chapter 2, all projective tests provide B data. They are specific, directly observed responses to particular stimuli, whether inkblots, pictures, or instructions to draw somebody. All the disadvantages of B data therefore apply to projective tests. For one thing, they are expensive. It takes around 45 minutes to administer a single Rorschach and another 1.5 to 2 hours to score it (Ball, Archer, & Imhof, 1994). Compare this to the time needed to hand out a pile of questionnaires and run them through a machine. This issue is serious because it would not be enough for projective tests to have some small (and perhaps surprising) degree of validity. For their continued use to make any sense, critics have argued, projective tests should provide extra information that justifies their much greater cost (Lilienfeld et al., 2000).
TRY FOR YOURSELF 3.1
Two Projective Tests
Instructions: Look at the inkblot in Figure 3.1a. On a sheet of paper, write down what it looks like to you—no more than a sentence or two. Then look at the drawing in Figure 3.1b. Try to imagine what it depicts, and then write down:
Who are the people in the picture?
What are they doing right now?
What were they doing before this moment?
What will happen next?
After you are finished, show the pictures to a friend and, without revealing your own responses, ask him or her to do the same thing. Then, compare your responses. Were they different? Do you think the differences mean anything? Do they reveal anything surprising?
Please note that these are not actual personality tests (the blot is not actually part of the Rorschach, and the picture is not part of the TAT). However, the exercise will give you a general idea of how these tests work.
The even more fundamental difficulty with projective tests is that, perhaps even more than other kinds of B data, a psychologist cannot be sure what they mean. What does it mean when somebody thinks an inkblot looks like a crying dog, or imagines that an ambiguous picture portrays a murder, or draws a person with no ears? Two different interpreters of the same response might come to different conclusions unless a standard scoring system is used (Sundberg, 1977). But of the projective tests, only the TAT is consistently scored according to a well-developed system (McAdams, 1984). While scoring systems have been developed for the Rorschach (Exner, 1993; Klopfer & Davidson, 1962), not everybody uses them, and even then, the training most practitioners get is less than ideal (Guarnaccia, Dill, Sabatino, & Southwick, 2001).
The survival of so many projective tests into the 21st century is something of a mystery. Literature reviews that claim projective tests have some degree of validity generally conclude that other, less expensive techniques work as well or even better (Garb, Florio, & Grove, 1998, 1999; Lilienfeld et al., 2000). Even more disturbing, projective tests of dubious validity, such as ones that ask clients to draw human figures, are sometimes used as evidence in court cases (Lally, 2001).4 Measurement expert Ann Anastasi wrote several decades ago, “projective techniques present a curious discrepancy between research and practice. When evaluated as psychometric instruments, the large majority make a poor showing. Yet their popularity in clinical use continues unabated” (Anastasi, 1982, p. 564). Her comment remains true today (Camara, Nathan, & Puente, 2000).
Perhaps projective tests endure because some clinical psychologists have fooled themselves. One writer has suggested that these clinicians may lack “a skill that does not come naturally to any of us: disregarding the vivid and compelling data of subjective experience in favor of the often dry and impersonal results of objective research” (Lilienfeld, 1999, p. 38). Perhaps the problem is not that the tests are worthless, but that they have been used inappropriately (Wood, Nezworski, & Garb, 2003). Or, as others have suggested, perhaps the validity of these tests is beside the point. They simply serve a useful, if nonpsychometric, function of “breaking the ice” between client and therapist by giving them something to do during the first visit. Or, just possibly, these instruments have a certain, special validity in their application by certain skilled clinicians that cannot be duplicated by other techniques and that has not been fully captured by controlled research.
EVALUATING THE RORSCHACH AND THE TAT While data for the validity of most projective tests is either unpersuasive or simply missing, two widely used tests are held out as exceptions. The Rorschach and the TAT remain in wide use both by researchers and clinicians, and continue to be stoutly defended. So, let’s take a closer look at the evidence about these two tests.
According to one survey, 82 percent of clinical psychologists use the Rorschach at least occasionally (Watkins, Campbell, Nieberding, & Hallmark, 1995). The meetings of a major professional society, the Society for Personality Assessment, regularly include research and demonstrations with the Rorschach. It remains clinical psychology’s fourth most used test,5 and continues to be widely taught in clinical graduate programs.
Research indicates that the Rorschach gets best results when it is scored according to one of two specific techniques: either Exner’s Comprehensive System (Exner, 1993) or Klopfer’s technique (Klopfer & Davidson, 1962). According to a comprehensive review, the correlation coefficient between scores garnered from one of these systems and various criteria relevant to mental health averaged about .33 (Garb et al., 1998).6 As will be illustrated later in this chapter, this correlation means that a dichotomous (Yes or No) diagnostic decision made using the Rorschach will be correct about 66 percent of the time (assuming that a random decision would be correct 50 percent of the time). Research also suggests that the Rorschach might be particularly valid—and actually somewhat better than the MMPI—for predicting specific outcomes such as suicide, attendance at treatment sessions, or commitment to a mental hospital (Hiller, Rosenthal, Bornstein, Berry, & Brunell-Neuleib, 1999).7
The other projective test with some degree of established validity—probably better than the Rorschach—is the TAT (McClelland, 1984). In current research, the test is often administered in a newer, shorter form called the Picture Story Exercise (PSE) (McClelland, Koestner, & Weinberger, 1989). The stimuli for this test are from four to eight (versions vary) drawings or photographs that show scenes such as a ship captain talking to a passenger or two women working in a laboratory. The purpose of the TAT (and PSE) is to measure implicit motives, motivations concerning achievement, intimacy, power, and other matters of which the participant might not be fully aware. Studies have shown these motives to be related to complex thinking (cognitive complexity), the experiences one finds most memorable, and other psychological outcomes (Woike, 1995; Woike & Aronoff, 1992).
Figure 3.2Analyzing Presidential Needs Based on an analysis of their inaugural addresses, psychologist David Winter rated (a) Jimmy Carter as the president of the United States who was highest in need for “achievement,” (b) George H. W. Bush as highest in need for “affiliation,” and (c) John F. Kennedy as highest in need for “power.” (Barack Obama and Donald Trump had not yet been elected; where do you think they would place on these dimensions?)
The methods used to assess motives from the TAT can also be used with other sources of data, including even presidential speeches. The psychologist David Winter (2002) found that presidents who revealed a large need for achievement in their inaugural addresses (e.g., Presidents Wilson, Hoover, Nixon, and Carter) began with a flurry of activity, became frustrated with political obstacles, and ended up achieving little.
Objective Tests
The tests that psychologists call “objective” can be detected at a glance. If a test consists of a list of questions to be answered Yes or No, or True or False, or on a numeric scale, and especially if the test uses a computer-scored answer sheet, then it is an objective test. The term comes from the idea that the questions making up the test seem more objective and less open to interpretation than the pictures and blots used in projective tests.
VALIDITY AND SUBJECTIVITY OF TEST ITEMS It is not clear that the term “objective” is really justified (Bornstein, 1999a). Consider the first item of the famous MMPI. The item reads, “I like mechanics magazines,” which is to be answered True or False (Wiggins, 1973). The item may seem objective compared with a question like, “What do you see in this inkblot?” But the appearance could be misleading. Does “like” mean interest, fondness, admiration, or tolerance? Does liking such magazines require that you regularly read them? Are Popular Mechanics and Car and Driver mechanics magazines? How about Computer World? Are only popular magazines included, or does the item also refer to trade journals of professional mechanics or to the research literature produced by professors of mechanical engineering? This item is rather typical. And it illustrates how elusive “objectivity” can be.
It is difficult to escape the conclusion that the items on objective tests, while perhaps not as ambiguous as projective tests, are still not absolutely objective. But maybe that’s not such a bad thing. If everybody read and interpreted an item in exactly the same way, then might not everybody also tend to answer the item in the same way? If so, the item would not be very useful for the assessment of individual differences, would it? In some cases, the ambiguity of an objective item may not be a flaw; its interpretation might have to be somewhat subjective in order for responses to imply anything about personality.
Harrison Gough, inventor of the California Psychological Inventory, included on his test a scale called commonality, which consists of items that are answered in the same way by at least 95 percent of all people. He included it to detect illiterates pretending they know how to read and individuals trying to sabotage the test. The average score on this scale is about 95 percent, but an illiterate answering at random will score about 50 percent (since it is a true-false scale) and therefore will be immediately identifiable, as will someone who (like one of my former students) answered the CPI by flipping a coin—heads True, tails False.
These are interesting and clever uses for a commonality scale, but its properties are mentioned here to make a different point. Gough reported that when individuals encounter a commonality item—one being “I would fight if someone tried to take my rights away” (keyed True)—they do not say to themselves, “What a dumb, obvious item. I bet everybody answers it the same way.” Instead, they say, “At last! A nonambiguous item I really understand!” People enjoy answering the commonality items because they seem clear and easy to answer (J. A. Johnson, 2006).8 Unfortunately, commonality items are not very useful for personality measurement, because almost everybody responds to them the same way. A certain amount of ambiguity may indeed be necessary (Gough, 1968; J. A. Johnson, 1981).
WHY SO MANY ITEMS? If you look at a typical objective test, one of the first things you will notice is how many questions it asks. The number may be very large. Some of the shorter personality tests have around a dozen items, but most have far more, and a few of the most famous personality tests (such as the MMPI, CPI, and NEO) have hundreds. To complete a test like this can take an hour or more, and a fairly tedious hour at that.
Why so many items? The answer lies in the principle of aggregation that was introduced in Chapter 2. The answer an individual gives to any one question might not be particularly informative; it might vary according to exactly how he interprets it or other extraneous factors. In the terminology used in Chapter 2, a single answer will tend to be unreliable. But if a group of similar questions is asked, the average of the answers ought to be much more stable, or reliable, because random fluctuations tend to cancel each other out.
For this reason, one way to make a personality test more reliable is simply to make it longer. If you add items that measure the trait in question as accurately as the existing items do—something easier said than done, frankly—then the improvement in reliability can be estimated using the Spearman-Brown formula,9 which was mentioned in Chapter 2. The improvements in reliability can be remarkable. For example, if a 10-item test has a reliability of .60—which would be considered rather poor for an objective test—adding 10 more items can raise the reliability to .75, which would be considered much better. Double the number of items again, to 40, and the reliability increases to .86.
As you will recall from Chapter 2, a reliable test is one that gives close to the same answer time after time. However, you will also recall that, while reliability is necessary for validity, it is no guarantee. The validity of an objective test depends on its content. The crucial task in test construction, then, is to write and select the right questions. That is the topic of the next section.
Methods of Objective Test Construction
Three basic methods are commonly used for constructing objective personality tests: the rational method, the factor analytic method, and the empirical method. Test constructors often employ a mixture of methods, but let’s begin by considering the pure application of each.
THE RATIONAL METHOD Calling one method of test construction “rational” does not mean the others are irrational. It simply means that the strategy of this approach is to come up with items that seem directly, obviously, and rationally related to what the test developer wishes to measure. An early example of a test constructed this way is one used during World War I. The U.S. Army discovered, not surprisingly, that certain problems arose when individuals who were mentally ill were inducted as soldiers, housed in crowded barracks, and issued weapons. To avoid these problems, the army developed a structured interview comprising a list of questions for a psychiatrist to ask each potential recruit. As the number of inductees increased, this slow process became impractical. There were not enough psychiatrists to go around, nor was there enough time to interview everybody.
To get around these limitations, psychologist R. S. Woodworth (1917) proposed that the questions could be printed on a sheet, and the recruits could check off their answers with a pencil. His list, which became known as the Woodworth Personality Data Sheet (or, inevitably, the WPDS), consisted of 116 questions deemed relevant to potential psychiatric problems. They included “Do you wet your bed?” “Have you ever had fits of dizziness?” and “Are you troubled with dreams about your work?” A recruit who responded Yes to more than a small number of these questions was referred for a more personal examination. Recruits who answered No to all the questions were inducted forthwith into the army.
Woodworth’s idea of listing psychiatric symptoms on a questionnaire was not unreasonable, yet his technique raises a variety of problems that can be identified rather easily. For the WPDS to be a valid indicator of psychiatric disturbance—for any rationally constructed, S-data personality test to work—four conditions must hold (Wiggins, 1973).
First, each item must mean the same thing to the person who takes the test as it did to the psychologist who wrote it. For example, in the item from the WPDS, what is “dizziness” exactly? If you have been sitting down for a long time, suddenly stand up, and feel a little bit dizzy, does that count?
Second, the person who completes the form must be able to make an accurate self-assessment. He (only men were being recruited at the time the WPDS was administered) must have a good enough understanding of what each item is asking, as well as the ability to observe it in himself. He must not be so ignorant or psychologically disoriented that he cannot report accurately on these psychological symptoms.
Third, the person who completes the test must be willing to report his self-assessment accurately and without distortion. He must not try to deny his symptoms (in order to get into the army) or to exaggerate them (perhaps in order to stay out of the army). Modern personality tests used for selecting employees can encounter the very same problem in that, rather than responding honestly, people might try give the answers they think will help them get a job (Griffith & Peterson, 2006; Rosse, Stecher, Miller, & Levin, 1998).
Fourth and finally, all of the items on the test must be valid indicators of what the tester is trying to measure—in this case, mental disturbance. Does dizziness really indicate mental illness? What about dreams about work?
For a rationally constructed test to measure an attribute of personality accurately, all four of these conditions must be met. In the case of the WPDS, probably none of them was.10 In fact, most rationally constructed personality tests fail one or more of these criteria. One might conclude, therefore, that they would hardly ever be used anymore.
Wrong. Up to and including the present day, self-report questionnaires that are little different, in principle, from the WPDS remain the most common form of psychological measurement. Self-tests in popular magazines are also always constructed by the rational method—somebody just thinks up some questions that seem relevant—and they almost always fail at least two or three of the four crucial criteria.
Rationally constructed personality tests appear in psychological journals, too. Such journals present a steady stream of new testing instruments, nearly all of which are developed by the simple technique of thinking up a list of questions. These questions might include measures of health status (How healthy are you?), self-esteem (How good do you feel about yourself?), or goals (What do you want in life?).
For example, research has addressed the differences between college students who follow optimistic or pessimistic strategies in order to motivate themselves to perform academic tasks (such as preparing for an exam). Optimists, as described by this research, motivate themselves to work hard by expecting the best outcome, whereas pessimists motivate themselves by expecting the worst to happen unless they work hard. Both strategies seem to be effective, although optimists may have more pleasant lives (Norem & Cantor, 1986). (These strategies are considered in more detail in Chapter 14.) For the purposes of this chapter, the question is, how are optimists and pessimists identified? The researchers in this study used an eight-item questionnaire that included self-ratings such as “I go into academic situations expecting the worst, even though I know I will probably do OK” (see Try for Yourself 3.2).
TRY FOR YOURSELF 3.2
Optimism-Pessimism Test
Instructions: When you answer the following questions, please think about how you prepare for and think about academic situations. Each of the statements below describes how people sometimes think or feel about these kinds of situations. In the blanks beside each statement, please indicate how true it is of you, in academic situations.
____1. I go into academic situations expecting the worst, even though I know I will probably do OK.
____2. I generally go into academic situations with positive expectations about how I will do.
____3. I carefully consider all possible outcomes before academic situations.
____4. I often worry, in academic situations, that I won’t be able to carry through my intentions.
____5. I often think about how I will feel if I do very poorly in academic situations.
____6. I often think about how I will feel if I do very well in academic situations.
____7. I often try to figure out how likely it is that I will do very poorly in academic situations.
____8. I spend a lot of time planning when an academic situation is coming up.
____9. I often try to figure out how likely it is that I will do very well in academic situations.
____10. In academic situations, sometimes I worry more about looking like a fool than doing really well.
____11. Prior to academic situations, I avoid thinking about possible bad outcomes.
____12. Considering what can go wrong in academic situations helps me to prepare.
Scoring Instructions: Add up your answers to items 1, 3, 4, 5, 6, 7, 8, 9, 10, and 12. Reverse-score your answers to items 2 and 11 (that is, convert 1=7, 2=6, 3=5, 4=4, 5=3, 6=2, and 7=1). Then add those scores to the total. In one large sample of people who took this test, the mean was 54.2. Scores do not appear to differ, on average, between women and men or according to age. Scores below 50 would typically be categorized as “strategic optimists”; scores above 60 would be categorized as defensive pessimists.
Source: Adapted from Norem & Prayson (2015).
By the definitions I have been using, this is a rationally constructed, S-data personality test. And, in fact, it seems to work fairly well at identifying students who approach academic life in different ways. So clearly, tests like this can be valid, even though the four criteria for validity raised earlier should always be kept in mind.
THE FACTOR ANALYTIC METHOD The factor analytic method of test construction is based on a statistical technique. Factor analysis identifies groups of things—which can be anything from songs to test items—that seem to have something in common. The property that ties these things together is called a factor (Cattell, 1952).
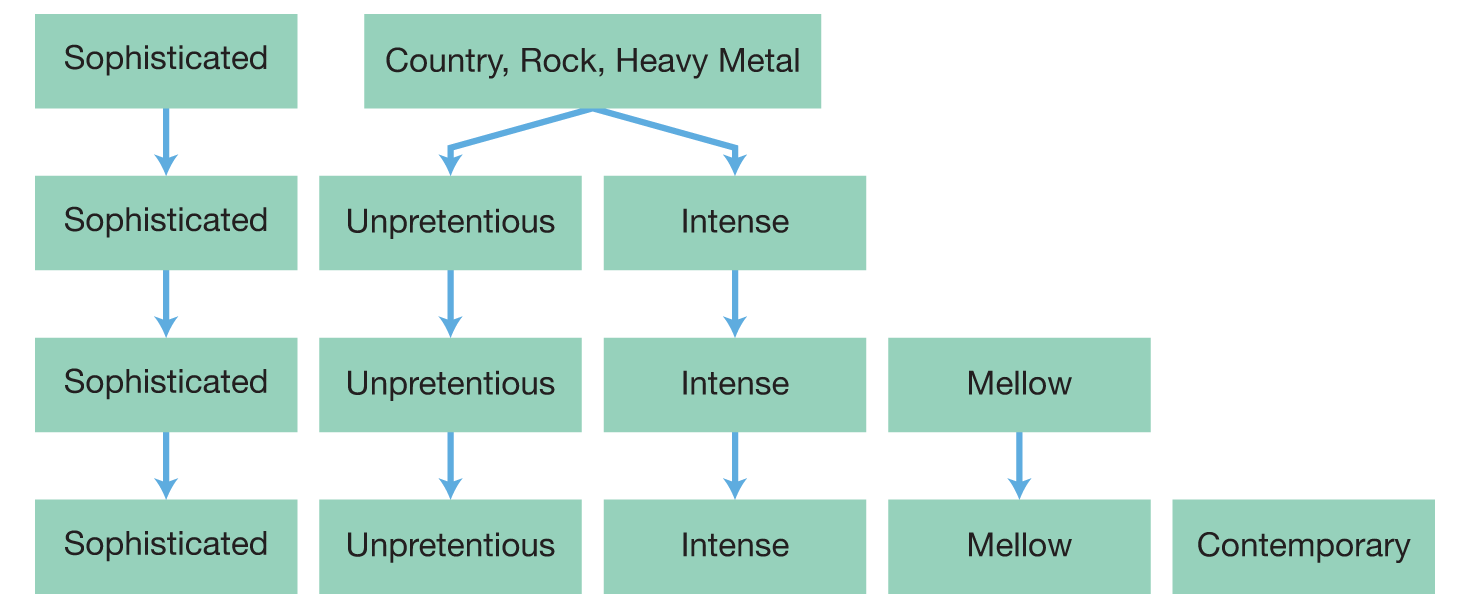
Figure 3.3A Factor Analysis of Musical Preference Participants rated their preferences for 52 musical clips, and factor analysis revealed that, to a large extent, these preferences were accounted for by five factors listed at the bottom of the figure. The figure also shows that the “unpretentious” and “intense” properties of music characterize the broader description of “country, rock, and heavy metal,” and that the “mellow” and “contemporary” factors account for smaller ranges of musical preference. In this display, the width of the boxes reflects the “factor size,” or the relative importance of that factor in overall music preference. Source: Rentfrow, Goldberg & Levitin (2011), p. 1144.
If you like Farrend’s Piano Quintet no. 1 in A Minor, you will probably enjoy “The Way You Look Tonight” by Oscar Peterson, but you won’t like “Texas Tornado” by Tracy Lawrence.
One study used factor analysis to study music preference, by asking people to identify pieces that they did and didn’t enjoy. The study found that such preferences can be organized in terms of five properties that the researchers labeled “mellow,” “unpretentious,” “sophisticated,” “intense,” and “contemporary”11 (Rentfrow, Goldberg, & Levitin, 2011). So, for example, if you like Farrend’s “Piano Quintet no. 1 in A Minor,” it turns out that you will probably also enjoy “The Way You Look Tonight” by Oscar Peterson, because both get high scores on the mellow factor. But you probably won’t like “Texas Tornado” by Tracy Lawrence, because it has a negative score on that factor; instead, it gets a high score, or “loads,” on the second, unpretentious factor.
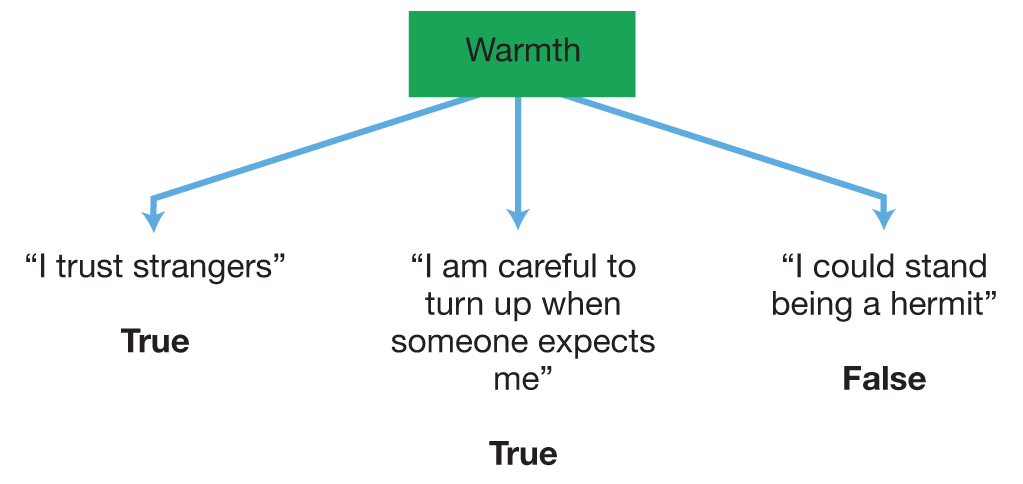
To use factor analysis to construct a personality test, researchers begin with a list of objective items of the sort discussed earlier. The next step is to administer these items to a large number of participants. Then you and your computer can sit down together and do the factor analysis. The analysis is based on calculating correlation coefficients between each item and each of the other items. The items that correlate most highly with each other can be assembled into groups. For example, if a person answers True to the item “I trust strangers,” you will find that he is also likely to answer True to “I am careful to turn up when someone expects me” and answer False to “I could stand being a hermit.” Such a pattern of likelihood, or co-occurrence, means that these three items are correlated. The next steps are to consider what the items have in common, and then name the factor.
The three correlated items just listed, according to Cattell (1965), are related to the dimension “cool versus warm,” with a true-true-false pattern of responses indicating a “warm” personality (see Figure 3.4). (Cattell decided on this label simply by considering the content of the items, as you just did.) The factor represented by these items, therefore, is “warm-cool,” or, if you prefer to name it by just one pole, “warmth.” These three items now can be said to form a “warmth” scale. To measure this dimension in a new participant, you would administer these three items, as well as other items in your original list that correlated highly with them, and discard the rest of the thousands of items you started with.
Figure 3.4Three Questionnaire Items That Measure the Same Factor If these three items are correlated with each other—people who answer True to the first item tend to answer True to the second one and False to the third—they might all “load on,” or measure, a common psychological factor.
The Big Five traits are extraversion, neuroticism, conscientiousness, agreeableness, and openness.
Factor analysis has been used not only to construct tests, but also to decide how many fundamental traits exist—how many out of the thousands in the dictionary are truly essential. Various analysts have come up with different answers. Cattell (1957) thought there were 16. Eysenck (1976) concluded there are just 3. More recently, prominent psychologists such as Lewis Goldberg (1990), Robert R. McCrae, and Paul Costa (1987) settled on 5; this is the most widely accepted answer at present. These five traits—sometimes called the Big Five—are extraversion, neuroticism, conscientiousness, agreeableness, and openness (see Chapter 6).
THE EMPIRICAL METHOD The empirical strategy of test construction is an attempt to allow reality to speak for itself. In its pure form, the empirical approach has sometimes been called “dust bowl empiricism.” The term refers to the origin of the technique at Midwestern universities (notably Minnesota and Iowa) during the Depression, or dust bowl, years of the 1930s.12 Intentionally or not, the term also serves as a reminder of how dry this approach is, since it is based strictly on data, not any kind of deeper psychological theory.
“Give me a hug. I can tell a lot about a man by the way he hugs.”
Like the factor analytic approach described earlier, the first step of the empirical approach is to gather lots of items. The second step, however, is quite different. For this step, you need to have a sample of participants who have already independently been divided into the groups you are interested in. Occupational groups and diagnostic categories are often used for this purpose. For example, if you wish to measure the aspect of people that makes them good and happy religious ministers, then you need at least two groups of participants—happy, successful ministers and a comparison group. (Ideally, the comparison group would be miserable, incompetent ministers, but typically the researcher will settle for people who are not ministers at all.) Or you might want a test to detect different kinds of psychopathology. For this purpose, you would need groups of people who have been diagnosed as suffering from schizophrenia, depression, hysteria, and so forth. A group of normal people—if you can find them—would also be useful for comparison purposes. Whatever groups you wish to include, their members must be identified before you develop your test.
Then you are ready for the third step: administering your test to your participants.
The fourth step is to compare the answers given by the different groups. If people diagnosed with depression answer a certain group of questions differently from everybody else, those items might form a “depression” scale. Thereafter, new participants who answer questions the same way as people diagnosed with depression did would score high on this scale, and you might suspect that they, too, are depressed. The MMPI, which is the prototypical example of the empirical method of test construction, was built using this strategy. For instance, one item on the depression scale is “I sometimes tease animals,” keyed False. This does not mean people who deny teasing animals are depressed! But this answer, on this test, does elevate one’s depression score. Or, if successful ministers answer some items in a distinctive way, these items might be combined into a “minister” scale. New participants who score high on this scale, because they answer the way successful ministers do, might be guided to become ministers themselves. The items for the SVIB were selected this way. For example, the percentage of men who reported that they liked “making a speech” was higher for ministers than other groups such as farmers and factory workers, so the item went on the “minister” scale.
This principle can even be used at the individual level. The developers of the MMPI published an atlas, or casebook, of hundreds of individuals who took the test over the years (Hathaway & Meehl, 1951). For each case, the atlas gives the person’s scoring pattern and describes his clinical case history. The idea is that a clinical psychologist confronted with a new client can ask the client to take the MMPI, and then look up those individuals in the atlas who scored similarly in the past.
After the items are selected based on the responses of people in the initial groups, the next step is to cross-validate that scale by using it to predict behavior, diagnosis, or category membership in new samples of participants. If the cross- validation succeeds, the scale is deemed ready for use.
COMBINATION OF METHODS A surprisingly large number of investigators still use a pure form of the rational method: They ask their participants the questions that seem relevant and hope for the best. The factor analytic approach still has a few adherents. Pure applications of the empirical approach are rare today. The best modern test developers use a combination of all three approaches.
The best way to select items for a personality scale is not haphazardly, but with the intent to sample a particular domain of interest (the rational approach). Factor analysis should then be used to confirm that items that seem similar to each other actually elicit similar responses from real participants (Briggs & Cheek, 1986). Finally, any personality measure is only as good as the other things with which it correlates or that it can predict (the empirical approach). To be worth its salt, any personality scale must show that it can predict what people do, how they are seen by others, and how they fare in life.
A personality test that consists of a list of questions to be answered by the subject as True or False, Yes or No, or along a numeric scale (e.g., 1 to 7).
A statistical technique for finding clusters of related traits, tests, or items.
Notes
1. By a tradition of mysterious origin, nearly all personality tests are referred to by their initials, all capital letters, no periods.
2. When the test was first introduced, NEO stood for Neuroticism, Extraversion, and Openness. Later versions added Agreeableness and Conscientiousness, but it wasn’t renamed OCEAN even though it could (and maybe should) have been (John, 1990).
3. According to legend, Rorschach made many blots in this way but kept only the “best” ones. I’ve always wondered how he decided which ones they were.
4. This use of projective tests has produced a backlash among people who feel they have been victimized by them. Test stimuli such as inkblots and TAT pictures, which in the past were closely held secrets, are now available on several websites that also offer advice on the best responses.
5. In case you are curious, the top three are (1) the Wechsler Intelligence Scale for adults, (2) the MMPI, and (3) the Wechsler Intelligence Scale for children (Camara et al., 2000).
6. The main points the authors of this review intended to make were that the validity of the MMPI is even higher (the parallel r= .55 in their analysis), and that, since the MMPI is much cheaper to administer, it should be used instead. At the same time, and perhaps unintentionally, they also provided the most convincing evidence I have seen that the Rorschach does have some degree of validity.
7. The MMPI was found to be better for predicting psychiatric diagnoses and self-report scores. If you want to see the argument that broke out over these findings, compare the paper by Garb, Wood, Nezworski, Grove, and Stejskal (2001) with the response by Rosenthal, Hiller, Bornstein, Berry, and Brunell-Neuleib (2001). As you can see, many people jumped into the fray.
8. Another item from the “commonality” scale reads, “Education is more important than most people think.” Almost everybody answers True.
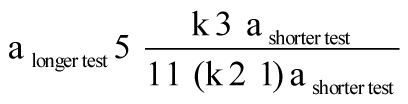
9. Here is some more specific information for the statistically inclined. The reliability of a test is measured in terms of Cronbach’s alpha according to the following formula: If n is the number of items in the test, and p is the average correlation among all of the items, then the reliability (alpha, or α) =np / [1 +p(n– 1)] (Cronbach, 1951). The Spearman-Brown formula, just mentioned, predicts the increase in reliability you get when you add equivalent items to a test (W. Brown, 1910; Spearman, 1910). If k=n1/n2, the fraction by which the number of items is increased, then the reliability of the longer test is estimated by
In both formulas, alpha is the predicted correlation between a score on your test and a score on another test of equivalent content and length. Correlation coefficients are explained in detail later in this chapter.
10. On the other hand, given how inexpensive it was to administer the WPDS and how expensive it could be to add just one mentally ill person to an armed combat unit, the WPDS may well have been cost-effective.
11. If you want to remember these factors, notice that their initials spell MUSIC.
12. A severe drought and resulting “dust bowl” afflicted several midwestern states during that period. However, Minnesota and Iowa were not among them.