QUALITY OF DATA: PSYCHOMETRICS
More information
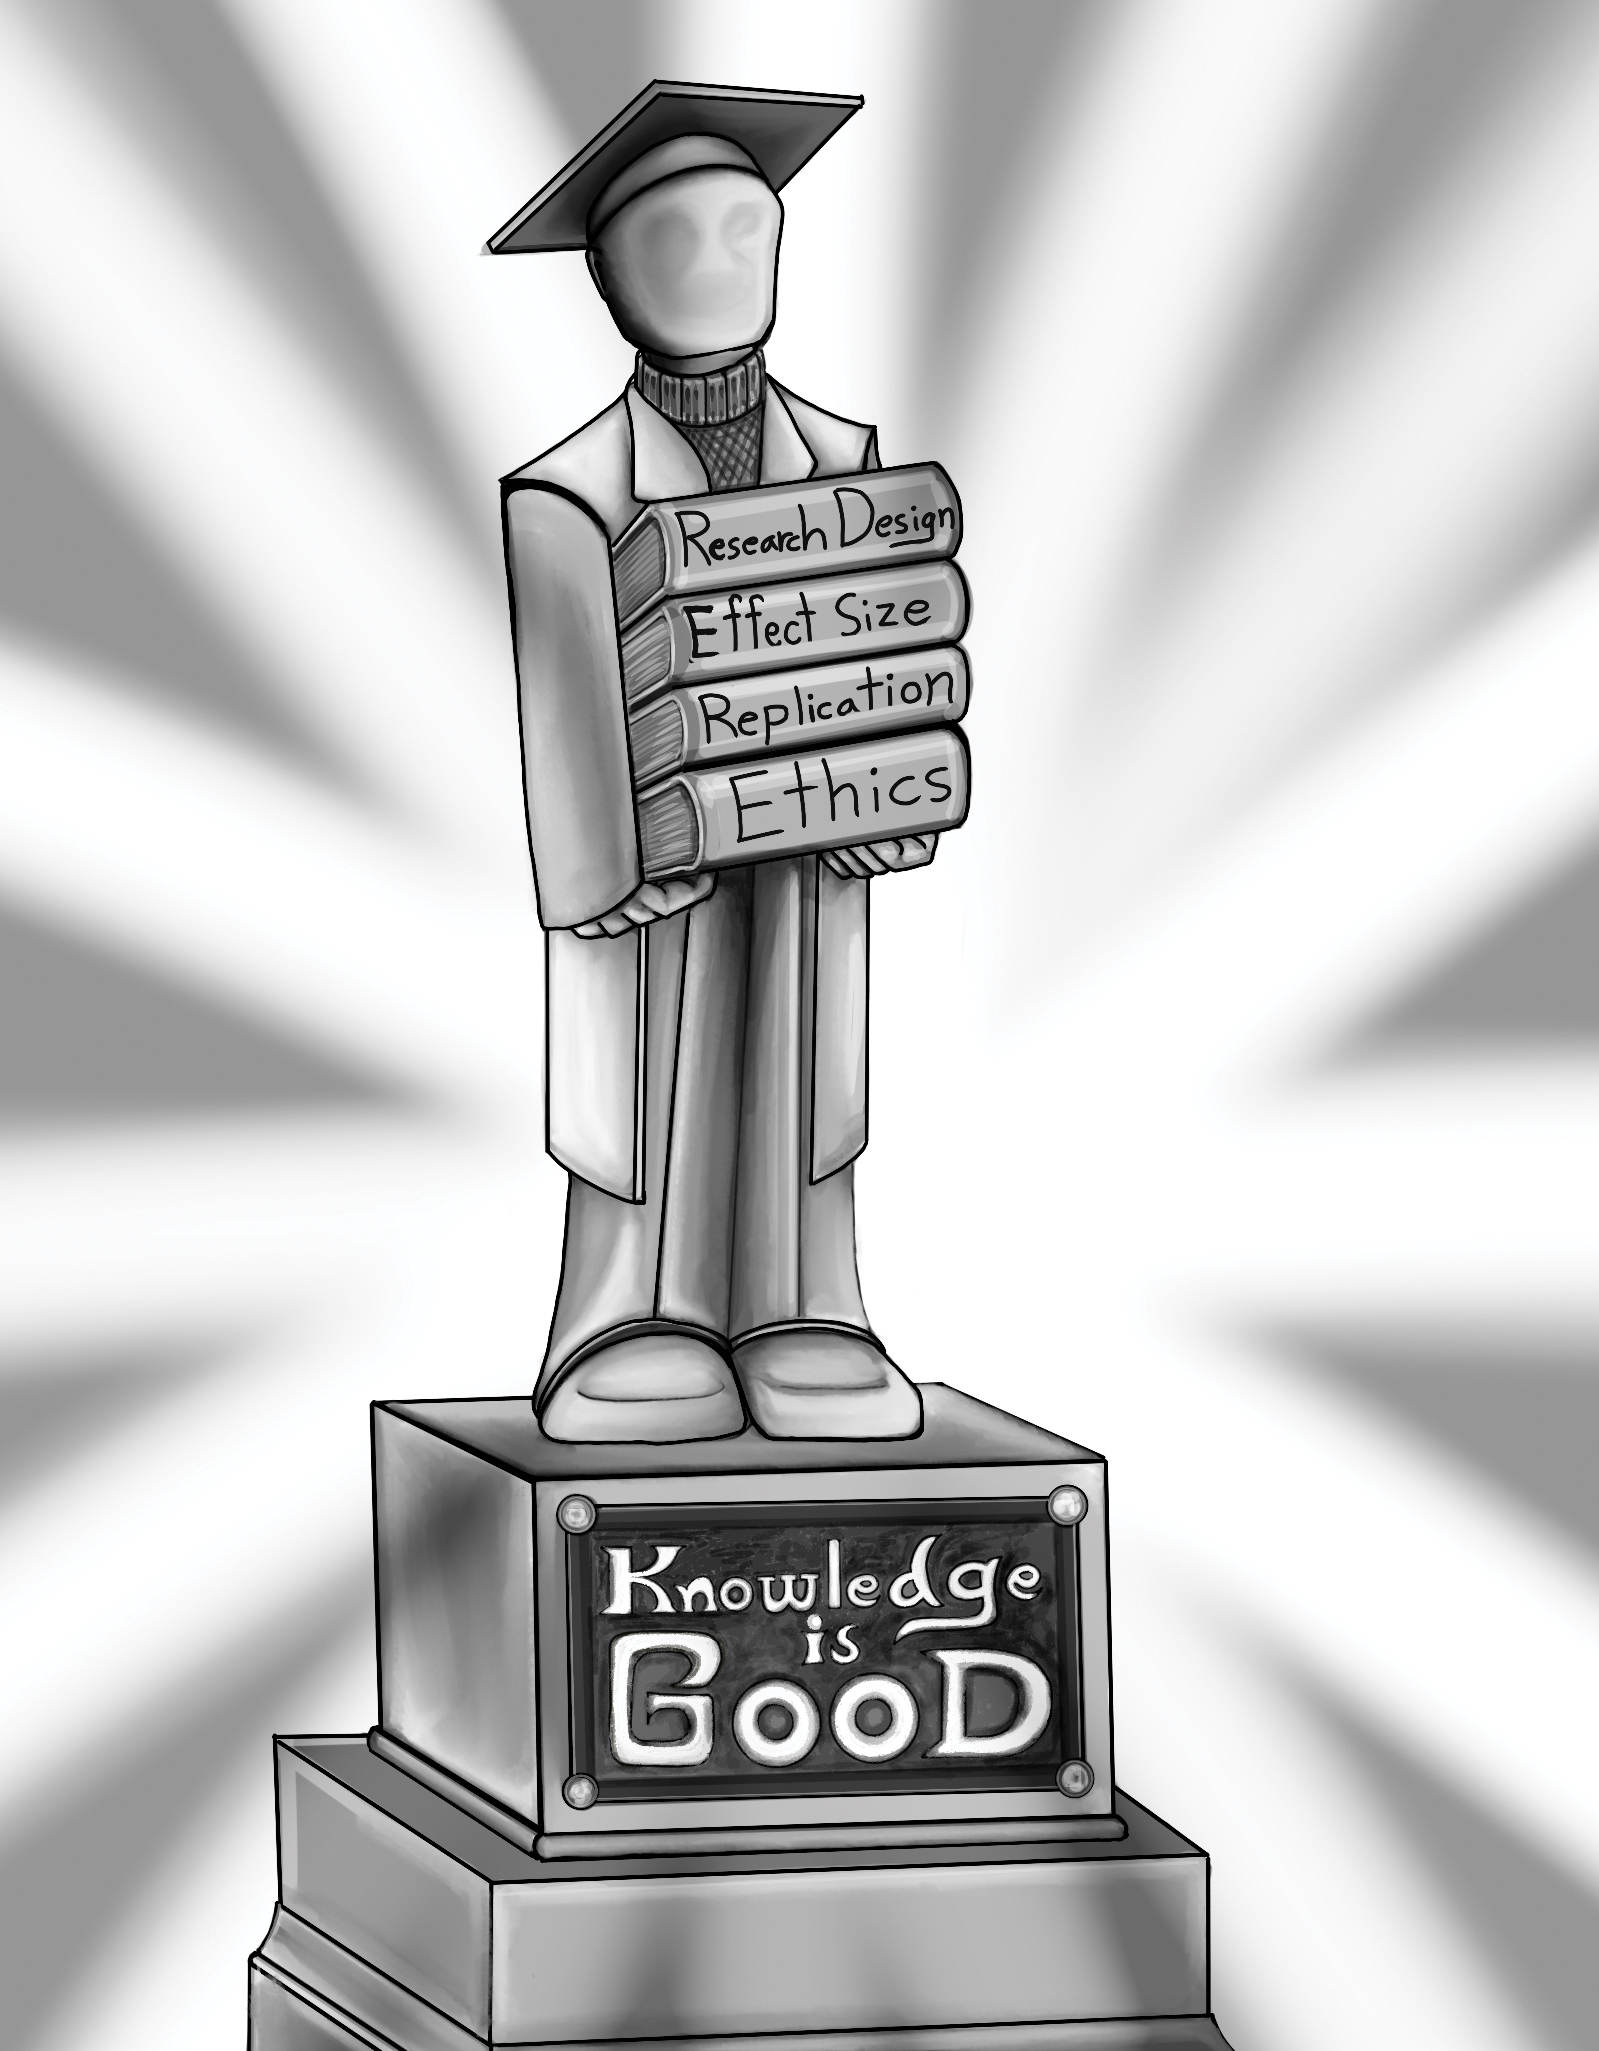
A black and white illustration shows a faceless figure of a graduate holding a stack of books. The books are titled, “research design,” “effect size,” “replication,” and “ethics.” The base on which the figure stands reads “knowledge is good.”
Alice Waters, owner of the Chez Panisse restaurant in Berkeley, California, is famous for her passion about ingredients. She insists on knowing everybody who supplies her fruits, vegetables, and meats and visits their farms and ranches. If the ingredients are good, she believes, superb cooking is possible, but if they are bad, you have failed before you started. The ingredients of research are data and, just like in a kitchen, if the ingredients are bad the final product can be no better. In Chapter 2 we looked at four basic types of data for personality research: S-, I-, L-, and B-data. For each of these—and, indeed, for any type of data in any field—the field of psychometrics regards two questions as paramount: (1) Are the data reliable? (2) Are the data valid? These two questions can be combined into a third question: (3) Are the data generalizable?
Reliability
In psychometrics, the term reliability has a technical meaning that is narrower than its everyday usage and may be misleading. The everyday meaning refers to someone or something that is dependable, such as a person who always shows up on time or a car that never breaks down. Reliable data are sort of like that, but not exactly. The hallmark of reliability, in a psychometric sense, is consistency. For example, a reliable personality test is one that gives close to the same result every time the person takes it. If the scores for a particular individual fluctuate from day to day, then the test is probably overly affected by extraneous influences (such as time of day, passing moods, or trivial events) that create measurement error (also called error variance). The less there is of such error, the more reliable the measurement.
Influences that are considered extraneous depend on what is being measured. If you are trying to measure someone’s mood, which is a current and presumably temporary state, then the fact that the person just won the lottery is not extraneous at all. But if you are trying to measure the person’s usual, or trait, level of emotion, then this sudden event is extraneous, the measurement will be misleading, and you might choose to wait for a more ordinary day to administer your emotion questionnaire.
A self-report might be unreliable simply because the person who provided it was careless. Self-report scales can be long and tedious, and not everybody answers carefully or pays attention. One study found that people who give unreliable S-data because they aren’t paying attention are rated by their acquaintances as unconscientious, disagreeable, and introverted, and they also have a lower GPA and a greater number of class absences than average (Bowling et al., 2016).
Reliability is something that can and should be assessed with any measurement, whether it be a personality test, a thermometer reading, a blood-cell count, or the output of a brain scan (Vul et al., 2009). For example, the medical community is well aware that “white-coat hypertension” can cause someone’s blood pressure to read higher in the doctor’s office than at home. This fact, if not appreciated, can lead to inappropriate diagnoses and treatment.
Every measurement includes a certain amount of error. No instrument or technique is perfect, and in psychology at least four factors can undermine reliability. First is low precision. Measurements should be taken as exactly as possible and as carefully as possible. Second, like the patient with white-coat hypertension, the state of the participant might vary for reasons that have nothing to do with what is being studied. Some show up ill, some well; some are happy and others are sad; many college student participants are amazingly short on sleep. A third potential pitfall is the state of the experimenter. One would hope that experimenters would come to the lab well rested and attentive, but this is not always the case. Variation due to the experimenter is almost as inevitable as variation due to the participants; experimenters try to treat all participants the same but, being human, will fail to some extent. Moreover, participants may respond differently to an experimenter, depending on the experimenter’s gender, race, or even wardrobe. The famous psychologist B. F. Skinner got around this problem by studying his subjects—namely, rats and pigeons—within a mechanically controlled enclosure, the Skinner box. For research with humans, we usually need participants to interact with other humans, including research assistants.
Every measurement includes a certain amount of error.
A final potential pitfall can come from the environment. Experienced researchers often have stories that never make it into their reports, involving fire alarms (even sprinklers) that go off in the middle of experiments, noisy arguments that suddenly break out next door, laboratory thermostats gone berserk, and so forth. Events like these are relatively unusual, fortunately, and when they happen, all one can usually do is cancel the study for the day, throw the data out, and hope for better luck tomorrow. But minor variations in the environment are constant and inevitable; noise levels, temperature, the weather, and a million other factors vary constantly and provide other potential sources of data unreliability.
At least four things can be done to try to enhance reliability (Table 3.1). One, obviously, is just to be careful. Double-check all measurements, have someone proofread (more than once!) the data-entry sheets, and make sure the procedures for scoring data are clearly understood by everyone. A second way to improve reliability is to use a constant, scripted procedure.
Table 3.1 RELIABILITY OF PSYCHOLOGICAL MEASUREMENT
|
Factors That Undermine Reliability |
Low precision State of the participant State of the experimenter Variation in the environment |
|
Techniques to Improve Reliability |
Care with research procedure Standardized research protocol Measure something important Aggregation |
A third way to enhance reliability is to measure something that is important rather than trivial. For example, an attitude about an issue that matters to someone is easier to measure reliably than if the person doesn’t really care (What’s your opinion on lumber tariffs?). Measurement of broad personality traits (e.g., the degree of a person’s extraversion) will be more reliable than single behaviors (e.g., whether the person is chatting with someone at 1:10 P.M. on a given Saturday).

More information
A cartoon shows a row of figures making various uses of meter sticks.
The fourth and by far the most useful way to enhance the reliability of measurement in any domain is aggregation, or averaging. When I was in high school, a science teacher who I now believe was brilliant (I failed to be impressed at the time) provided the class with the best demonstration of aggregation that I have ever seen. He gave each of us a piece of wood cut to the length of 1 meter. We then went outside and measured the distance to the elementary school down the street, about a kilometer (1,000 meters) away. We did this by laying our stick down, then laying it down again, and counting how many times we had to do this before we reached the other school.
In each class, the counts varied widely—from about 750 meters to over 1,200 meters, as I recall. The next day, the teacher wrote all the different results on the blackboard. It seemed that the elementary school just would not hold still! To put this observation another way, our individual measurements were unreliable. It was hard to keep lying the meter stick down over and over again with precision, and it was also hard not to lose count.
But then the teacher did an amazing thing. He took the 35 measurements from the 9:00 A.M. class and averaged them. He got 957 meters. Then he averaged the 35 measurements from the 10:00 A.M. class. He got 959 meters. The 35 measurements from the 11:00 A.M. class averaged 956 meters. As if by magic, the error variance had almost disappeared, and we suddenly had what looked like a stable estimate of how far away the other school was.
What happened? The teacher took advantage of the power of aggregation. Each of the mistakes we made in laying our meter sticks down and losing count was essentially random. And over the long haul, random influences tend to cancel one another out. (Random influences, by definition, sum to zero—if they didn’t, they wouldn’t be random!) While some of us may have been laying our sticks too close together, others were surely laying them too far apart, and overcounting was as common as undercounting. When everything was averaged, the errors almost completely cancelled each other out.

More information
A photo shows a broken and shattered analog clock on asphalt.
For this reason, one time-honored way to make a personality test more reliable is simply to make it longer, and some tests (such as the MMPI, mentioned in Chapter 2) have literally hundreds of items. If you add items that measure the trait in question as accurately as the existing items do—something easier said than done, frankly—then the improvement in reliability can be estimated using the Spearman-Brown formula.2 But participants’ time is limited, as is their attention span. A psychologist has to evaluate the trade-offs between making a test longer and (in principle) more reliable, and the burden on participants who at some point might (understandably) decide the test is just too long and quit paying attention or even walk away.
Validity
Validity is the degree to which a measurement actually measures what it is supposed to. The concept is slippery for a couple of reasons.
One reason is that, for a measure to be valid, it must be reliable. But a reliable measure is not necessarily valid. Should I say this again? A measure that is reliable gives the same answer time after time. If the answer is always changing, how can it be the right answer? But even if a measure does give consistent results, that does not necessarily mean it is correct. Maybe it reliably gives the wrong answer (like the clock in my old Toyota, which was correct only twice each day).
A second and even more difficult complication in the idea of validity is that it seems to invoke a notion of ultimate truth. On the one hand, you have ultimate, true reality. On the other hand, you have a measurement. If the measurement matches ultimate, true reality, it is valid. Thus, an IQ measure is valid if it really measures intelligence. A sociability score is valid if it really measures sociability (Borsboom et al., 2004). But here is the problem: How does anyone know what intelligence or sociability “really” is?
For a measure to be valid, it must be reliable. But a reliable measure is not necessarily valid. Should I say this again?
Many years ago, methodologists Lee Cronbach and Paul Meehl (1955) proposed that attributes like intelligence or sociability are best thought of as constructs.3 A construct is something that cannot be directly seen or touched but affects and helps to explain things that are visible. A common example is gravity. Nobody has ever seen or touched gravity, but we know it exists from its effects, which range from causing apples to fall on people’s heads to keeping planets in their proper astronomical paths. Nobody has ever seen or touched intelligence either, but it affects many aspects of behavior and performance, including test scores and achievement in real life (G. Park et al., 2007). This range of implications is what makes intelligence important. An old-time psychologist once said, “Intelligence can be defined as what IQ tests measure.” He was wrong.
Personality constructs are the same as gravity or IQ, in this sense. They cannot be seen directly and are known only through their effects. And their importance stems from their implications. For example, the invisible construct of “sociability” becomes visible through behaviors such as going to parties, smiling at strangers, and posting frequently on social media. And the construct implies that these behaviors, and more, should tend to be associated with each other, that is, that somebody who does one of them probably does the others as well. This is because they all are hypothesized to be caused by the same trait (Borsboom et al., 2004).
However, this hypothesis must be tested through a process called construct validation (Cronbach & Meehl, 1955). For example, you might give participants a sociability test, ask their acquaintances how sociable they are, and count the number of social media entries they post and parties they go to in a week. If these four measures are related—that is, if they all tend to pick out the same individuals as being highly sociable—then you might start to believe that each of them has some degree of validity as a measure of sociability. At the same time, you would become more confident that the overarching construct makes sense and that sociability is useful for predicting and explaining behavior. Even though you never reach ultimate truth, you can start to reasonably believe you are measuring something real when you can develop a group of different measurements that yield more or less the same result.
Generalizability
Traditional treatments of psychometrics regarded reliability and validity as distinct. When two measures that were supposed to be “the same” were compared, the degree to which they yielded the same result indicated their reliability. But if the two measures were different, then their relationship would indicate the first (or perhaps the second) measure’s degree of validity. For example, if one’s score on a friendliness test is pretty much the same as one’s score on the same test a month later, this would indicate the test’s reliability. But if it also can be used to predict the number of one’s social media contacts, then this fact would indicate the test’s validity. Or, alternatively, it could be taken to mean that the number of social media contacts is a valid measure of friendliness. So, you see that the idea of validity is a bit fuzzy, as is the distinction between measures that should be considered “the same” or “different.”
A more sophisticated view sees reliability and validity as aspects of a single, broader concept called generalizability (Cronbach et al., 1972). It is also important to consider to what else the measurement or the experimental result generalizes. That is, is the result you get with one test largely equivalent to the result you would get using a different test? Does your result also apply to other kinds of people than the ones you have assessed, or does it apply to the same people at other times, or would the same result be found at different times, in different places? All of these questions consider facets of generalizability.
GENERALIZABILITY OVER PARTICIPANTS
One important facet is generalizability over participants. Most psychological research is done by university professors, and most participants are college students.4 (Not surprisingly, there tend to be a lot of students in the vicinity of professors, and gathering data from anybody else, such as randomly selected members of the community, is more difficult and expensive.) But college students are not very good representatives of the broader population (Bryant, 2021). They are, on average, more affluent, more liberal, healthier, younger, and less ethnically diverse than the wider population. These facts can make you wonder whether research resulting from studies with college students will prove to be true about the national population, let alone the world (Henrich et al., 2010).
Gender Bias
An even more egregious example is that until well into the 1960s, it was routine for American psychological researchers to gather data only from men, and this practice included classic studies such as those by Henry Murray (1938) and Gordon Allport (1937). I once had a conversation with someone who was a major contributor to personality research during the 1940s and 1950s; he admitted frankly that he was embarrassed to have studied only men. “It is hard to recall why we did that,” he told me in 1986. “As best I can remember, it simply never occurred to any of us to include women.”
Since then, the problem may have reversed. There is one particular fact about recruiting participants, rarely mentioned in methods textbooks, that researchers know from experience: Women are more likely than men to sign up for experiments, and once signed up they are more likely to appear at the scheduled time. The difference is not small. From my desk in the psychology department, I used to look directly across the hallway at a sign-up sheet for my research project, which used paid volunteer participants.5 Because my work needed an exactly equal number of men and women, the sign-up sheet had two separate columns. At any hour of any day, there would be more than twice as many names in the “women” column as in the “men” column, sometimes up to five times as many.
This phenomenon raises a couple of issues. One is theoretical: Why is there this difference? One hypothesis could be that college-age women are generally more conscientious and cooperative than men in that age range (which I believe is true), or the difference might go deeper than that. A second issue is that this difference raises a worry about the participants that researchers recruit. It is not so much that samples are unbalanced. Researchers can keep them balanced; in my lab, I simply call all of the men who sign up and about one in three of the women. Rather, the problem is that because men are less likely to volunteer than women, the men in the studies are, by definition, unusual. They are the kind of men who are willing to be in a psychological experiment. Most men aren’t, yet researchers generalize from the relatively few men in their studies to men in general.6
Yet a third issue is that psychologists are beginning to realize that the traditional questionnaire instruction to “check one, male/female” is rigid and simplistic.7 It forces people into a dichotomy that fails to realize the many varieties of genderqueer identities (Nestle et al., 2002). Studies that simply divide participants into two groups, which is still the almost universal practice, miss important nuances associated with gender identity, raising questions about the generalizability of their results.
Economic, Ethnic, and Cultural Diversity
As mentioned previously, most psychological research is based on college students, yet most Americans never get a college degree (about 58 percent, as of 2019). The overwhelming majority of college graduates are White (more than 65 percent) and are relatively likely to be from prosperous families. People of color are underrepresented in psychological research, as are people with disabilities and people who live in remote locations. The more you think about it, the more obvious it is that only a small fraction of society is included in most American psychological research.

More information
A photo shows a headshot of Moin Syed.
The issue of inclusion goes beyond national borders. The Canadian psychologist Joseph Henrich and his colleagues argue that many conclusions in psychological research are too heavily based on participants from “WEIRD” countries that are Western, Educated, Industrialized, Rich, and Democratic (Henrich et al., 2010). The largest part of the research literature is based on participants from the United States, and other leading contributors include Canada, Britain, Germany, Sweden, Australia, and New Zealand—all of which are WEIRD by Henrich’s definition. This is a problem because Henrich presents evidence that people from countries like those just mentioned are different than people from poor, uneducated, preindustrial, autocratic, and Eastern countries8 on psychological variables ranging from visual perception to moral reasoning.
Going further, the psychologist Moin Syed (Figure 3.2) has pointed out some problems with the famous acronym itself. He commented that it’s a bit suspicious that the five critical dimensions of culture just happen to spell out WEIRD, and squeezing them into this acronym, as clever as it is, may have led other important dimensions to be left out (Syed, 2021). One dimension missing—remarkably, when you think about it—is race. Religion is also missing, and the “democratic” dimension is misleading because many Asian countries (such as Japan) are democratic, and several European countries are not. Still, the acronym has done a remarkably good job in helping psychologists realize how weird (not in all caps) their samples of participants too often are.
Glossary
- psychometrics
- The technology of psychological measurement.
- reliability
- In measurement, the tendency of an instrument to provide the same comparative information on repeated occasions.
- measurement error
- The variation of a number around its true mean due to uncontrolled, essentially random influences; also called error variance.
- state
- A temporary psychological event, such as an emotion, thought, or perception.
- trait
- A relatively stable and long-lasting attribute of personality.
- aggregation
- The combining together of different measurements, such as by averaging them.
- Spearman-Brown formula
- In psychometrics, a mathematical formula that predicts the degree to which the reliability of a test can be improved by adding more items.
- validity
- The degree to which a measurement actually reflects what it is intended to measure.
- construct
- An idea about a psychological attribute that goes beyond what might be assessed through any particular method of assessment.
- construct validation
- The strategy of establishing the validity of a measure by comparing it with a wide range of other measures.
- generalizability
- The degree to which a measurement can be found under diverse circumstances, such as time, context, participant population, and so on. In modern psychometrics, this term includes both reliability and validity.
Endnotes
-
Here is some more specific information for the statistically inclined. The reliability of a test is measured in terms of Cronbach’s alpha according to the following formula: If n is the number of items in the test, and p is the average correlation among all of the items, then the reliability (alpha, or α) = np / [1 +p(n – 1)] (Cronbach, 1951). The Spearman-Brown formula, just mentioned, predicts the increase in reliability you get when you add equivalent items to a test (W. Brown, 1910; Spearman, 1910). If k = n1/n2, the fraction by which the number of items is increased, then the reliability of the longer test is estimated byReturn to reference 2

In both formulas, alpha is the predicted correlation between a score on your test and a score on another test of equivalent content and length. Correlation coefficients are explained in detail later in this chapter.
- Sometimes the term hypothetical construct is used to underline that existence of the attribute is not known for certain but instead is hypothesized.Return to reference 3
- This is true of nearly all of my own research. Mea culpa.Return to reference 4
- Now, of course, recruitment is done over the Internet.Return to reference 5
- It was once suggested to me, quite seriously, that I could remedy this imbalance simply by paying men twice as much as women. Does this seem like a good idea?Return to reference 6
- It also conflates biological sex (male/female) with gender identity (man/woman).Return to reference 7
- I suppose we could call these “PUPAE” countries, but I doubt the label will stick.Return to reference 8