AN OVERVIEW OF RESEARCH METHODS
While theories make hypothetical claims, methods produce data that will support, disprove, or modify those claims. Sociologists who do quantitative research work with numerical data; that is, they translate the social world into numbers that can then be manipulated mathematically as they attempt to identify patterns and relationships among variables. Any type of social statistic is an example of quantitative data: You may have read in the news, for instance, that in 2020 some 33 percent of male drivers involved in fatal motor vehicle crashes had a blood alcohol content at or above 0.08 percent, compared with 23 percent of female drivers (Insurance Institute for Highway Safety 2022). Quantitative methodologies distill large amounts of information into numbers that are more easily communicated to others, often in the form of rates and percentages or charts and graphs.

More information
He carries a bag with “U.S. Census Bureau” written on it and holds a smartphone in front of him.
Sociologists who do qualitative research work with nonnumerical data such as texts, written field notes, interview transcripts, videos, or photographs. Rather than condensing lived experience into numbers, qualitative researchers try to describe the cases they study in great detail. Researchers who do qualitative work attempt to tease out the meanings that animate our lived experiences, often using their research to develop new theories. They may engage in participant observation, in which they enter the social world they wish to study, or they may do in-depth interviews; analyze transcripts of conversations; glean data from historical books, letters, or diaries; and even use social networking sites or text messages as sources of data for their investigations. Ethnographers, for example, have studied myriad social worlds and their distinctive denizens, including long-haul truck drivers (Viscelli 2016), fashion models (Mears 2011), and low-income students at elite colleges (Jack 2019). They are able to discover important sociological insights by immersing themselves in each of the social worlds they study. Qualitative researchers like these find patterns in their data by using interpretive rather than statistical analysis: They focus on the meaning of the social world from the perspective of those they study.
The Scientific Approach
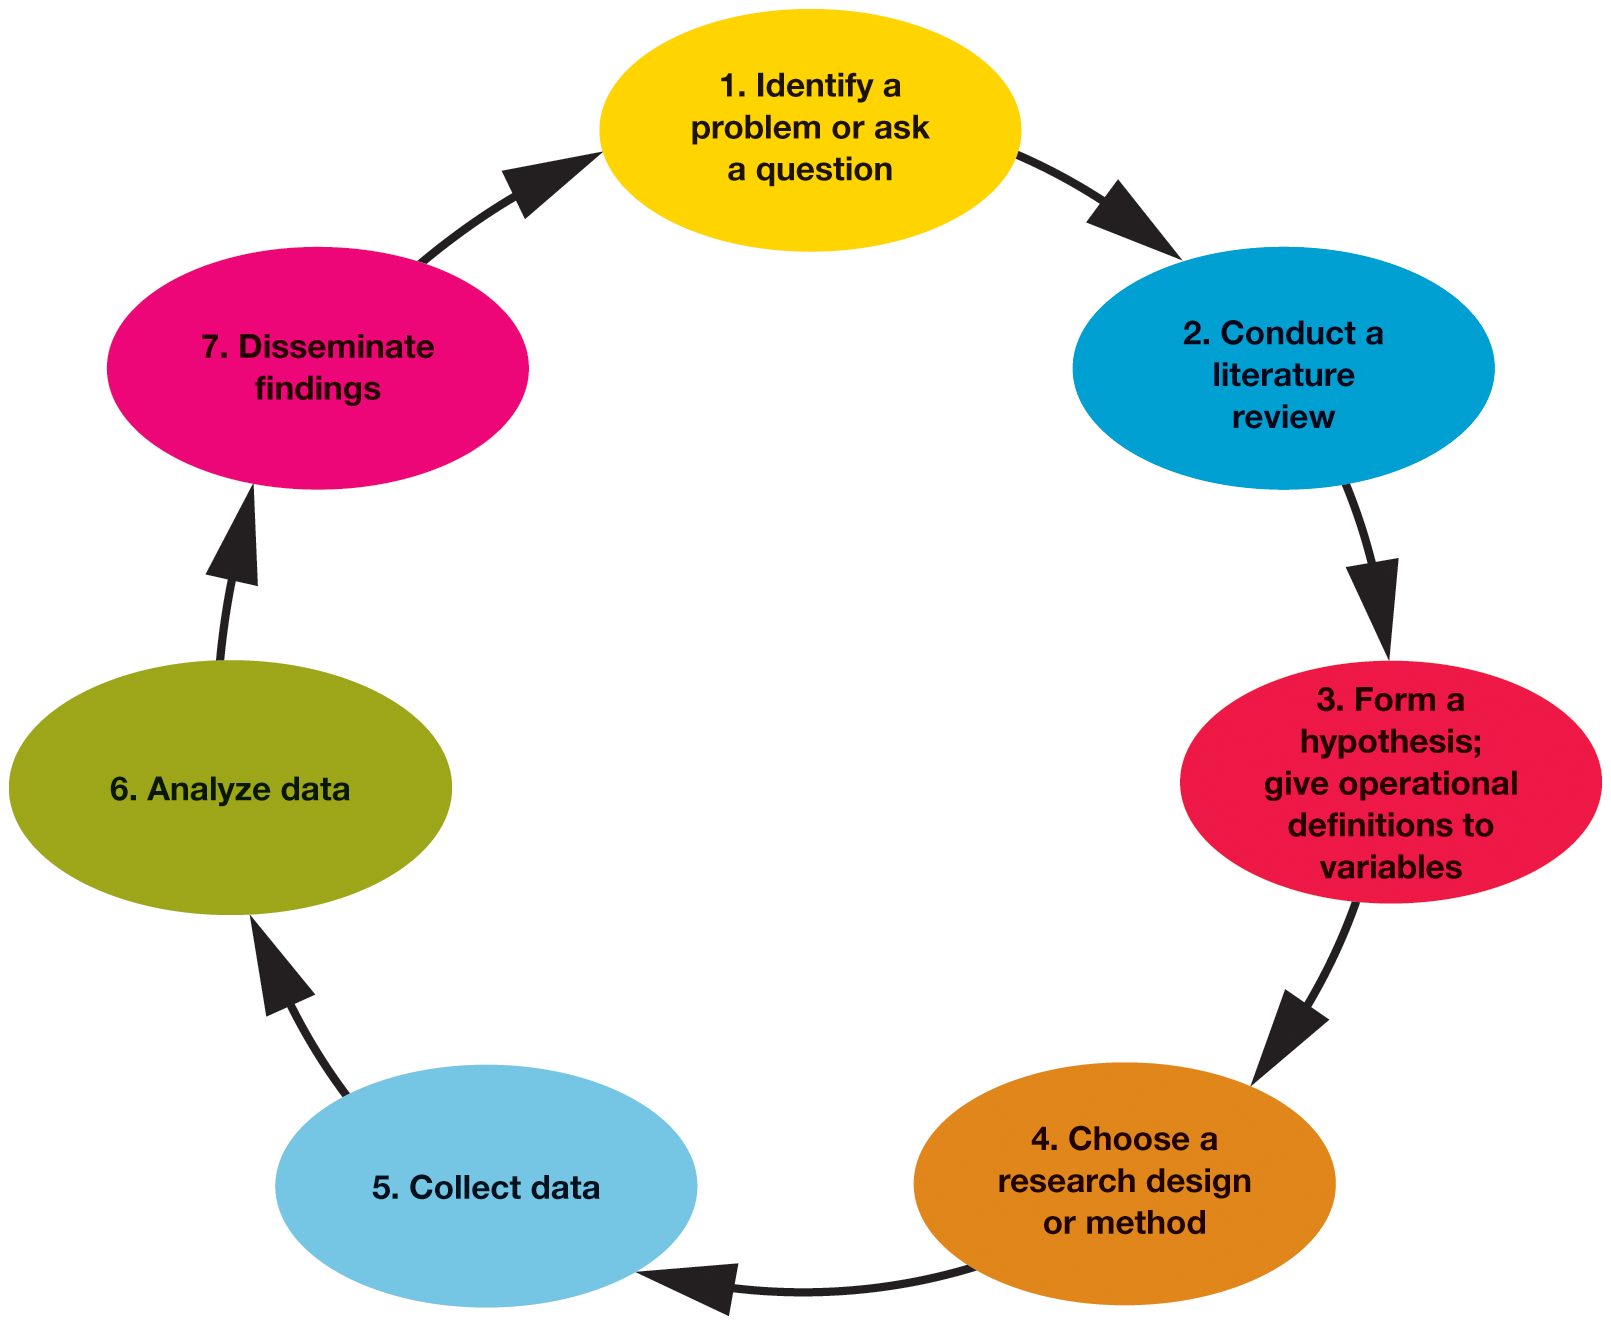
The scientific method is the standard procedure for acquiring and verifying empirical (concrete, scientific) knowledge, as well as building and testing a body of scientific theory that helps explain and predict different aspects of our world. The scientific method provides researchers with a series of basic steps to follow; over the years, sociologists have updated and modified this model so that it better fits the study of human behavior. Although not every sociologist adheres to each of the steps in order, the scientific method provides a general plan for conducting research in a systematic way (Figure 2.1).
More information
The flowchart displays a research process that most sociologists follow. The steps, starting from the top and moving clockwise, are as follows: Step 1, identify a problem or ask a question. Step 2, conduct a literature review. Step 3, form a hypothesis and give operational definitions to variables. Step 4, choose a research design or method. Step 5, collect data. Step 6, analyze data. Step 7, disseminate findings. As the chart is organized in a circle, step 7 points to step 1.
FIGURE 2.1 Steps of the Scientific Method
Although not all sociologists follow these seven steps in lock-step order, the scientific method provides a general overview of the research process.
- In the first step, the researcher identifies a problem or asks a general question, like “Does violent TV lead to violent behavior?” and begins to think about a specific research plan designed to answer that question.
- Before proceeding, however, a researcher usually does a literature review to become thoroughly familiar with all other research done previously on a given topic. Doing so will prevent a researcher from duplicating work that has already been done and may also provide the background upon which to conduct new research.
- Next, the researcher forms a hypothesis, a theoretical statement that they think will explain the relationship between two phenomena, which are known as variables. In the hypothesis “Watching violence on TV causes children to act violently in real life,” the two variables are “watching violence on TV” and “acting violently.” In short, the researcher is saying one variable has a causal connection to the other. The researcher can use the hypothesis to predict possible outcomes: “If watching violence on TV causes children to act violently in real life, then exposing five-year-olds to violent TV shows will make them more likely to hit the inflatable clown doll placed in the room with them.” The researcher must give a precise operational definition to the variables so that they can observe and measure them accurately and ensure that their readers have a clear understanding of just what is being measured. For example, there is a wide range of violence on television and in real life. Does “violence” include words as well as actions, a slap as well as murder? The operational definition will specify.
- In this step, the researcher chooses a research design or method to use to conduct their study. A classic example is to perform an experiment meant to isolate variables in order to best examine their relationship to one another. Sociologists use a range of methods and sometimes combine one or more methods. These will be discussed in greater depth later in the chapter.
- The researcher then collects the data. In this case, the researcher would conduct the experiment by first exposing kids to TV violence, then observing their behavior toward the clown doll. Data might be collected by using video equipment as well as by taking notes.
- Next, the researcher must analyze the data, evaluating the accuracy or inaccuracy of the hypothesis in predicting the outcome. In the real-life experiment on which this example is based, the children were more likely to hit the clown doll themselves if they saw the TV actors being rewarded for their violent behavior; if the actors were punished for their behavior, the children were less likely to hit the doll (Bandura 1965).
- The researcher then disseminates the findings of the experiment in the scientific community (often through presentations at professional meetings, through publications, or in the classroom) as well as in the general public.

More information
In the first and second pictures a young boy is hitting the doll with a hammer and then is kicking it. The third and fourth pictures depict a young girl doing the same thing.
Finally, all of this is repeated. An important feature of scientific results is replicability, the ability to repeat or replicate the research, either by the same researcher or by others who are interested in the same topic. While not all methods are equally replicable, this is still an important step for much scientific work.
It’s also important to note the difference between correlation and causation. If two variables change in conjunction with each other, or if a change in one seems to lead to a change in the other, they are correlated. Even if they are correlated, though, the change in one variable may not be caused by the change in the other variable. Instead, there may be some intervening variable that causes the changes in both. The classic example is the correlation between ice cream sales and rates of violent crime. As ice cream sales increase, so do rates of violent crime like murder and rape. Does ice cream consumption cause people to act violently? Or do violent actions cause people to buy ice cream? Turns out, it’s neither—this is what is known as a spurious correlation. Both ice cream sales and violent crime rates are influenced by a third variable: weather. As the temperature climbs, so do people’s rates of ice cream purchase and the likelihood that they’ll be involved in a violent crime (probably because they are outside for more hours of the day and hence available to one another in a way that makes violent crime possible). Knowing that correlation does not equal causation is important, as it can help us all be more critical consumers of scientific findings.
While the scientific method generally involves a deductive approach—researchers form a hypothesis first and then test to see whether it is accurate—some scientists, particularly those who do field-based research in disciplines such as biology, zoology, anthropology, and sociology, use an inductive approach. Scientists conducting inductive research begin with specific observations and then form broad theoretical generalizations from those observations. Both approaches, deductive and inductive, are systematic, scientific ways to link data with theory. It’s the order of the approach that changes: Researchers taking a deductive approach use theory to ask questions that they then answer by gathering data, whereas researchers taking an inductive approach gather data in order to build theory that explains the data.
We are constantly gathering data in order to understand what is true. Philosopher of science Thomas Kuhn, in fact, argued that truth is relative and dependent on the paradigm through which one sees the world (1962/1970). Paradigms are broad theoretical models about how things work in the social and natural worlds. For example, humans believed for centuries that the universe revolved around the earth. It’s easy to understand why. The available data, after all, seemed to support such a theory: We don’t feel the earth moving beneath us, and it appears from our vantage point that the stars, sun, and moon rise and set on our horizon. This earth-centered, or geocentric, view of the universe was the basis for all scientific theory until 1543, when the Polish astronomer Nicolaus Copernicus proposed that the earth revolved around the sun (Armitage 1951). Using mathematical methods, Copernicus arrived at a new theory, heliocentrism, in which the earth rotates around the sun and on its own axis—thereby accounting for the twenty-four-hour days as well as the four seasons of the year. This theory caused what Kuhn called a paradigm shift, a major break from the assumptions made by the previous model. Paradigm shifts occur when new data force new ways of looking at the world. And methods are what generate data.
Which Method to Use?
Since each sociological method has specific benefits and limitations, each is more appropriate for certain types of research. Thus, when a researcher begins a project, one of their most important decisions is which methods to use. Suppose, for example, a sociologist is interested in studying Woodstock, one of the major musical and cultural milestones of the 1960s. Although there are many ways to approach this event, our sociologist wants to study the attendees’ experiences. What was it really like to be at Woodstock? What did it mean to those who were there? What are their interpretations of this iconic moment in hippie culture?

More information
They are seen standing or walking around and chatting with one another.
During the event itself, the ideal method for studying the festivalgoers at Woodstock might have been to assemble a team of researchers trained in participant observation; that is, they would actually be in the thick of things, observing and participating at the same time. They could gather firsthand data on the music, clothes, dancing, drugs, “free love,” and so forth. However, the opportunity to be a participant observer of that particular cultural phenomenon has long since passed. What are some other options?
Interviews are a possibility. The researcher could ask Woodstock attendees to recount their experiences. But how would the researcher recruit them? Woodstock-goers live all over the world now, and it might be difficult (and expensive) to track down enough of them to make an interview study feasible. Another problem with interviewing this group: The three-day event happened more than fifty years ago. How would the passage of time affect their memories? How much detail could they actually remember about the experience after so long?
How about a survey? The researcher could certainly send a questionnaire through the mail or administer it online, and this method would be much less expensive than face-to-face interviews. But here the researcher runs into the same problem as with an interview study: How do they find all these folks? A standard tactic for recruiting survey participants involves placing an ad in a local newspaper. But an ad in the New York Times, for example, or even on a social media site like Facebook or Reddit, would draw only a limited number of Woodstock alumni. Also, some attendees might want to put that part of their lives behind them; others who receive the questionnaire in the mail might send it straight into the trash. Finally, the researcher might encounter the problem of impostors—people who say they were at Woodstock but were really nowhere near it.
What about using existing sources? Plenty has been written about Woodstock over the years. Many firsthand accounts have been published, and there is an abundance of film and photography as well. Our researcher could use these materials to analyze the concert from the perspectives of the participants. These accounts would necessarily be selective, focusing only on particular aspects of the Woodstock experience.
Is it possible to conduct an experiment that replicates the original Woodstock? Some would say that Woodstock 1999 was such an experiment and that it failed miserably, with fires, violence, arrests, and acres of mud. However, systematic scientific experiments are different from blatant attempts to cash in on the Woodstock mystique. Although the unique conditions of the 1969 gathering cannot be re-created in a lab setting, it is possible to identify some of the defining features of the Woodstock experience and to explore those experimentally. Over a three-day period, tens of thousands of strangers came together in a mass gathering, mostly devoid of any official presence (no cops, fences, roads, ticket booths, or porta potties), and had an almost entirely peaceful experience. How did this happen? Altruism, cooperation, and trust between strangers are some of the measurable group qualities that seem to have been present. An experimenter might be able to create laboratory environments in which subjects participate in activities that highlight one or more of these qualities—even without the mud, music, and drugs that were part of the original Woodstock experience.
No matter what methodological choice our researcher makes, they will sacrifice some types of information in order to acquire others, and they will trade in one set of advantages and disadvantages for another. The researcher’s choices will be guided not only by what they want to accomplish sociologically but also by the methods in which they are competent, the time in which they want to complete the project, the resources available from any funding agencies, and their access to cooperative, qualified people, both as respondents and as research assistants.
The rest of this chapter will discuss six methods in detail: ethnography/participant observation, interviews, surveys, existing sources, experimental methods, and social network analysis. We will see how various sociologists have used these methods to conduct research on the general topic of “family dynamics.”
Glossary
- QUANTITATIVE RESEARCH
- research that translates the social world into numbers that can be treated mathematically; this type of research often tries to find cause-and-effect relationships
- QUALITATIVE RESEARCH
- research that works with nonnumerical data such as texts, field notes, interview transcripts, photographs, and audio recordings; this type of research often tries to understand how people make sense of their world
- SCIENTIFIC METHOD
- a procedure for acquiring knowledge that emphasizes collecting concrete data through observation and experimentation
- LITERATURE REVIEW
- a thorough search through previously published studies relevant to a particular topic
- HYPOTHESIS
- a theoretical statement explaining the relationship between two or more phenomena
- VARIABLES
- two or more phenomena that a researcher believes are related; these will be examined in the experiment
- OPERATIONAL DEFINITION
- a clear and precise definition of a variable that facilitates its measurement
- REPLICABILITY
- the ability of research to be repeated and, thus, later verified by other researchers
- CORRELATION
- a relationship between variables in which they change together and may or may not be causal
- CAUSATION
- a relationship between variables in which a change in one directly produces a change in the other
- INTERVENING VARIABLE
- a third variable, sometimes overlooked, that explains the relationship between two other variables
- SPURIOUS CORRELATION
- the appearance of causation produced by an intervening variable
- DEDUCTIVE APPROACH
- an approach whereby the researcher formulates a hypothesis first and then gathers data to test that hypothesis
- INDUCTIVE APPROACH
- an approach whereby the researcher gathers data first, then formulates a theory to fit the data