The Effects of Stereotypes and Prejudice on Society
LEARNING OBJECTIVES
Describe the connection between racial and ethnic diversity and attitudes toward the social safety net.
Explain how awareness of the United States becoming a majority-minority country influences political attitudes.
Explain why it can be hard for even the best-intentioned, most self-aware people to overlook their own privileges.
Living in a prejudiced world, as we’ve discussed above, affects how we think, feel, and act as we go about our lives seeking pleasure, avoiding pain, helping others, trying to leave the places we visit better off than they were when we arrived, and so on. It affects the mental life of people in both dominant and nondominant groups and influences how they interact with one another. It also influences what society is like more broadly—what policies are in place and what society as a whole prioritizes and disfavors. To get a handle on how people’s stereotypes and prejudices affect society as whole, it can be useful to engage in a bit of science fiction and imagine what the world would be like if people weren’t prejudiced and didn’t so easily form inaccurate stereotypes. Try it. What would be different about the world we’re living in? What institutions would be different or wouldn’t exist at all? What might society achieve if it weren’t paying the “tax” that our stereotypes and prejudices impose?
Support for the Social Safety Net
DIVERSE SOCIETIESSocieties that are open and diverse have tended to be among the most creative and wealthy in history. Here we see a thriving marketplace in the tourist hot spot of Sydney, Australia.
Historically, increasing the openness and diversity of societies has gone hand in hand with increases in their wealth and productivity (Ashraf & Galor, 2011). Today, in both the United States and in Europe, regions with more foreign-born individuals tend to be more innovative, as measured, for example, by the number of patents filed (Chellaraj, Maskus, & Mattoo, 2008; Ozgen et al., 2014). At the company level, greater diversity, especially when it exists at both the top and bottom of the company hierarchy, is associated with greater productivity (Richard, Triana, & Li, 2021). Openness to working alongside people representing the full range of human diversity helps societies “expand the pie” and makes them more creative and wealthier.
Greater diversity has a very different effect, however, on how the pie is split. Given what social psychologists have learned about the powerful effects of ingroup/outgroup psychology, it would scarcely be surprising to learn that people tend to be open to providing more generous public assistance to people in need if they believe that most of these people are from their own ethnic, racial, and religious groups. And that is clearly the case, both across the United States and internationally. In the United States, states with larger Black populations provide less generous social benefits (Hahn et al., 2017). By way of illustration, Oregon, with a Black population of only 2.9 percent, provides families eligible for the Temporary Assistance for Needy Families program a monthly stipend three times as high as Mississippi offers, with a population that is 38 percent Black.
Internationally, greater ethnic diversity is associated with diminished social trust—that is, how much citizens trust people in general and their neighbors in particular (Dinesen, Schaeffer, & Sønderskov, 2020). We see across Europe that support for safety net provisions decreases as a function of both the share of immigrants in a country’s population and the diversity of the immigrant population (Alesina, Harnoss, & Rapoport, 2021).
Reactions to Changing Demographics
In a world without strong ingroup commitments, a great many demographic changes wouldn’t even be noticed, let alone resisted. If human beings saw themselves and others as members of one big family, the ethnic, racial, and religious composition of asylum seekers, new immigrants, and the population as a whole wouldn’t matter and might not even register.
But we don’t live in such a world. As we write this, countries such as Hungary and Poland, which erected physical barriers to prevent the entry of refugees from Syria, are warmly welcoming those fleeing Russia’s invasion of Ukraine. Indeed, the current right-wing nationalist governments of Poland and Hungary rose to power in part by channeling voters’ fear of newcomers who look different and practice a different religion than the native population. In the United States, former president Donald Trump, whose promise to “build a wall” between the United States and Mexico buoyed his own election, complained loudly that the United States shouldn’t have to accept asylum seekers from “$%%#! countries” like Haiti, El Salvador, and many from Africa. He maintained instead that the United States should take in more immigrants from Norway.
Researchers have examined the impact of the perceived threat of outgroup immigration in a series of experimental studies in which White survey respondents were informed that the United States is projected to become a majority-minority country in 2042—that is, that non-Hispanic Whites will no longer be a majority of the general population by that date but merely one ethnic group, albeit the largest, among many.
DATA EXPLORATION
FIGURE 11.10FEELINGS OF WARMTH TOWARD MEMBERS OF DIFFERENT ETHNIC GROUPSBeing told that the United States was becoming a majority-minority country in 2042 led White respondents to express less warmth toward Black, Latino, and Asian Americans but not toward White Americans.Source: Adapted from Craig & Richeson (2014a).
In one such study, participants who learned of this projection scored higher on a racial bias scale than did control participants who were merely told about the current demographic makeup of the United States. They placed greater emphasis on working with people from their own ethnic group, for example, and indicated that they would be more bothered if their child married someone from a different ethnic group (Craig & Richeson, 2014a). In another study by the same researchers, White participants informed of the projected demographic shift expressed less warm feelings toward the major non-White ethnic groups in the United States (see Figure 11.10).
This concern about looming demographic trends has political implications: Survey respondents who were told that California had recently become a majority-minority state were more likely than respondents in the control condition to say that they leaned more Republican than Democrat (Craig & Richeson, 2014b; Figure 11.11). (Control respondents were told that the Hispanic population had become roughly equal to the Black population in the nation as a whole.) Similar results have been obtained in Canada: White Canadians who were shown a graph showing that Whites would soon be less than 50 percent of the population expressed more fear and anger toward other racial groups than those shown a graph with Whites still in the majority (Outten et al., 2012).
FIGURE 11.11THREAT FROM CHANGING DEMOGRAPHICSThe graph shows the percentage of White respondents who said they leaned Republican or Democrat when told that California recently became a majority-minority state (experimental condition) or when told that the Hispanic population in the United States is equal to the Black population (control condition). The threat posed by changing demographics tends to make White members of the electorate lean in a more politically conservative direction.Source: Adapted from Craig & Richeson (2014b).
Beliefs About Progress and Privilege
After reading this and the previous chapter, you will not be surprised to learn that members of dominant and marginalized groups tend to disagree about the level of inequality in society and about the amount of progress that’s been made in overcoming it. We would expect men to underestimate the male/female wage gap relative to the estimates made by women, Israelis to underestimate the Israeli/Palestinian wealth gap relative to the estimates made by Palestinians, and White Americans to underestimate the White/Black gap in access to health care relative to the estimates made by Black Americans.
Part of the reason that dominant and historically marginalized groups differ in such estimates is that they tend to measure progress differently. Members of dominant groups tend to measure progress in terms of where historically marginalized groups are now relative to where they were in the past, which often leads to an impression that considerable progress has been made. Members of marginalized groups, in contrast, tend to measure progress in terms of where they are now compared to what they’re aiming for—equality. Richard Eibach and Joyce Ehrlinger (2006) found that White and Black Americans differ in their assessments of racial progress in the United States in part because White Americans focus more on comparisons between the present and the past whereas Black Americans focus more on comparing the present to an ideal standard of full equality. Furthermore, when Eibach and Ehrlinger led their Black and White respondents to adopt the same frame of reference focused on either the past or the future goal, the two groups made similar assessments of how much racial progress there has been.
Other research has shown that different reference points are not the only reason that dominant and marginalized groups differ in their assessments of inequality and progress. According to what has come to be known as the Marley hypothesis, dominant and marginalized groups’ assessments tend to differ because members of the dominant group generally know less about the history of oppression and disadvantage suffered by the other groups. The hypothesis is applied most often to differences between racial groups, and its name is inspired by the lyrics of reggae artist Bob Marley’s song “Buffalo Soldier”: “If you know your history, then you will know where you’re coming from.”
In the most direct test of this idea, students at predominantly White or Black universities were presented with statements about episodes of racism and asked to indicate which were true (“The FBI has employed illegal techniques . . . in an attempt to discredit African American political leaders during the civil rights movement”) and which were false (“African American Paul Ferguson was shot outside his Alabama home for trying to integrate professional football”). The Black respondents were significantly better at distinguishing between the true and false statements, and this difference in knowledge about historical racism was a significant predictor of the difference between the White and Black students’ perception of contemporary racism (Nelson, Adams, & Salter, 2013).
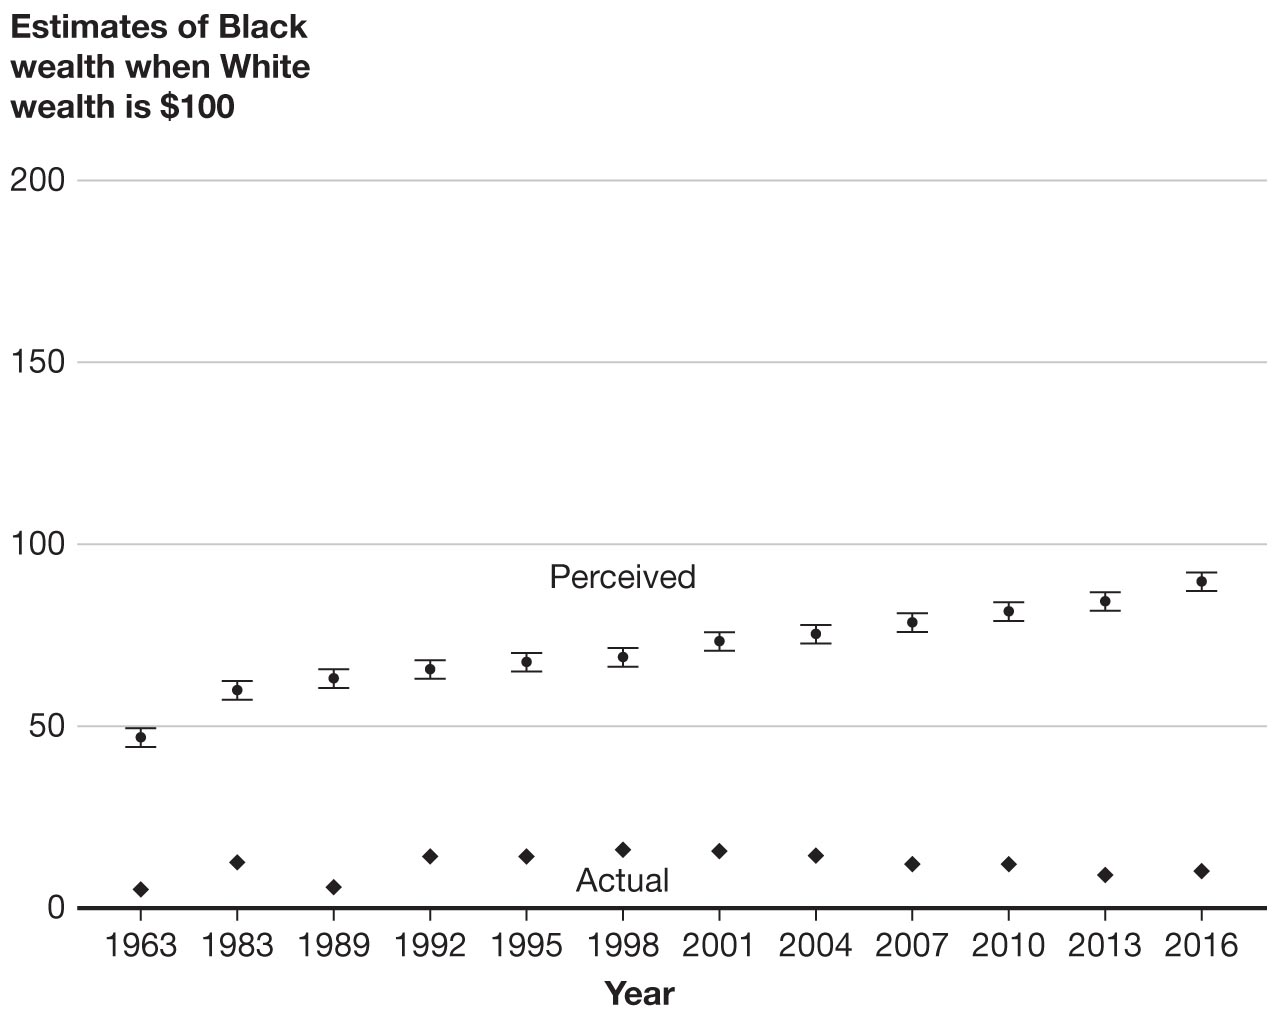
Particularly striking evidence of overly rosy views about racial equality comes from studies that ask survey respondents to estimate how White and Black Americans compare on various measures of economic success—annual income, employer-provided health benefits, wages among college graduates, household wealth, and so forth. These estimates reveal a belief on the part of both White and Black Americans that there has been much more progress toward equality than there actually has been. Respondents believe that the economic conditions of White and Black Americans today are much more equal than they actually are, especially when it comes to household wealth. As shown in Figure 11.12, respondents consistently underestimate the White/Black wealth gap, both in the past and now, with the largest discrepancy between perceived and actual values found in respondents’ estimates of the current wealth gap between Blacks and Whites. Respondents estimated that for every $100 of wealth accumulated by the average White person in the United States, the average Black person has accumulated $25, when the actual figure for the average Black person is $5 (Kraus et al., 2019; Kraus, Rucker, & Richeson, 2017).
More information
The graph depicts the estimated and actual wealth of the average Black family when the wealth of an average White family is 100 dollars. The vertical axis represents the estimates of black when white wealth is 100 dollars, ranging from 0 to 200 in increments of 50. The horizontal axis represents the years from 1963 to 2016. The values of perceived and actual estimates are as follows: 1963: 47 and 5; 1983: 60 and 12; 1989: 63 and 6; 1992: 65 and 15; 1995: 67 and 14; 1998: 68 and 16; 2001: 73 and 15; 2004: 74 and 15; 2007: 78 and 12; 2010: 81 and 12; 2013: 84 and 10; 2016: 89 and 10. All values are approximate.
FIGURE 11.12ESTIMATES OF THE WHITE/BLACK WEALTH GAPThe graph shows survey respondents’ estimates of the wealth of the average Black family relative to every $100 of wealth accumulated by the average White family, with the actual values provided as a comparison. Respondents consistently underestimate the White/Black wealth gap, both historically and especially in contemporary times.Source: Adapted from Kraus et al. (2019).
These erroneous beliefs about progress toward racial equality are related to contemporary debates—often heated ones—about privilege and disadvantage. A number of pundits and bloggers have argued that society is waging “war” on White Christian men, complaints that reflect a conviction that the world caters to women, non-Christians, and non-Whites. That conviction is not shared by many women, atheists, Muslims, Hispanics, or Pacific Islanders. Here, too, what we have discussed in this and the previous chapter about ingroup/outgroup dynamics renders such divergent assessments entirely predictable.
But such beliefs are further advanced by some very basic features of how the mind works. Recall our discussion in Chapter 4 of the availability heuristic, whereby people assess the likelihood of something by the ease with which relevant instances come to mind. When it comes to life’s hardships and benefits, one’s own hardships and burdens tend to spring to mind more readily than one’s benefits and privileges do. Davidai and Gilovich (2016) explained this difference by drawing an analogy to the headwinds and tailwinds experienced by long-distance runners or cyclists. When running or cycling into the wind, one is aware of the wind on a near-constant basis, as it is literally in one’s face. When the wind or the course changes, the runner or cyclist is aware of being boosted along by the wind—but only briefly. The tailwind quickly recedes into the background and is no longer noticed. And what’s true of headwinds and tailwinds while cycling or running is true of life’s hardships and privileges generally. People have to pay attention to the obstacles in their paths in order to overcome them. They don’t have to pay attention to privileges they enjoy; they can simply—and mindlessly—reap the benefits they provide. This difference in availability helps explain why people think their parents were harder on them than on their siblings, why both Democrats and Republicans think the political landscape favors the other side, and why academics think their colleagues receive more favorable treatment by grant agencies and journal editors than they do themselves.
Kaidi Wu and David Dunning (2020) note that this difference in availability is compounded by the fact that many of the advantages enjoyed by members of dominant groups come in the form of the absence of burdens rather than the presence of perks—not being followed closely and suspiciously by salespeople when shopping, not having to put up with catcalls when walking down the street, not having to get one’s wheelchair over a steep curb, and so on. They note further that stimuli that are present command more attention than stimuli that are absent, a powerful asymmetry that sheds considerable light on the facts that even in the aftermath of the Me Too movement, only 28 percent of men think that men have it easier than women do (Horowitz, Parker, & Stepler, 2017) and that a majority of White Americans believe that they suffer from racial discrimination (Wilkins & Kaiser, 2014).
Other research shows that simply pointing out someone’s privilege generally does not lead them to accept that they have it (Phillips & Lowery, 2015, 2020). Indeed, this strategy often backfires: When people are presented with evidence that they have benefited from group-based privilege, they cite the personal hardships they’ve had to overcome in their lives. So what to do? How best to make members of dominant groups more aware of the privileges that often come with their position in society? The economist Robert Frank (2016) offered some potentially helpful advice from his work on the role of luck in life. He notes that people tend to bristle when you mention the ways in which they have been lucky—being born into a wealthy family, receiving a quality education, not having to risk death from being conscripted to fight a war, or even having inherited good genes. But the same people who bristle when told how lucky they have been will often enthusiastically and gratefully recount various times when they have benefited from luck. Frank’s insight about luck applies equally to trying to get people to recognize their privilege: Ask, don’t tell.
LOOKING BACK
Although diverse societies can be unusually dynamic and productive, the existence of outgroup stereotypes and prejudice can impede efforts to make the benefits of that dynamism and productivity more widely available. Different groups in diverse societies vary in their assessments of how much progress has been made toward equality and how fair and just society is at any given moment. Disparate assessments of the advantages and disadvantages enjoyed by different groups can be exacerbated by the fact that people’s own hardships tend to be more accessible than their privileges, in part because many advantages in life come in the form of the (relatively invisible) absence of disadvantages. One way to get people to appreciate the privileges they enjoy is to ask them—but don’t tell them—what they are.
The claim that different racial groups make different assessments of the amount of racism in society today because they differ in their knowledge of racial history.