LEARNING OBJECTIVE
- Identify the methods social psychologists use most frequently in their research and some pros and cons of each method.
Social psychologists use a wide variety of methods to test hypotheses about human behavior. As you read about these methods in this chapter and see them applied elsewhere in the book, keep in mind that each method is useful in some way for getting at the truth of propositions about social behavior. Even if you can’t conduct a study to test a particular proposition because resources are insufficient or because it would be unethical, thinking through how you could test a given idea can lead you to new ideas that, on reflection, might surpass your initial speculation. Such an exercise is called a thought experiment, and it’s one of the most useful critical thinking skills you’ll learn from reading this book. To conduct a thought experiment, you need to speculate about the results you might obtain under two different sets of circumstances. Although this is no substitute for actually collecting data, a thought experiment can help clarify your assumptions and general conceptual understanding of the phenomenon in question.
Try to predict how people would behave in each of these situations. Put a check by the answer you believe to be correct before you see the right answer. If you don’t commit yourself in this way, you’ll be vulnerable to the hindsight bias.
Familiarity, in general, breeds liking. The more a person has been exposed to a stimulus, within broad limits, the more the person likes it. See Chapter 9.
People are more persuaded by the lies they tell if they are paid nothing or a small amount than if they are paid a lot. See Chapter 6.
We like people more if we do them a favor. See Chapters 6 and 8.
When people are reminded of their own mortality, they focus on the values they hold most dear, such as religion and love of country. See Chapter 6.
Males give higher grades to females who are good-looking. See Chapter 9.
There’s no general answer to the question of whether people are more likely to prefer risk when they discuss things in a group. They prefer risk more if that was their initial inclination before discussion and less if caution was their initial inclination. See Chapter 12.
Rewarding children for doing something they would do anyway makes them less interested in doing it. “Contracts” like those described are likely to turn play into work. See Chapter 6.
People report that they’re more assertive if they’re asked to think of a few instances of assertiveness rather than if they’re asked to think of many. It’s easier to come up with a few instances than many, and people use the effort they had to expend to think of the examples as an indicator of what they are really like. If it seems hard to come up with examples, they’ll rate themselves as less assertive than if it’s easy. See Chapter 4.
A hypothesis is a prediction about what will happen under particular circumstances—for example, in a research study. A theory is a set of related propositions intended to describe some phenomenon or aspect of the world. Speaking casually, people sometimes say that something is “just a theory” meaning it’s a notion largely unsupported by facts. In science, including social science, theories generally have support in the form of empirical data, and they often entail predictions that would be surprising except in light of the theory. Many theories in the history of science have led to a greater understanding of natural phenomena or to important real-life consequences. Evolutionary theory is supported by an enormous number of facts as well as nonintuitive predictions that have been confirmed by empirical observation. Bacterial adaptation to drugs, for example, is well understood in terms of evolutionary theory.
An example of a hypothesis born of a social psychology theory is the prediction that when people work hard to acquire something (a consumer product, a new job, or admission to an exclusive club) and it turns out to be disappointing, they will be motivated to find hidden benefits in what they acquired. Such a hypothesis, which can be tested in a variety of ways, is an example of the sort of hypotheses that are generated by dissonance theory, the theory that people like their thoughts to be consistent with one another and with their actions and will do substantial mental work to achieve such cognitive consistency. Hypotheses are tested by studies, which examine predictions about what will happen in particular concrete contexts. Thus, theories are more general than hypotheses, which are in turn more general than the specific findings derived from the studies designed to test them.
The first step in scientific research is often just to look at a phenomenon in a systematic way, with a view to understanding what’s going on, and coming up with hypotheses about why things are the way they are. Charles Darwin was first and foremost a great observer of natural life, and his observations of finches in the Galápagos Islands, as well as all manner of other species during his five and a half years on the Beagle, led to his theory of evolution by natural selection.
Social psychologists likewise learn a great deal from observation. One such method of research, used by both psychologists and cultural anthropologists, is called participant observation and involves observing some phenomenon at close range. An anthropologist may live with a group of people for a long time in order to note what they do and come up with guesses—sometimes inspired by conversations with the people being studied—about why those people behave in certain ways or have certain beliefs.

In the 1950s, social psychologists Roger Barker and Herbert Wright (1954) studied how children in a U.S. Midwestern town interacted with their surroundings. They followed children around as they delivered the morning paper, went to school, played kick the can, did their homework, and went to church suppers. The study revealed a great deal about the way the children dealt with their environment, the opportunities and constraints that came with their environment, and the factors that might have molded their characters.
Social psychologists often observe social situations in a semiformal way, taking notes and interviewing participants. Observations can be misleading, however, so any tentative conclusions gleaned from observational research should ideally be tested using other methods.
One type of research can be conducted without ever leaving the library or one’s computer. Researchers may look at evidence found in archives of various kinds, including census reports, police records, sports statistics, newspaper articles, and databases containing ethnographic (anthropological) descriptions of people in different cultures. For example, for their research on cultures of honor, Nisbett (1993) and his colleagues studied FBI reports of homicides and found, as they had anticipated, that homicides were more common in the U.S. South than in the North. The FBI reports also included the circumstances of the homicides—specifically, murders committed in the context of another felony (such as while robbing a convenience store) versus murders that were crimes of passion (such as in the context of a love triangle). These classifications enabled Nisbett and Cohen (1996) to analyze the various types of murders and to discover that homicides involving some type of insult—for example, barroom quarrels and cases of sexual infidelity—were much more common in the South than in the North. Indeed, homicides not involving personal honor are actually less common in the South, leading a Southern sociologist (Reed, 1981) to say that you’re safer in the South than in the North if you stay out of the wrong bars and bedrooms!
One of the most common types of study in social psychology involves simply asking people questions. Surveys can be conducted using either interviews or written questionnaires. The participants may be a small collection of students or a large sample of the national population. When the investigator is trying to discern the beliefs or attitudes of some group of people—freshmen at a particular university, say, or Guatemalans living in Canada—the people in the survey must be representative of the target population as a whole. Obtaining a representative sample is best achieved by selecting potential respondents randomly. The only way to obtain a random sample is to give everyone in the population an equal chance of being chosen. If the university has a directory of students, a random sample can be obtained by finding out the total number of freshmen (say, 1,000), deciding how many to interview (say, 50), and then asking every twentieth person in the directory to participate in the survey (Figure 2.1). (Such a sample isn’t technically random because the directory is likely to be organized alphabetically and every twentieth name is chosen systematically rather than randomly. But the procedure is a reasonable approximation of random selection because there’s unlikely to be anything systematically associated with every twentieth name.)
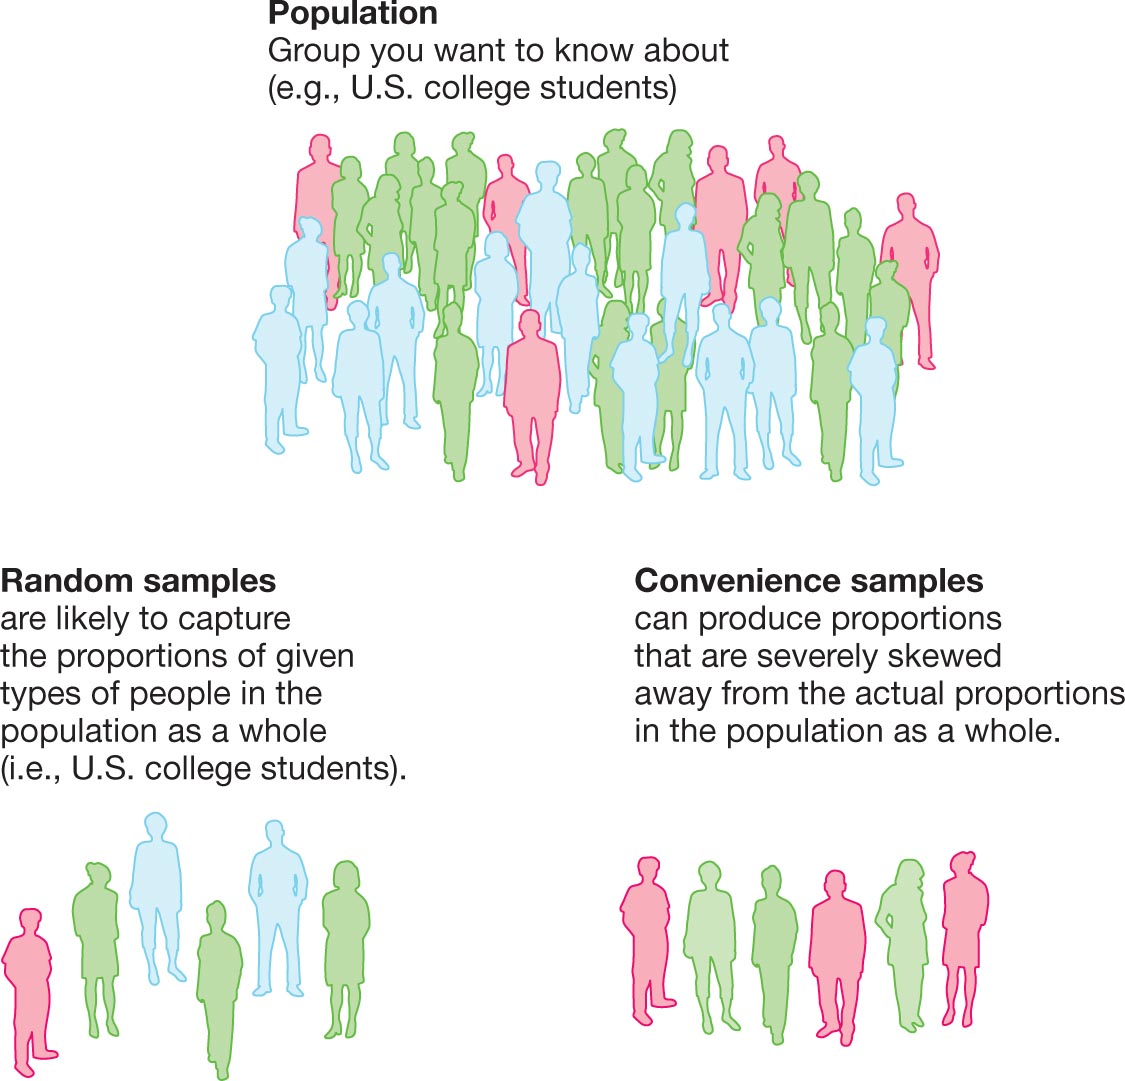
The diagram depicts random sampling and convenience sampling using illustrations of three groups of people. The largest group of people is labeled, Population. A text beside reads, “Group you want to know about (e.g., U.S. college students).” The other two smaller groups are labeled, Random samples and Convenience samples. A text beside random samples reads, “Random samples are likely to capture the proportions of given types of people in the population as a whole (i.e., U.S. college students).” Another text beside the convenience samples reads, “Convenience samples can produce proportions that are severely skewed away from the actual proportions in the population as a whole.”
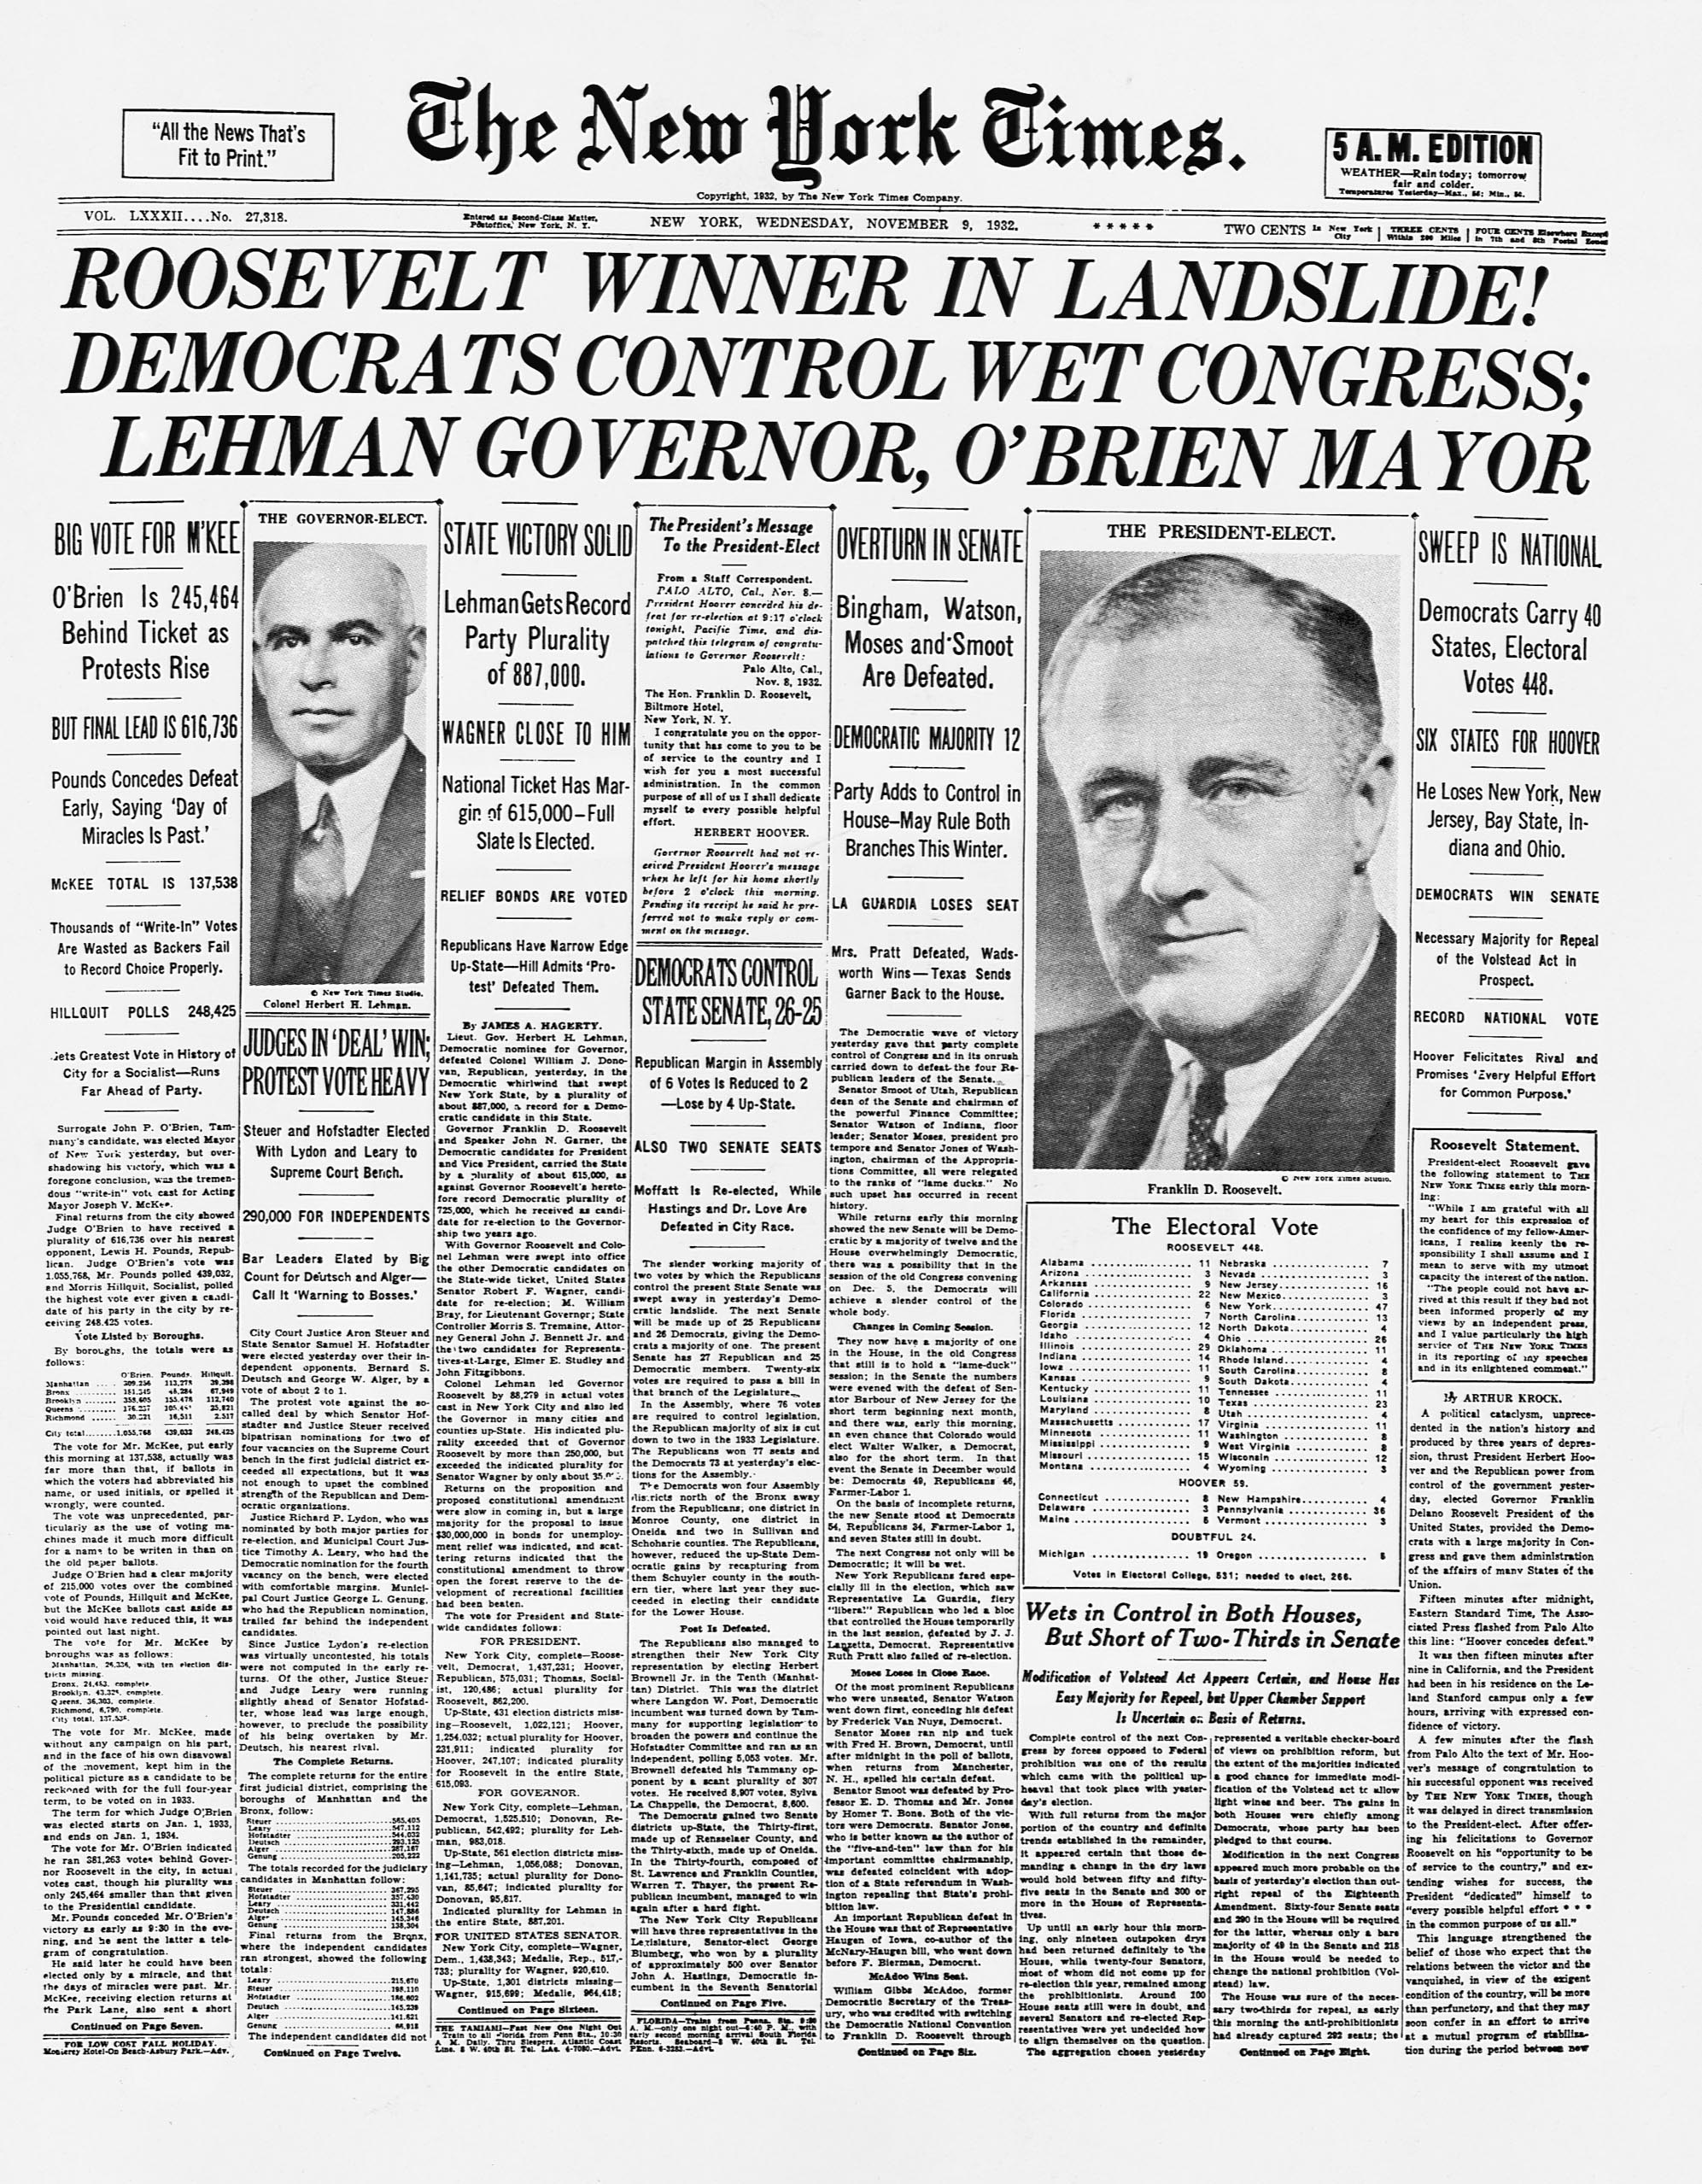
Convenience sampling, such as contacting people as they enter the library or emailing fraternity and sorority members, is not random. A convenience sample may be biased in some way; that is, it might include too many of some kinds of people and too few of others. Information gathered from biased samples is sometimes worse than no information at all. One famous example from the history of public opinion polling comes from a survey conducted by the Literary Digest that involved more than a million (!) respondents. The Literary Digest erroneously predicted that the Republican Alf Landon would defeat the Democrat Franklin Delano Roosevelt in the 1936 U.S. presidential election. In fact, the election was one of the most dramatic landslides in history: Landon won only two states. How could the survey have been so far off? The sample was biased because it was drawn from telephone directories and automobile registrations. In 1936, wealthy people were more likely to own phones and cars than were poorer people, and they were also more likely to vote Republican.
You’ve undoubtedly seen the results of reader surveys in various magazines. Two-thirds of People magazine readers who went on a vegan diet say they lost weight. Three-quarters of the readers of Outside magazine say that sex is more enjoyable outdoors. Sixty percent of respondents in a Slate poll claim they are happier after going to church than if they stay home and watch a football game on Sunday. Actually, all three results are fictitious, and you should ignore each claim. In fact, you should ignore all claims like these, even if they aren’t made up, because the people who take the time to respond to such polls are likely to be different from those who do not respond and therefore are unlikely to represent the population as a whole. For example, readers of People who have lost weight may be more likely than those who haven’t lost weight to respond to a survey about weight loss. The criterion that everyone be equally likely to be included in the sample is clearly not met, upping the odds that the survey results are misleading.
Nisbett and Cohen (1996) used surveys to try to find out why U.S. Southerners were more likely to commit homicide. One possibility was that Southerners are simply more accepting of violence. But when the investigators looked at published national surveys of attitudes toward violence, they found few regional differences. For example, Southerners were no more likely than Northerners to agree with the sentiment that “an eye for an eye” justifies retaliation, and Southerners were actually more likely to agree that “when a person harms you, you should turn the other cheek and forgive him.” However, the researchers found that Southerners were more likely to endorse violence in response to insults and to think that a man would be justified in fighting an acquaintance who “looks over his girlfriend and talks to her in a suggestive way.” Southerners were also more likely to approve of violence in response to threats to home and family, thinking, for example, that “a man has a right to kill a person to defend his house.” In addition, the investigators found that Southerners were more approving of violence in socializing children: They were more likely to say that spanking was a reasonable way to handle a child’s misdeeds and that they would encourage their children to fight someone who was bullying them.
In trying to explain this acceptance of violence in specific contexts, Nisbett and Cohen sought out anthropologists and historians. Several sources suggested that the South might have a “culture of honor.” The U.S. North was settled by farmers from England, Holland, and Germany. Farmers in general are peace-loving folks; there’s little reason for them not to be. The U.S. South was settled by herding peoples from the edges of Great Britain—Scottish, Irish, and Scotch-Irish from Ulster. Herding peoples throughout the world tend to be sensitive to slights and prone to aggression when insulted. They need to be vigilant because they can lose their livelihood—their herd—in an instant. They cultivate a stance of being ready to commit violence at the merest hint that they might not be able to protect themselves, their homes, and their property. A man has to retaliate violently if insulted in order to establish that he is not to be trifled with. Parents teach their children not to fear violence and to protect themselves. This historical hypothesis guided the rest of Nisbett and Cohen’s research.
In addition to its roots in the fringes of Britain, herding has traditionally been much more common in the Mediterranean countries than in northern Europe, and those countries in general have always had cultures of honor. (The Corsican Napoleon Bonaparte and the Sicilian Mafia are examples.) In Greek mythology (or perhaps in Greek history, we don’t really know), Paris of Troy took beautiful Helen from her husband, Menelaus of Sparta, provoking a war of ten years’ duration. “The face that launched a thousand ships” likely wouldn’t have caused so many northern European vessels to set sail.
One of the most important distinctions among different types of research is that between correlational research and experimental research. In correlational research, psychologists measure two or more variables and examine whether they are related. Experimental research goes a step further, enabling investigators to make strong inferences about why a relationship exists or how different situations affect people’s behavior.
Looking for correlations can be a valuable way to begin a line of inquiry. However, once established, a correlation requires further exploration. Does variable 1 causally influence variable 2, or is it the other way around—reverse causation? Or does some third variable influence both? In correlational research, we can never be sure about causality.
For example, U.S. News and World Report reported in 2013 that casual sex worsens college students’ mental health. The article reported that students who have more casual sexual encounters tend to have poorer mental health than those who have fewer such encounters. But casual sex might be associated with loneliness, and we know that lonelier people have poorer mental health than people who don’t report that they’re lonely. So a third variable—loneliness—might be causing students to engage in more casual sex and might worsen their mental health. In that case, casual sex might not in fact be causing poorer mental health; rather, a third variable is causing both. It’s even possible that the causal direction runs the opposite way from what the headline suggests: Poorer mental health may cause people to seek out casual sex as a way of feeling less unhappy.
Correlational research usually can’t provide convincing evidence of a causal relationship because of the possibility of self-selection; that is, the investigator has no control over any particular participant’s level, or score, on a given variable—for example, whether the participant grew up in poverty or opulence, has an IQ of 100 or 130, or follows the teachings of Jesus, Muhammad, or Buddha. In effect, the participants have “chosen” their level on all variables—those that are measured and those that aren’t. For example, the study finding that casual sex was associated with poorer mental health didn’t assign people to have casual sex or not. And the researchers didn’t know what other qualities participants had in addition to their sexual proclivities—a sunny or gloomy disposition, good or bad physical health, a stressful or relaxing living situation. These and other qualities might have been the true cause of poorer mental health.
In correlational research, investigators can look at only the degree of relationship between two or more variables. The strength of a relationship between variables can range from 0, meaning that the variables have no relationship at all, to 1 (or +1), meaning that the higher the level on one variable, the higher the level on the other—without exception. (If being higher on one variable is perfectly associated with being lower on the other, the correlation is −1.) By convention, a correlation of .1 indicates a weak relationship, a correlation of .3 a moderate relationship, and a correlation of .5 or higher a strong relationship. Figure 2.2 shows what are called scatterplots. Variable 1 is on the x-axis (horizontal), and variable 2 is on the y-axis (vertical). Each dot represents a study participant for whom there is a score on both variables: a score on variable 1 and a score on variable 2. Panel A shows a perfect negative correlation: The higher the level on variable 1, the lower the level on variable 2, without exception. Panel E shows a perfect positive correlation: The higher the level on variable 1, the higher the level on variable 2, without exception.
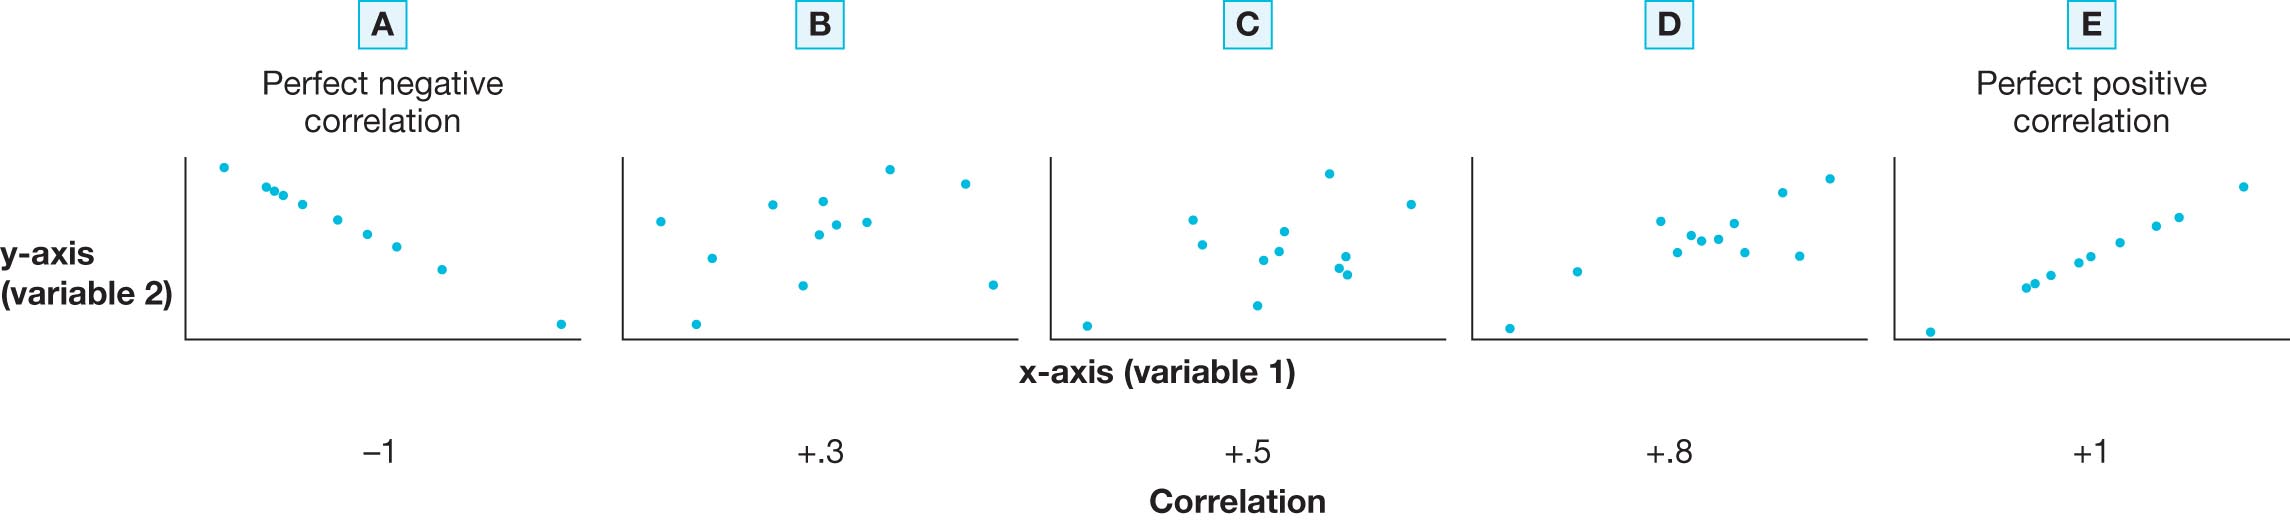
The scatterplots depict the correlation between two variables, variable 1 on the x-axis and variable 2 on the y-axis. The degrees of correlation are shown in five panels, labeled A to E. Panel A shows a perfect negative correlation of negative 1, where the data points form a perfectly downward sloping pattern to the right. Panel B shows a moderate correlation of plus 0.3, where a few data points are scattered to form a shallow upward slope. Panel C shows a strong correlation of plus 0.5, where most of the data points are scattered to form a less shallow upward slope than panel B. Panel D shows a very strong correlation of plus 0.8, where almost all data points are scattered to form a more solid upward slope. Panel E shows a perfect positive correlation of plus 1, where the data points form a perfectly upward sloping pattern to the right.
Panel B in Figure 2.2 shows a correlation of .3—a moderate relationship between the two variables—which could correspond, for example, to the correlation between a person’s percentage of body fat and degree of risk for cardiovascular illness. Both the marked spread of the dots (their scatter) and their relatively shallow slope show that the association is relatively weak.
Panel C in Figure 2.2 shows a correlation of .5—a strong relationship—which is approximately the degree of association between height and weight. Panel D in Figure 2.2 shows a correlation of .8—a very strong relationship. This is about the degree of correlation between a person’s score on the math portion of the SAT on a first testing occasion and the same person’s score a year later. Whether strong or weak, correlations establish only that there is an association between variables, not that one variable exerts a causal influence on the other.
Scientific findings reported in the media are often based on correlational research. It’s crucial to recognize the limits of such findings. They’re often interesting, and they might suggest a particular causal connection, but by no means can correlational studies establish causation. To further develop your critical thinking abilities, try your hand at interpreting the correlational results in Box 2.2.
Correlational studies can point investigators to possible causal hypotheses about some aspect of the world. Moreover, correlational studies are sometimes a researcher’s best option when an experimental study would be difficult or unethical to conduct. Unfortunately, even if it seems possible that a causal relationship exists, correlational studies don’t normally indicate which variable may be causing the other, nor do they reveal whether some third variable is at work driving the association between the two variables being studied. Consider the following example: People who watch the local evening news—with reports of murders, fires, and other newsworthy mayhem—see more danger in the world than people who don’t. The most obvious explanation is that seeing dangers on TV makes people feel more at risk. But could it be that people who are already anxious watch the local news to justify their fearfulness? Or is there some third variable at play? For example, elderly people may have more anxiety about their lives and may have more time to watch TV. This study could be refined so that it potentially rules out the latter hypothesis by showing that older adults are not more likely to watch TV than younger people are, nor do they tend to be more anxious about their lives than younger people do. But ruling out an alternative hypothesis isn’t normally sufficient to prove that a given relationship is causal. As more and more alternative explanations are tested and rejected, however, it becomes more and more plausible that the hypothesized causal relationship is indeed correct.
Not So Fast: Critical Thinking about Correlation and Causation
The following items are the findings of various correlational studies for which scientists or the media have implied a causal connection. To be a good consumer of correlational research, you need to be able to evaluate such causal claims carefully. For each of the findings in the list, consider alternatives to the stated or implied causal relationship—namely, that A causes B. Might it actually be the case that B causes A? Or that some variable C causes both?
It could be that parents try to control portion size for their children if the children are already overweight. If so, the direction of causation is the reverse of that hypothesized by TIME Magazine. It could also be the case that families with more stress in their lives have more controlling parents and more overweight children but that there is no causal connection between the two. In this case, a third variable associated with stress would account for the correlation.
It could be that wealthier countries have better education systems and hence produce people who score higher on IQ tests. In that case, wealth causes intelligence rather than the other way around. In fact, we have good reason to believe that the correlation between IQ and wealth holds because of causality working in both directions: Greater intelligence leads to greater wealth, and greater wealth leads to greater intelligence (in part through better educational systems).
It could be that healthier people engage in more social activities of all kinds, including going to church. If so, the direction of causation runs opposite to the one implied. Or it could be that good social adjustment—a third variable—causes people both to engage in more social activities and to be healthier.
It could be that people who are depressed are less likely to do anything fun, such as getting a pet. If so, the direction of causation is opposite to the one implied. (But in fact, giving a pet to a depressed person does improve the person’s mood.)
It could be that poorer states are more likely to have higher homicide rates, and poorer states are more likely to have abstinence-only sex education. Indeed, both are true. So there may be no causal connection at all between sex education and homicide. Rather, a third variable, such as poverty or something associated with it, may be causally linked to both, thereby accounting for the correlation.
It could be that better physical health—a third variable—helps people to be smarter and leads to sperm of better quality. Or some other factor could be associated with both intelligence and sperm quality, such as drug or alcohol use. So there might be no causal connection between intelligence and sperm quality.
It could be that people who take any kind of drug are more sensation-seeking than other people and therefore engage in many kinds of stimulating behavior, including those that are against the law. Smoking marijuana may not cause cocaine use, and cocaine use may not cause marijuana use. Rather, some third factor, such as sensation seeking, may influence both.

Some insight into the nature and meaning of a correlational result can be obtained by conducting a longitudinal study, which involves collecting measures at different points in time from the same participants. For example, an investigator might measure how many hours teenagers devote each week to playing violent video games and then examine the same participants’ incarceration rates and other measures of criminal behavior in adulthood. A correlation between video game use in adolescence and criminality in adulthood cannot establish that playing such games leads to a life of crime—there may be a hidden third variable that’s responsible for the relationship. But it does rule out one direction of causality: Nothing that happens when a person is 30 can affect anything the person did when they were younger.
The best way to be sure about causality is to conduct an experiment. Experimental research requires an independent variable, which the scientist manipulates, and a dependent variable. The independent variable is presumed to be the cause of some particular outcome called the dependent variable, which is measured. In experiments, the researcher determines what the independent variable and the levels of that variable will be. Dependent variables can be measured in many ways, including verbal reports (such as statements about degree of anger or anxiety), behavior (helping or not, getting an inoculation or not), physiological measures (heart rate or stress monitoring, such as cortisol levels), or neural measures (increased activity in certain brain areas). In an experiment testing the effectiveness of a new vaccine, the independent variable is whether the person was assigned to receive a vaccine or a placebo. So one level of the independent variable is “receives vaccine,” and the other level of the independent variable is “receives placebo.” The condition in which the person receives the vaccine is the experimental condition. The condition in which the person receives the placebo is the control condition, which is comparable to the experimental condition in every way except that it lacks the one ingredient hypothesized to produce the expected effect on the dependent variable. The dependent variable might be whether or not the person gets the illness the vaccine was intended to prevent, how ill the person becomes, or whether or not the person requires hospitalization or dies.
The great power of experiments comes from exposing participants to different levels of the independent variable by random assignment, which ensures that participants are as likely to be assigned to one condition as to another. It guarantees that, on average, except for the manipulation of the independent variable, there should be no systematic differences across experimental groups. There will be roughly as many men as women in each condition, as many liberals as conservatives, as many athletes as nonathletes. Random assignment thus rules out the possibility of self-selection biases in samples because the experimenter has done the selecting.
As an example of a carefully designed experiment, let’s reconsider two findings: U.S. Southerners are more likely to commit homicide in situations where there has been an insult, and Southerners are more likely to believe that violence is an appropriate response to an insult. Both of these findings are correlational: Southernness is associated with insult-related homicides, and Southernness is associated with the belief that violence is an appropriate response to an insult.
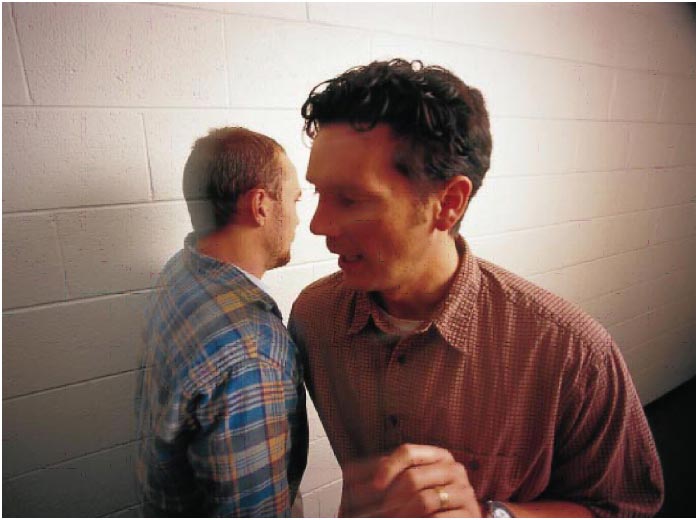
To study further whether Southerners actually do react more aggressively to insults, Cohen and his colleagues conducted a series of experiments (D. Cohen et al., 1996). The participants were all middle-class male students at the University of Michigan; some were Southerners and some were Northerners. All of them believed they were participating in a study on the effects of time constraints on judgments of various kinds. After filling out a questionnaire, they were asked to take it down a long, narrow hallway lined with filing cabinets and to leave it on a table at the end.
As participants in the experimental condition walked down the hall, another student stood in the hallway with a file drawer pulled out. For the participant to pass by, the student had to push in the drawer and move out of the way. Moments later, when the participant returned down the same hallway, the student had to get out of the participant’s way again. This time the student slammed the drawer shut, pushed into the participant’s shoulder, and said, “Asshole.” (He then quickly exited behind a door labeled Photo Lab to avoid a physical confrontation.) Participants in the control condition simply left the questionnaire on the table without incident. (The participants were, of course, randomly assigned to one or the other condition.) The study therefore had two independent variables: one involving a manipulated variable (insulted versus control) and one involving a nonmanipulated “correlational” variable (Northerner versus Southerner).
Several dependent variables were examined after the insult either did or did not take place. First, observers noted the participants’ immediate reactions after the insult. Insulted Southerners usually showed a flash of anger; insulted Northerners were more likely to shrug their shoulders or to appear amused. Second, participants were asked to read a story in which a man made a pass at another man’s fiancée and then to provide an ending to the story. Southerners who had been insulted were much more likely to provide a violent ending than Southerners who hadn’t been insulted, whereas the endings provided by Northerners were unaffected by the insult. Third, each participant’s level of testosterone, the hormone associated with aggression in males, was tested both before and after the insult occurred (or did not occur). The level of testosterone increased for Southerners who had been insulted, but it did not increase for Southerners who hadn’t been insulted or for Northerners, whether insulted or not.
Fourth, participants were asked to walk back down the narrow hallway, and this time another assistant to the experimenter walked toward the participant. This tall, muscular assistant was instructed to walk down the middle of the hall, forcing the participant to dodge out of his way. The dependent variable was how far away the participant was when he finally swerved out of the assistant’s way. The investigators predicted that the insulted Southerners would be put into such an aggressive mood that they would play “chicken” with the assistant, waiting until the last moment to swerve aside. And indeed they did. Northerners, whether insulted or not, swerved aside at a distance of about 5 feet (1.4 meters) from the assistant. Southerners, who are known for their politeness, stood aside at around 9 feet (2.75 meters) if not insulted, but they pushed ahead until 3 feet away (less than 1 meter) if they had been insulted.
This study was not an experiment in the full sense. Only one of the independent variables was created by random assignment—namely, whether the participant was insulted or not. The other independent variable was status as a Southerner or Northerner. Thus, part of the study was correlational. The basic finding was that something about Southernness predisposes college men to respond aggressively to insults, but the study doesn’t indicate what the causally relevant aspect of Southernness is.
In many cases, however, experimental research can establish a causal relationship between two variables. Recall from Chapter 1 the study in which Darley and Batson (1973) found that seminary students in a hurry were less likely to offer aid to someone in need of help. In that experiment, the main independent variable was whether or not the student was in a hurry, and the dependent variable was whether or not the student stopped to help the person. The seminary students were randomly assigned to either the experimental (“late”) condition or the control (“not late”) condition. This random assignment ensured that participants in the two conditions were, on average, the same kind of people, and, in so doing, minimized the chance that any hidden third variable was responsible for the obtained results. In this case, random assignment ensured that it was something related to being late that caused such a large proportion of seminarians in the late condition to fail to help the person in need.
Although experimental research can provide answers to questions about causality that purely correlational research cannot, experiments are not without their limitations. One limitation, alluded to earlier, is that sometimes an experiment is simply not possible or wouldn’t be ethical to conduct. We wouldn’t want to assign 10-year-old children to watch lots of violent TV over a long period of time, for example. And we couldn’t randomly assign some people to be married and others to remain single. Nonetheless, causality can sometimes be established in important domains like these. One way to get closer to establishing causality in such situations is by taking advantage of natural experiments. In a natural experiment, events occur that the investigator believes will have causal implications for some outcome. For example, in the early 1970s, the children’s TV show Sesame Street could be viewed by some children but not others because the TV signal was not strong enough to broadcast the show in all areas of the country. Children’s academic performance in their early years of grade school was superior in areas where the show could be viewed than in areas where it could not (Kearney & Levine, 2015). These findings are not decisive, but they strongly suggest that viewing Sesame Street improves school readiness.
Another example of a natural experiment occurred when China introduced several measures to combat air pollution in Beijing in the period just prior to and during the 2008 Olympic games. Children born on a particular day in Beijing in August of that year had higher birth weights than children born on the same day in 2007 and 2009 (Rich et al., 2015). This doesn’t establish causation but it suggests that air pollution negatively affects the health of a fetus.
Social psychologists study phenomena by observational methods, archival research involving records of various kinds, and surveys in which people are asked questions. The validity of surveys typically depends on using respondents who are randomly sampled from the population they represent. Correlational research, in which the investigator establishes whether there is a relationship between two variables, suffers from the problem that the individuals being studied have “chosen” their level on each variable rather than being assigned a level by the investigator. In experimental research, the investigator manipulates an independent variable and observes the effects of the manipulation on a dependent variable.