WHO ARE AMERICANS?
Who Were the Framers of the Constitution?
SOURCES: 1790 census, full data tables, p. 4: www.census.gov/library/publications/1793/dec/number-of-persons.html; Russell Thornton, American Indian Holocaust and Survival: A Population History Since 1492 (University of Oklahoma Press, 1990); Dorothy S. Brady, ed., “Output, Employment, and Productivity in the United States after 1800,” NBER, 1966.
SHOW OVERVIEWHIDE OVERVIEW
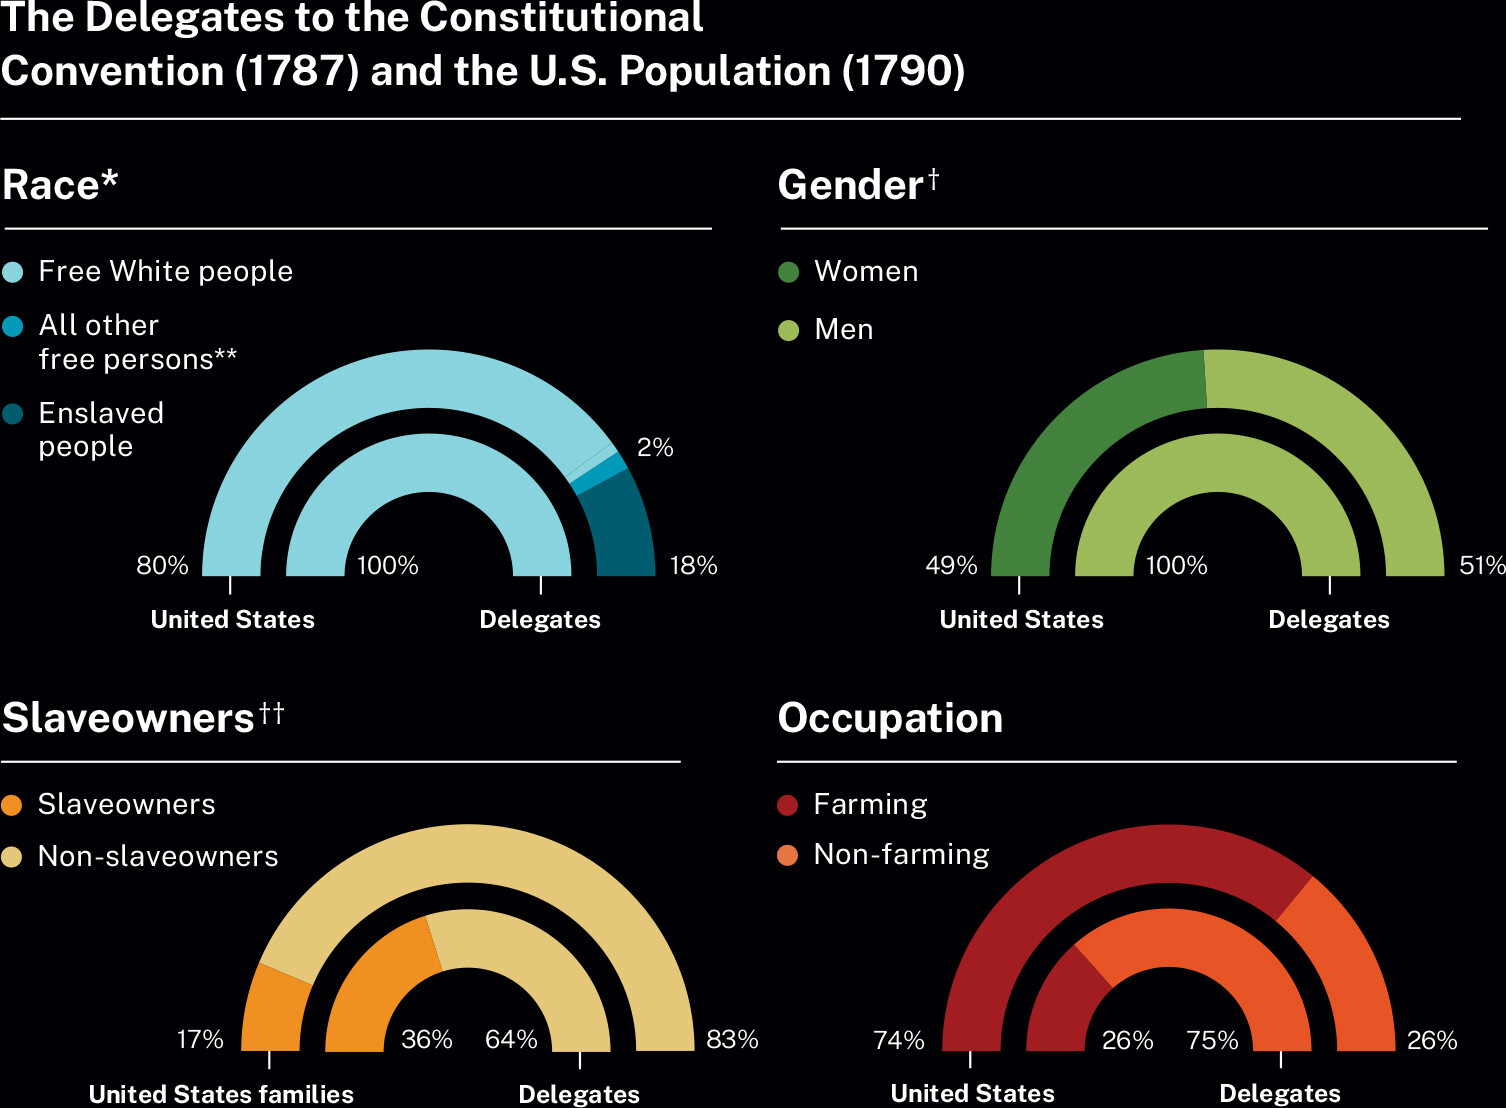
During the drafting and ratification of the Constitution, the demographics of the framers were quite different in comparison to the overall population of the United States. The 55 delegates to the 1787 Constitutional Convention were all White and male, whereas the American people were more diverse. The contrast between who was writing and designing the Constitution (a document that emphasized freedom, equality, and justice) and the composition of the U.S. population overall illustrates the contradictions in American political life and provides the foundation for conflicts and debates we have seen throughout American history.
More information
A Who Are Americans? infographic titled Who Were the Framers of the Constitution? Text reads, Who Were the Framers of the Constitution? During the drafting and ratification of the Constitution, the demographics of the framers were quite different in comparison to the overall population of the United States. The 55 delegates to the 1787 Constitutional Convention were all White and male, whereas the American people were more diverse. The contrast between who was writing and designing the Constitution (a document that emphasized freedom, equality, and justice) and the composition of the U.S. population overall illustrates the contradictions in American political life and provides the foundation for conflicts and debates we have seen throughout American history. Graphics compare makeup of The Delegates to the Constitutional Convention of 1787 with the U.S. Population in 1790, with regard to race, slave-owning status, gender, and occupation. The population was 80% free whites, 2% other free persons, and 18% enslaved persons. The convention delegates were all free whites. Slaveowners represented 17% of the general population but 36% of the convention delegates. The population was 51% male, but all convention delegates were male. Farming was the occupation of 74% of the population but only 26% of the convention delegates. NOTES: The 1790 census had no category to count Native peoples living in the general population, even though an estimated 600,000 Native peoples lived in the United States. The 1790 census defined “all other free persons” as free Black people, people of mixed race, and a small number of Native peoples who lived among White people. For this graphic, slave-owning delegates are delegates who owned slaves at the time of the 1787 Constitutional Convention. The 1790 census only recorded gender data for the White population. There are two questions FOR CRITICAL ANALYSIS. 1. Compare the demographic data of the framers of the Constitution with the overall population data from the time. Do these data confirm or contradict what you know about the framers? Use the data to explain your answer. 2. Do you think the Constitution would be different if the framers were more representative of the population? How so? How well did the framers of the Constitution represent the people? SOURCES: 1790 census, full data tables, p. 4: www.census.gov/library/publications/1793/dec/number-of-persons.html; Russell Thornton, American Indian Holocaust and Survival: A Population History Since 1492 (University of Oklahoma Press, 1990); Dorothy S. Brady, ed., “Output, Employment, and Productivity in the United States after 1800,” NBER, 1966.
* The 1790 census had no category to count Native peoples living in the general population, even though an estimated 600,000 Native peoples lived in the United States.
** The 1790 census defined “all other free persons” as free Black people, people of mixed race, and a small number of Native peoples who lived among White people.
† The 1790 census only recorded gender data for the White population.
†† For this graphic, slaveowning delegates are delegates who owned slaves at the time of the 1787 Constitutional Convention.
NOTE: Numbers may not add up to 100 percent due to rounding.
FOR CRITICAL ANALYSIS
- Compare the demographic data of the framers of the Constitution with the overall population data from the time. Do these data confirm or contradict what you know about the framers? Use the data to explain your answer.
- Do you think the Constitution would be different if the framers were more representative of the population? How so? How well did the framers of the Constitution represent the people?