• Living cells contain an enormously diverse set of protein molecules, each made as a linear chain of amino acids linked together by covalent peptide bonds.
• Each type of protein has a unique amino acid sequence, which determines both its three-dimensional shape and its biological activity.
• The folded structure of a protein is stabilized by multiple noncovalent interactions between different parts of the polypeptide chain.
• Hydrogen bonds between neighboring regions of the polypeptide backbone often give rise to regular folding patterns, known as α helices and β sheets.
• The structure of many proteins can be subdivided into smaller globular regions of compact three-dimensional structure, known as protein domains.
• The biological function of a protein depends on the detailed chemical properties of its surface and how it binds to other molecules called ligands.
• When a protein catalyzes the formation or breakage of a specific covalent bond in a ligand, the protein is called an enzyme and the ligand is called a substrate.
• At the active site of an enzyme, the amino acid side chains of the folded protein are precisely positioned so that they favor the formation of the high-energy transition states that the substrates must pass through to be converted to product.
• The three-dimensional structure of many proteins has evolved so that the binding of a small ligand outside of the active site can induce a significant change in protein shape.
• Most enzymes are allosteric proteins that can exist in two conformations that differ in catalytic activity, and the enzyme can be turned on or off by ligands that bind to a distinct regulatory site to stabilize either the active or the inactive conformation.
• The activities of most enzymes within the cell are strictly regulated. One of the most common forms of regulation is feedback inhibition, in which an enzyme early in a metabolic pathway is inhibited by the binding of one of the pathway’s end products.
• Many thousands of proteins in a typical eukaryotic cell are regulated by cycles of phosphorylation and dephosphorylation.
• GTP-binding proteins also regulate protein function in eukaryotes; they act as molecular switches that are active when GTP is bound and inactive when GDP is bound, turning themselves off by hydrolyzing their bound GTP to GDP.
• Motor proteins produce directed movement in eukaryotic cells through conformational changes linked to the hydrolysis of a tightly bound molecule of ATP to ADP.
• Highly efficient protein machines are formed by assemblies of allosteric proteins in which the various conformational changes are coordinated to perform complex functions.
• Covalent modifications added to a protein’s amino acid side chains can control the location and function of the protein and can serve as docking sites for other proteins.
• Biochemical subcompartments often form as phase-separated intracellular condensates, speeding important reactions and confining them to specific regions of the cell.
• Starting from crude cell or tissue homogenates, individual proteins can be obtained in pure form by using a series of chromatography steps.
• The function of a purified protein can be discovered by biochemical analyses, and its exact three-dimensional structure can be determined by x-ray crystallography, NMR spectroscopy, or cryoelectron microscopy.
Panel 4–3
Cell Breakage And Initial Fractionation Of Cell Extracts
BREAKING OPEN CELLS AND TISSUES
The first step in the purification of most proteins is to disrupt tissues and cells in a controlled fashion.
Using gentle mechanical procedures, called homogenization, the plasma membranes of cells can be ruptured so that the cell contents are released. Four commonly used procedures are shown here.
The resulting thick soup (called a homogenate or an extract) contains large and small molecules from the cytosol, such as enzymes, ribosomes, and metabolites, as well as all of the membrane-enclosed organelles.
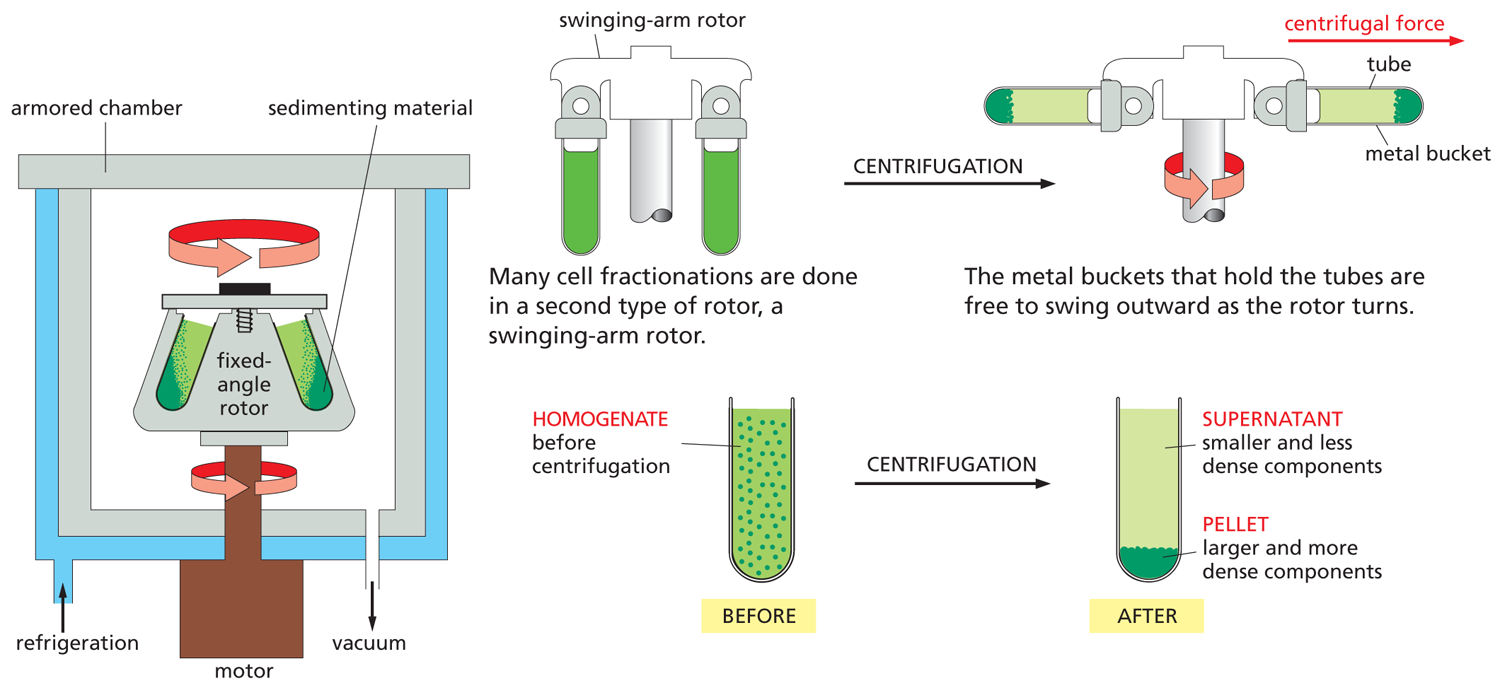
THE CENTRIFUGE
Centrifugation is the most widely used procedure to separate a homogenate into different parts, or fractions. The homogenate is placed in test tubes and rotated at high speed in a centrifuge or ultracentrifuge. Present-day ultracentrifuges rotate at speeds up to 100,000 revolutions per minute and produce enormous forces, as high as 600,000 times gravity.
Such speeds require centrifuge chambers to be refrigerated and have the air evacuated so that friction does not heat up the homogenate. The centrifuge is surrounded by thick armor plating, because an unbalanced rotor can shatter with an explosive release of energy. A fixed-angle rotor can hold larger volumes than a swinging-arm rotor, but the pellet forms less evenly, as shown.
DIFFERENTIAL CENTRIFUGATION
Repeated centrifugation at progressively higher speeds will fractionate cell homogenates into their components.
Centrifugation separates cell components on the basis of size and density. The larger and denser components experience the greatest centrifugal force and move most rapidly. They sediment to form a pellet at the bottom of the tube, while smaller, less dense components remain in suspension above, a portion called the supernatant.
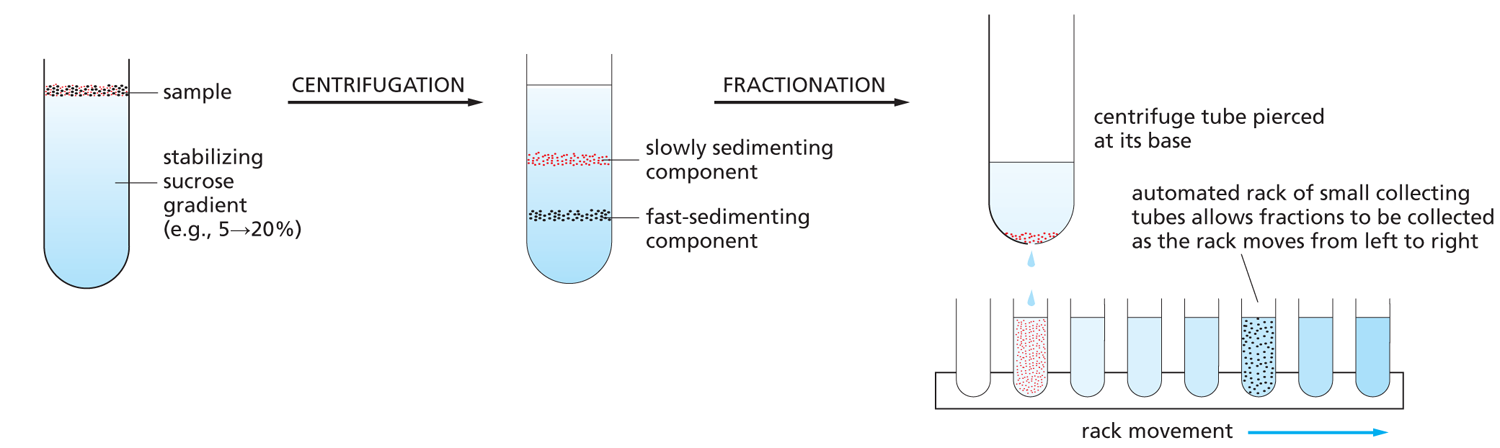
VELOCITY SEDIMENTATION
Subcellular components sediment at different rates according to their size after being carefully layered over a dilute salt solution and then centrifuged through it. In order to stabilize the sedimenting components against convective mixing in the tube, the solution contains a continuous shallow gradient of sucrose that increases in concentration toward the bottom of the tube. The gradient is typically 5→20% sucrose. When sedimented through such a dilute sucrose gradient, using a swinging-arm rotor, different cell components separate into distinct bands that can be collected individually.
After an appropriate centrifugation time, the bands may be collected, most simply by puncturing the plastic centrifuge tube and collecting drops from the bottom, as shown here.
EQUILIBRIUM SEDIMENTATION
The ultracentrifuge can also be used to separate cell components on the basis of their buoyant density, independently of their size or shape. The sample is usually either layered on top of, or dispersed within, a steep density gradient that contains a very high concentration of sucrose or cesium chloride. Each subcellular component will move up or down when centrifuged until it reaches a position where its density matches its surroundings and then will move no further. A series of distinct bands will eventually be produced, with those nearest the bottom of the tube containing the components of highest buoyant density. The method is also called density gradient centrifugation.
A sucrose gradient is shown here, but denser gradients can be formed with cesium chloride that are particularly useful for separating nucleic acids (DNA and RNA).
The final bands can be collected from the base of the tube, as shown above for velocity sedimentation.
Panel 4–4
Protein Separation By Chromatography
PROTEIN SEPARATION
Proteins are very diverse. They differ in size, shape, charge, hydrophobicity, and their affinity for other molecules. All of these properties can be exploited to separate them from one another so that they can be studied individually.
COLUMN CHROMATOGRAPHY
Proteins are often fractionated by column chromatography. A mixture of proteins in solution is applied to the top of a cylindrical column filled with a permeable solid matrix immersed in solvent. A large amount of solvent is then pumped through the column. Because different proteins are retarded to different extents by their interaction with the matrix, they can be collected separately as they flow out from the bottom. According to the choice of matrix, proteins can be separated according to their charge, hydrophobicity, size, or ability to bind to particular chemical groups (see below).
THREE KINDS OF CHROMATOGRAPHY
Although the material used to form the matrix for column chromatography varies, it is usually packed in the column in the form of small beads. A typical protein purification strategy might employ in turn each of the three kinds of matrix described below, with a final protein purification of up to 10,000-fold. Purity can easily be assessed by gel electrophoresis (Panel 4–5).
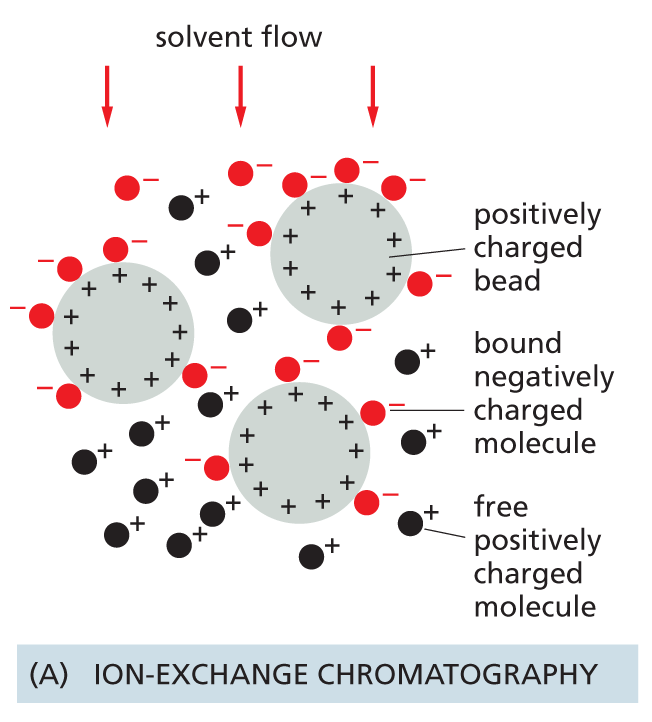
Ion-exchange columns are packed with small beads carrying either positive or negative charges that retard proteins of the opposite charge. The association between a protein and the matrix depends on the pH and ionic strength of the solution passing down the column. These can be varied in a controlled way to achieve an effective separation.
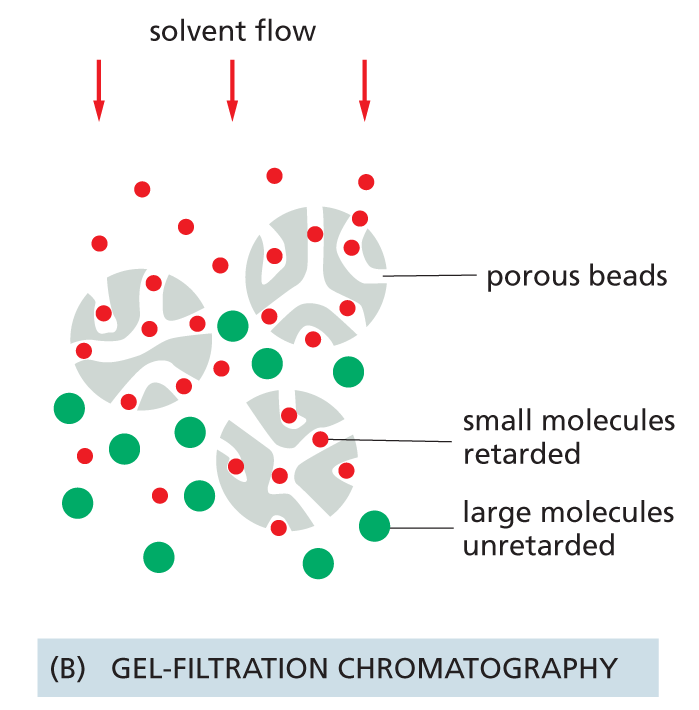
Gel-filtration columns separate proteins according to their size. The matrix consists of tiny porous beads. Protein molecules that are small enough to enter the holes in the beads are delayed and travel more slowly through the column. Proteins that cannot enter the beads are washed out of the column first. Such columns also allow an estimate of protein size.
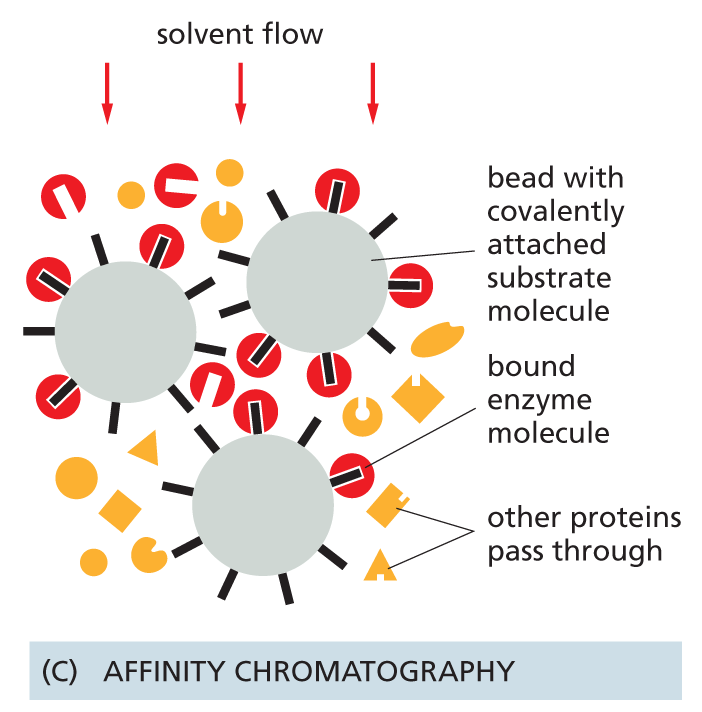
Affinity columns contain a matrix covalently coupled to a molecule that interacts specifically with the protein of interest (e.g., an antibody or an enzyme substrate). Proteins that bind specifically to such a column can subsequently be released by a pH change or by concentrated salt solutions, and they emerge highly purified (see Figure 4–55).
Panel 4–5
Protein Separation By Electrophoresis
GEL ELECTROPHORESIS
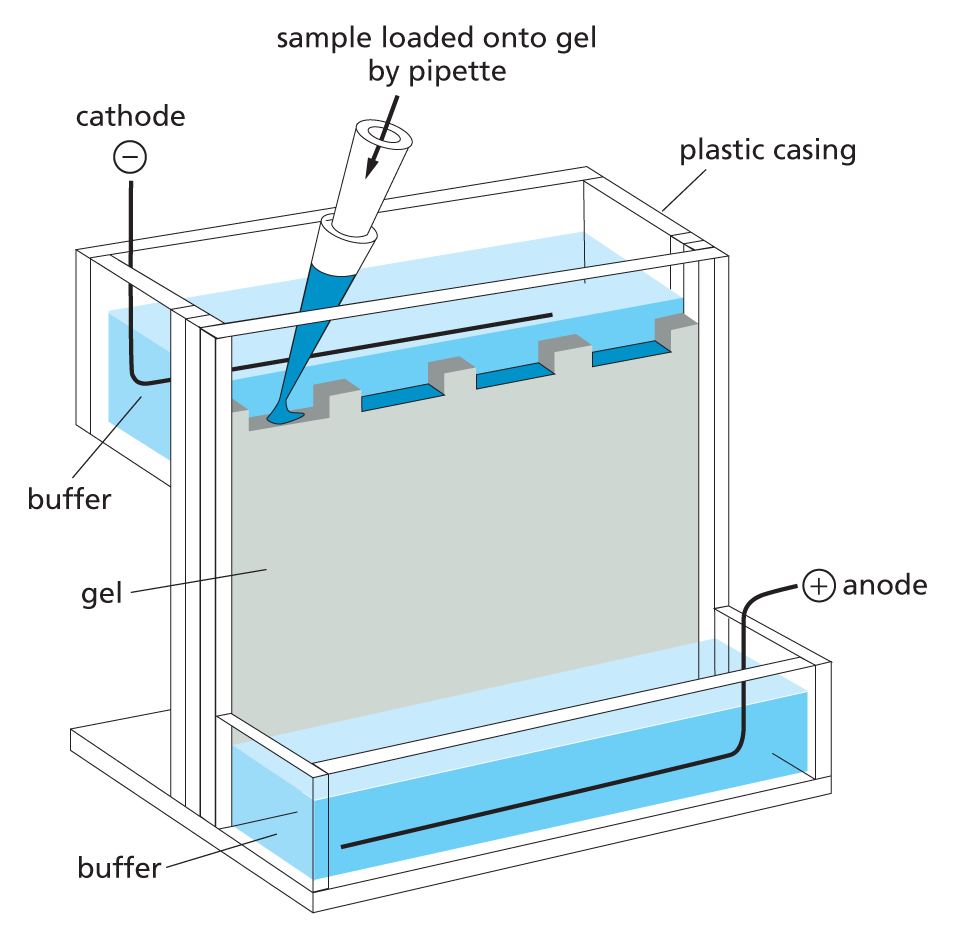
When an electric field is applied to a solution containing protein molecules, the proteins will migrate in a direction and at a speed that reflects their size and net charge. This forms the basis of the technique called electrophoresis.
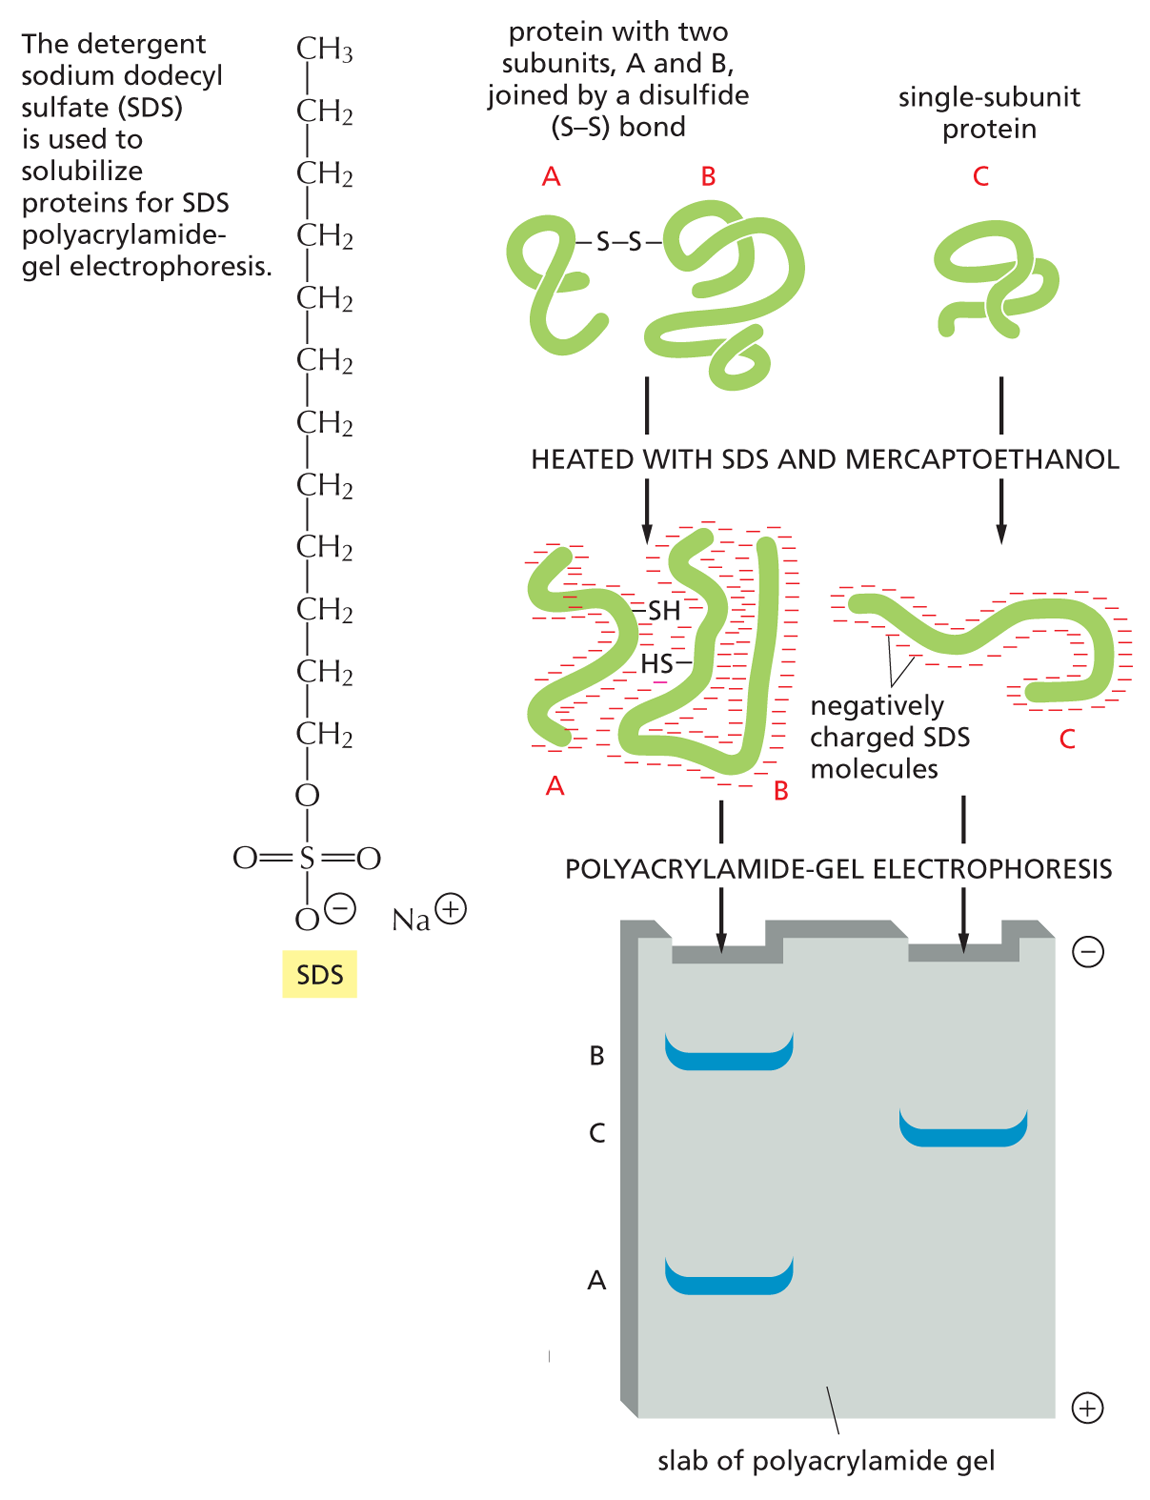
SDS polyacrylamide-gel electrophoresis (SDS-PAGE) Individual polypeptide chains form a complex with negatively charged molecules of sodium dodecyl sulfate (SDS) and therefore migrate as negatively charged SDS–protein complexes through a slab of porous polyacrylamide gel. The apparatus used for this electrophoresis technique is shown above (left). A reducing agent (mercaptoethanol) is usually added to break any S–S linkages within or between proteins. Under these conditions, unfolded polypeptide chains migrate at a rate that reflects their molecular weight, with the smallest proteins migrating most quickly.
ISOELECTRIC FOCUSING
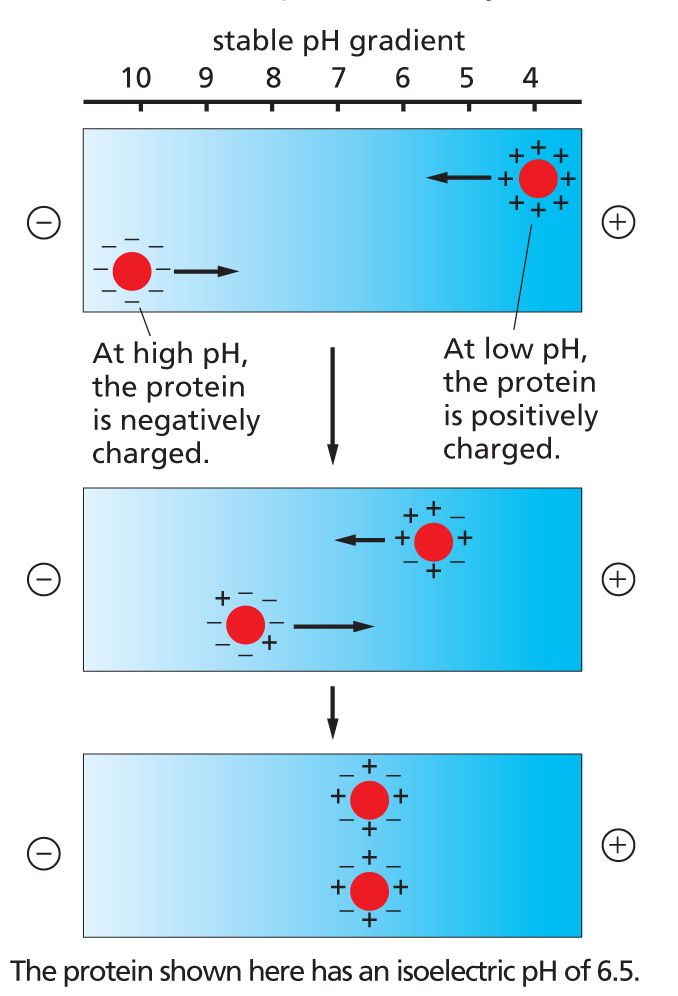
For any protein there is a characteristic pH, called the isoelectric point, at which the protein has no net charge and therefore will not move in an electric field. In isoelectric focusing, proteins are electrophoresed in a narrow tube of polyacrylamide gel in which a pH gradient is established by a mixture of special buffers. Each protein moves to a point in the pH gradient that corresponds to its isoelectric point and stays there.
Complex mixtures of proteins cannot be resolved well on one-dimensional gels, but two-dimensional gel electrophoresis, combining two different separation methods, can be used to resolve more than 1000 proteins in a two-dimensional protein map. In the first step, native proteins are separated in a narrow gel on the basis of their intrinsic charge using isoelectric focusing (see left). In the second step, this gel is placed on top of a gel slab, and the proteins are subjected to SDS-PAGE (see above) in a direction perpendicular to that used in the first step. Each protein migrates to form a discrete spot.
All the proteins in an E. coli bacterial cell are separated in this two-dimensional gel, in which each spot corresponds to a different polypeptide chain. They are separated according to their isoelectric point from left to right and to their molecular weight from top to bottom. (Courtesy of Patrick O'Farrell.)
Panel 4–6
Protein Structure Determination
X-RAY CRYSTALLOGRAPHY
To determine a protein’s three-dimensional structure—and assess how this conformation changes as the protein functions—one must be able to “see” the relative positions of the protein’s individual atoms. Since the 1930s, x-ray crystallography has been the gold standard for the determination of protein structure. This method uses x rays—which have a wavelength approximately equal to the diameter of a hydrogen atom—to probe the structure of proteins at an atomic level.
To begin, the purified protein is first coaxed into forming crystals: large, highly ordered arrays in which every protein molecule has the same conformation and is perfectly aligned with its neighbors. The process can take years of trial and error to find the right conditions to produce high-quality protein crystals. When a narrow beam of x-rays is directed at this crystal, the atoms in the protein molecules scatter the incoming x-rays. These scattered waves either reinforce or cancel one another, producing a complex diffraction pattern that is collected by electronic detectors. The position and intensity of each spot in the x-ray diffraction pattern contain information about the position of the atoms in the protein crystal.
Computers then transform these patterns into maps of the relative spatial positions of the atoms. By combining this information with the amino acid sequence of the protein, an atomic model of the protein’s structure can be generated.
The protein shown here is ribulose bisphosphate carboxylase (Rubisco), an enzyme that plays a central role in CO2 fixation during photosynthesis (discussed in Chapter 14). The protein illustrated is approximately 450 amino acids in length. Nitrogen atoms are shown in blue, oxygen in red, phosphorus in yellow; and carbon in gray. (B, courtesy of C. Branden; C, courtesy of J. Hajdu and I. Andersson.)
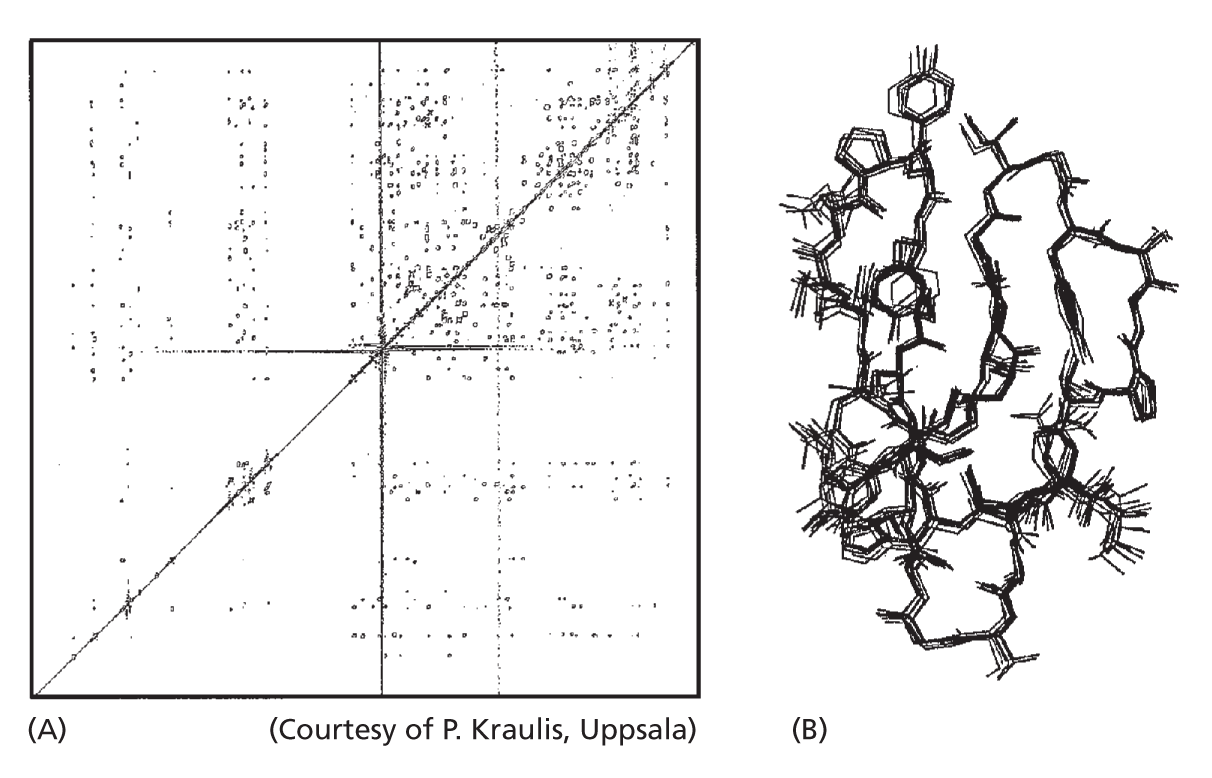
NMR SPECTROSCOPY
If a protein is small—50,000 daltons or less—its structure in solution can be determined by nuclear magnetic resonance (NMR) spectroscopy. This method takes advantage of the fact that for many atoms—hydrogen in particular—the nucleus is intrinsically magnetic.
When a solution of pure protein is exposed to a powerful magnet, its nuclei will act like tiny bar magnets and align themselves with the magnetic field. If the protein solution is then bombarded with a blast of radio waves, the excited nuclei will wobble around their magnetic axes, and, as they relax back into the aligned position, they give off a signal that can be used to reveal their relative positions.
Again, combined with an amino acid sequence, an NMR spectrum can allow the computation of a protein’s three-dimensional structure. Proteins larger than 50,000 daltons can be broken up into their constituent functional domains before analysis by NMR spectroscopy.
In (A), a two-dimensional NMR spectrum derived from the C-terminal binding domain of the enzyme cellulase is shown. The spots represent interactions between neighboring H atoms. The structures that satisfy the distance constraints presented by the NMR spectrum are shown superimposed in (B). This domain, which binds to cellulose, is 36 amino acids in length.
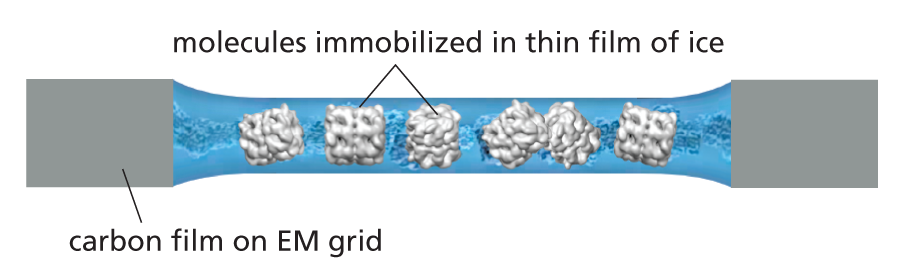
CRYO-ELECTRON MICROSCOPY
X-ray crystallography remains the first port of call when determining proteins’ structures. However, large macromolecular machines are often hard to crystallize, as are many integral membrane proteins, and for dynamic proteins and assemblies it is hard to access different conformations through crystallography alone. To get around these problems, investigators are increasingly turning to cryoelectron microscopy (cryo-EM) to solve macromolecular structures.
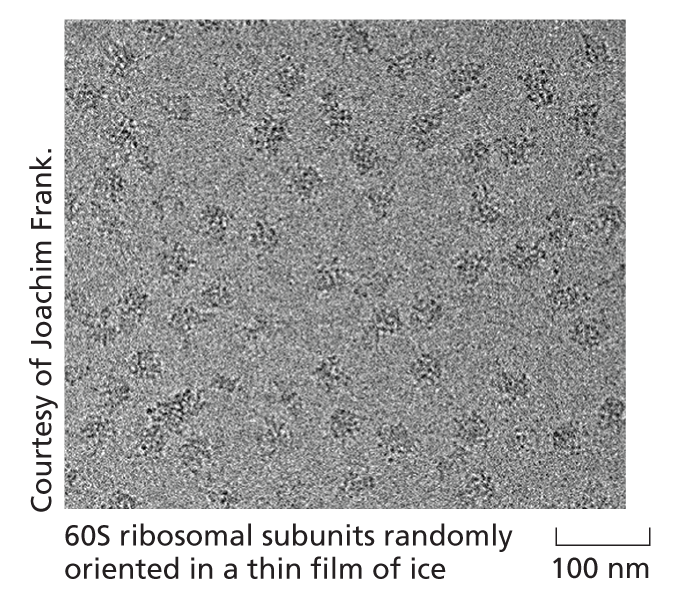
In this technique, a droplet of the pure protein in water is placed on a small EM grid that is plunged into a vat of liquid ethane at −180ºC. This freezes the proteins in a thin film of ice and the rapid freezing ensures that the surrounding water molecules have no time to form ice crystals, which would damage the protein’s shape.
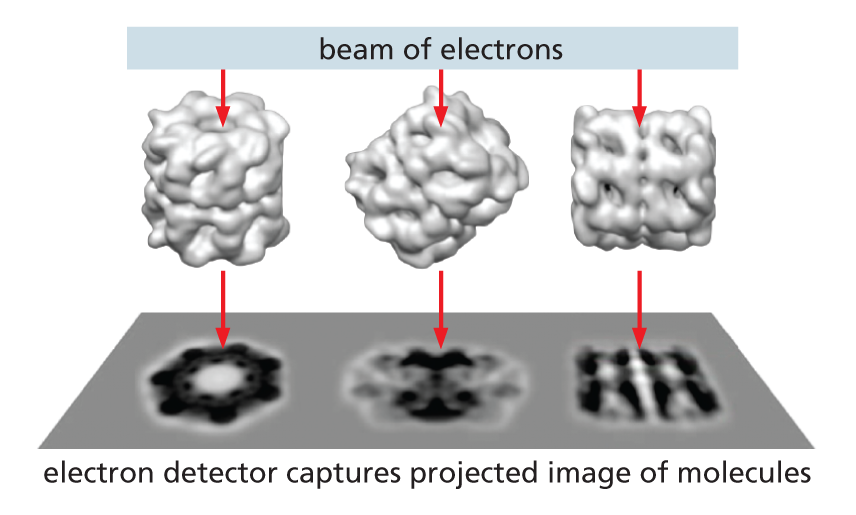
The sample is examined, still frozen, by transmission electron microscopy (see Panel 1−1, p. 13). To avoid damage, it is important that only a few electrons pass through each part of the specimen, sensitive detectors are therefore deployed to capture every electron that passes through the specimen. Much EM specimen preparation and data collection is now fully automated and many thousands of micrographs are typically captured, each of which will contain hundreds or thousands of individual molecules all arranged in random orientations within the ice.
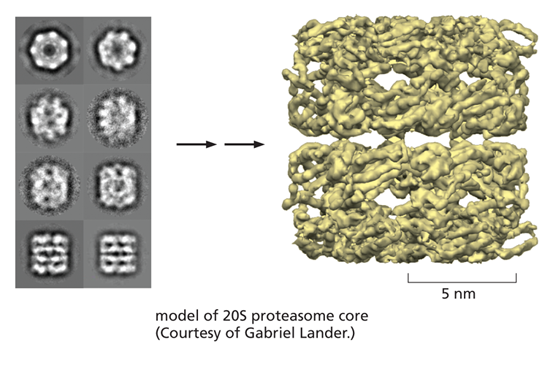
Algorithms then sort the particles into sets that each contains particles that are all oriented in the same direction. The thousands of images in each set are all then superimposed and averaged to improve the signal to noise ratio.
This crisper two-dimensional image set, which represents different views of the particle, are then combined and converted via a series of complex iterative steps into a high resolution three-dimensional structure.
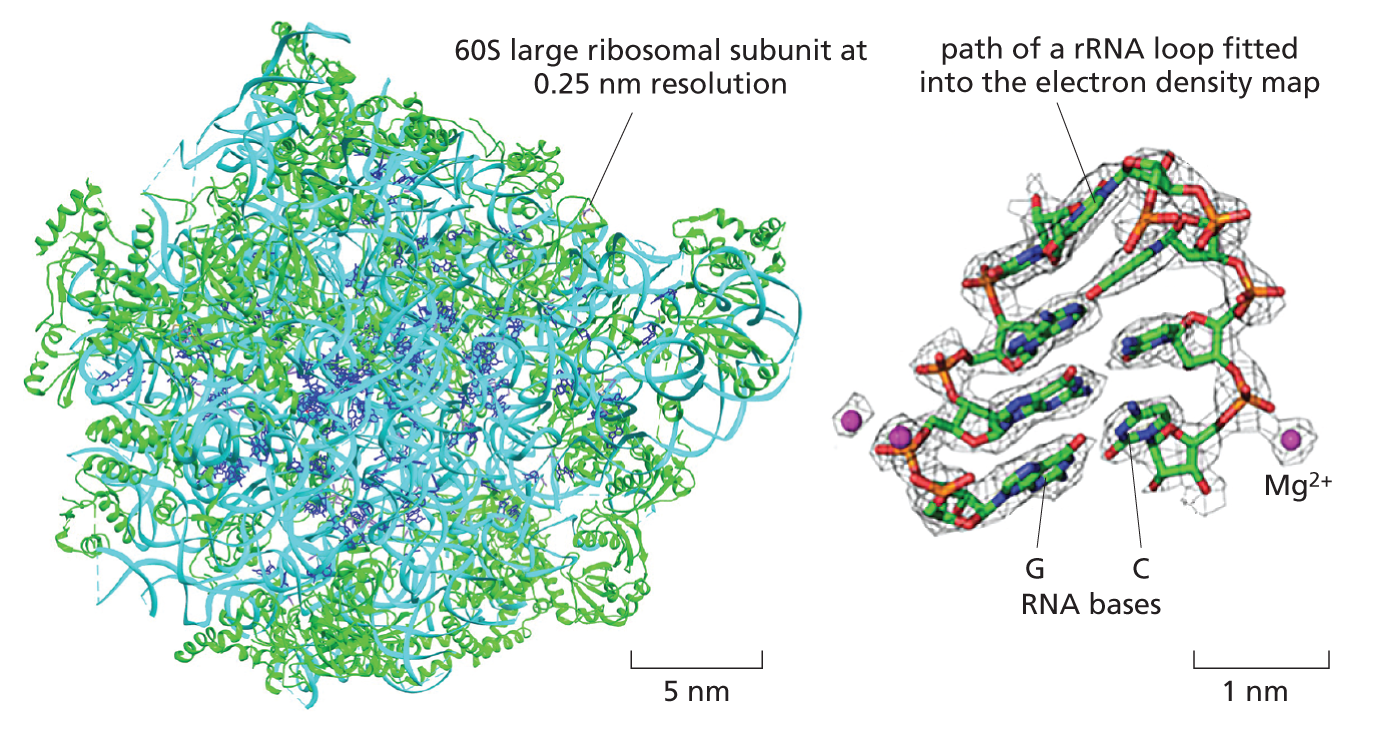
CRYO-EM STRUCTURE OF THE RIBOSOME
Although by no means routine, big improvements in image processing algorithms, modeling tools and sheer computing power all mean that high structures of macromolecular complexes are now becoming attainable with resolutions in the 0.2 to 0.3 nm range.
This resolving power now approaches that of x-ray crystallography, and the two techniques thrive together, each bootstrapping the other to obtain ever more useful and dynamic structural information. A good example is the structure of the ribosome shown here at a resolution of 0.25 nm.