While there are nearly as many different kinds of analysis as there are things to be analyzed, we can identify five common elements that analyses share across disciplines, media, cultures, and communities:
A question that prompts you to take a closer look (p. 239)
Some description of the subject you are analyzing (p. 240)
Evidence drawn from close examination of the subject (p. 242)
REFLECT & WRITE.If you’re working on an analysis project, you’ll want to consider how your draft is making use of the characteristic features outlined in this section. HIGHLIGHT in pink features you feel confident in incorporating into your draft; highlight in yellow features you need to work on. Use the notetaking tool in this ebook to log some brief ideas about how you’ll make use of the features you haven’t yet incorporated.
A Question That Prompts You to Take a Closer Look
Look at the examples cited earlier in this chapter, and note that each is driven by a question that doesn’t have a single “right” answer. What should you wear today? Which set of headphones best meets your needs? How can we begin to achieve interfaith understanding? Each question requires some analysis. While an author may not explicitly articulate such a question, it will drive the analysis—and their writing. In this essay examining the capitalization of “White” when referring to race, see how sociologist Eve L. Ewing provides a prompt that requires taking a closer look:
Multiple well-respected journalistic outlets have announced to much fanfare that, having reflected on the rapidly shifting American racial landscape, they will be capitalizing “Black” as designations for people and cultures. Some have also clarified why they’re not capitalizing “white.” . . . I haven’t always capitalized “White” in my own writing, but I do now. Here’s why.
Whiteness is not only an absence. It’s not a hole in the map of America’s racial landscape. Rather, it is a specific social category that confers identifiable and measurable social benefits. . . . As long as White people do not ever have to interrogate what Whiteness is, where it comes from, how it operates, or what it does, they can maintain the fiction that race is other people’s problem, that they are mere observers in a centuries-long stage play in which they have, in fact, been the producers, directors, and central actors.
Other than the demonstrably untrue idea that White “merely” describes skin color, there are other interesting arguments to consider for keeping it lowercase. For instance, many Black people I know say that they capitalize Black as a show of respect, pride, and celebration, and they don’t want to afford the same courtesy to Whiteness. But we frequently capitalize words for reasons other than respect—words like Holocaust, or Hell, which can be capitalized to indicate specificity or significance. When we ignore the specificity and significance of Whiteness—the things that it is, the things that it does—we contribute to its seeming neutrality and thereby grant it power to maintain its invisibility.
Some outlets have also noted that White supremacist hate groups capitalize White, so we shouldn’t. To that, I respond with an ancient African American proverb: I ain’t studdin’ them.
—EVE L. EWING, “I’m a Black Scholar Who Studies Race. Here’s Why I Capitalize ‘White.’”
Even though Ewing doesn’t pose an explicit question, her early statement—“I haven’t always capitalized ‘White’ in my own writing, but I do now”—invites readers to consider why she’s changed her mind. Then she takes a closer look, providing an analysis of the social conditions that support her stance, as well as an analysis of counterarguments. You might not always start an analytical essay by asking an explicit question, but your analysis will always be prompted by a question of some kind.
Some Description of the Subject You Are Analyzing
To be sure your audience fully understands your analysis, you need to first describe what you are analyzing, focusing on the elements that support your claims. How much description you need depends on your subject, your audience, and your medium. For example, if you’re analyzing gender roles in the Fantastic Four film franchise for your contemporary film course, you can assume most of your audience will be familiar with your subject. However, if you’re analyzing the success of the same films for your marketing class, you will have to describe the elements that make the franchise so successful. See how marketing strategist Shimoli Pandya does so in a piece published on Medium that tackles the question: “What Makes the Marvel Cinematic Universe So Successful?”:
A collage featuring some of the Marvel Cinematic Universe’s vast world of characters.
The Marvel Cinematic Universe currently comprises 23 films, spanning 11 years over three “phases,” each of the movies’ story lines connected to each other. The MCU is the highest earning film franchise of all time with revenue of $21.4 billion. The 22nd movie, Avengers: Endgame, became the highest grossing film of all time at $2.79 billion. . . . Producing a series of movies that span an entire decade demands many things: a sense of consistency, being able to reinvent yourself in terms of the narrative, planning, and marketing.
—SHIMOLI PANDYA, “What Makes the MCU So Successful?”
Writing for this site, Pandya rightly assumes that some of the audience may know little about Marvel, and thus she includes background information as well as an explanation of what draws fans to watch film after film. The author goes on to provide subheads identifying the five major contributors to the movies’ success. Throughout these sections, she provides examples and details about how Marvel’s universe operates that give readers a sense of the epic films. These details support her claim that Marvel became the “highest earning film franchise of all time” due to a variety of critical factors—perhaps chief among them Marvel’s “storytelling genius” and its “universe of characters that mirrors our own [world] . . . [dealing with] problems that many of us face in real life.”
When you’re composing a text that will be read by an audience that may not know your topic well, you’ll also need to provide necessary description and details. You might also include an image, embed a video, or include a link to a site offering more information if the medium you’re writing in allows it.
Evidence Drawn from Close Examination of the Subject
Examining the subject of your analysis carefully and in detail and then thinking critically about what you find will help you discover key elements, patterns, and relationships—all of which provide you with the evidence on which to build your analysis. For example, if you are analyzing a poem, you might examine word choice, rhyme scheme, figurative language, repetition, and imagery. If you are analyzing an ad in a magazine, you might look at the use of color, the choice of typefaces, and the placement of figures or logos. Each element contributes some part of the message being conveyed. The kinds of elements you examine and the evidence you draw from them will depend on the nature of your subject as well as the kind of analysis you are conducting. Following are discussions and examples of five common kinds of analysis: rhetorical analysis, discourse analysis, process analysis, causal analysis, and data analysis.
Rhetorical analysis. This kind of analysis can focus on a written text, a visual text, an audio text, or one that combines words, images, and sound. All of these are rhetorical analyses; that is, they all take a close look at how authors, designers, or artists communicate a message to an audience. Whether they are using words or images, adjusting typeface sizes or colors, they all are trying to persuade a particular audience to have a particular reaction to a particular message—theirs.
See how the following example from an article published on Branding Strategy Insider, a blog about brand strategy, analyzes Nike’s thirtieth anniversary Just Do It campaign and the company’s choice to feature Colin Kaepernick, a former NFL quarterback who sat and knelt during the national anthem at 49ers games in the 2016 season as a protest against the oppression of Black people and people of color:
Is the new Kaepernick 30th Anniversary Just Do It Campaign a smart move for the Nike brand? . . . Perhaps the first question to ask about this campaign from a brand planner’s perspective is: What is it about Colin Kaepernick’s character that Nike finds so important to attach it to the Nike brand?
Developing brand character has many things in common with screenwriting and the attempt to develop relatable characters for film and TV. Relatable characters are . . . sympathetic heroes on a mission to achieve worthy goals. They’re often created as original, attractive, intelligent and provocative, and definitely not cliché, predictable or superficial. They have a definite point of view and a convincing way of getting it across. . . . Above all, relatable characters get people talking about them.
In Nike’s current campaign, Kaepernick has certainly demonstrated that he has character, conviction about his beliefs, concern for social justice and he certainly has people talking about him. But, is he really a sympathetic hero? To segments of society struggling with [or sympathetic to] experiences of social injustice he definitely is. . . . To [others] . . . he carries strong and negative emotional associations.
Risk or Reward? In launching this new campaign Nike is risking alienating a huge segment of its U.S. consumer base, perhaps as much as half. Why would they do that? Perhaps they are thinking that it will tighten the tribe with millennials, who tend to be involved in protest movements, particularly when political leaders and other authority figures are not aligned with their feelings and values. They see Kaepernick as a champion of individual rights, fighting for a sense of social justice. . . .
This campaign will [also] scatter parts of the Nike tribe. . . . These people see not standing for the national anthem at a sporting event as an outward sign of disrespect for the idea of America and all the sacrifices made in the name of the nation. They see the gestures taken by Colin Kaepernick as a sign of questionable character. They see his public gestures as inappropriate and out of place.
—JEROME CONLON, “Analyzing Nike’s Controversial Just Do It Campaign”
In the rest of the article, Conlon goes on to analyze how two different and opposing audiences are likely to react to the ad: those who will “like that Nike is supporting individual athlete rights, acts of moral conscience, conviction and protest,” and those who will see the choice as disrespectful to the American values they embrace. As a former director of marketing for Nike, Conlon also analyzes the advertisement—and its likely impact—by looking at the history of the Just Do It campaign, which was designed to celebrate “the joy of all kinds of sports and fitness activities . . . for everyone, pro sports athletes to fitness amateurs, young and old, men and women, people in America, people around the world. No one was excluded.”
More information
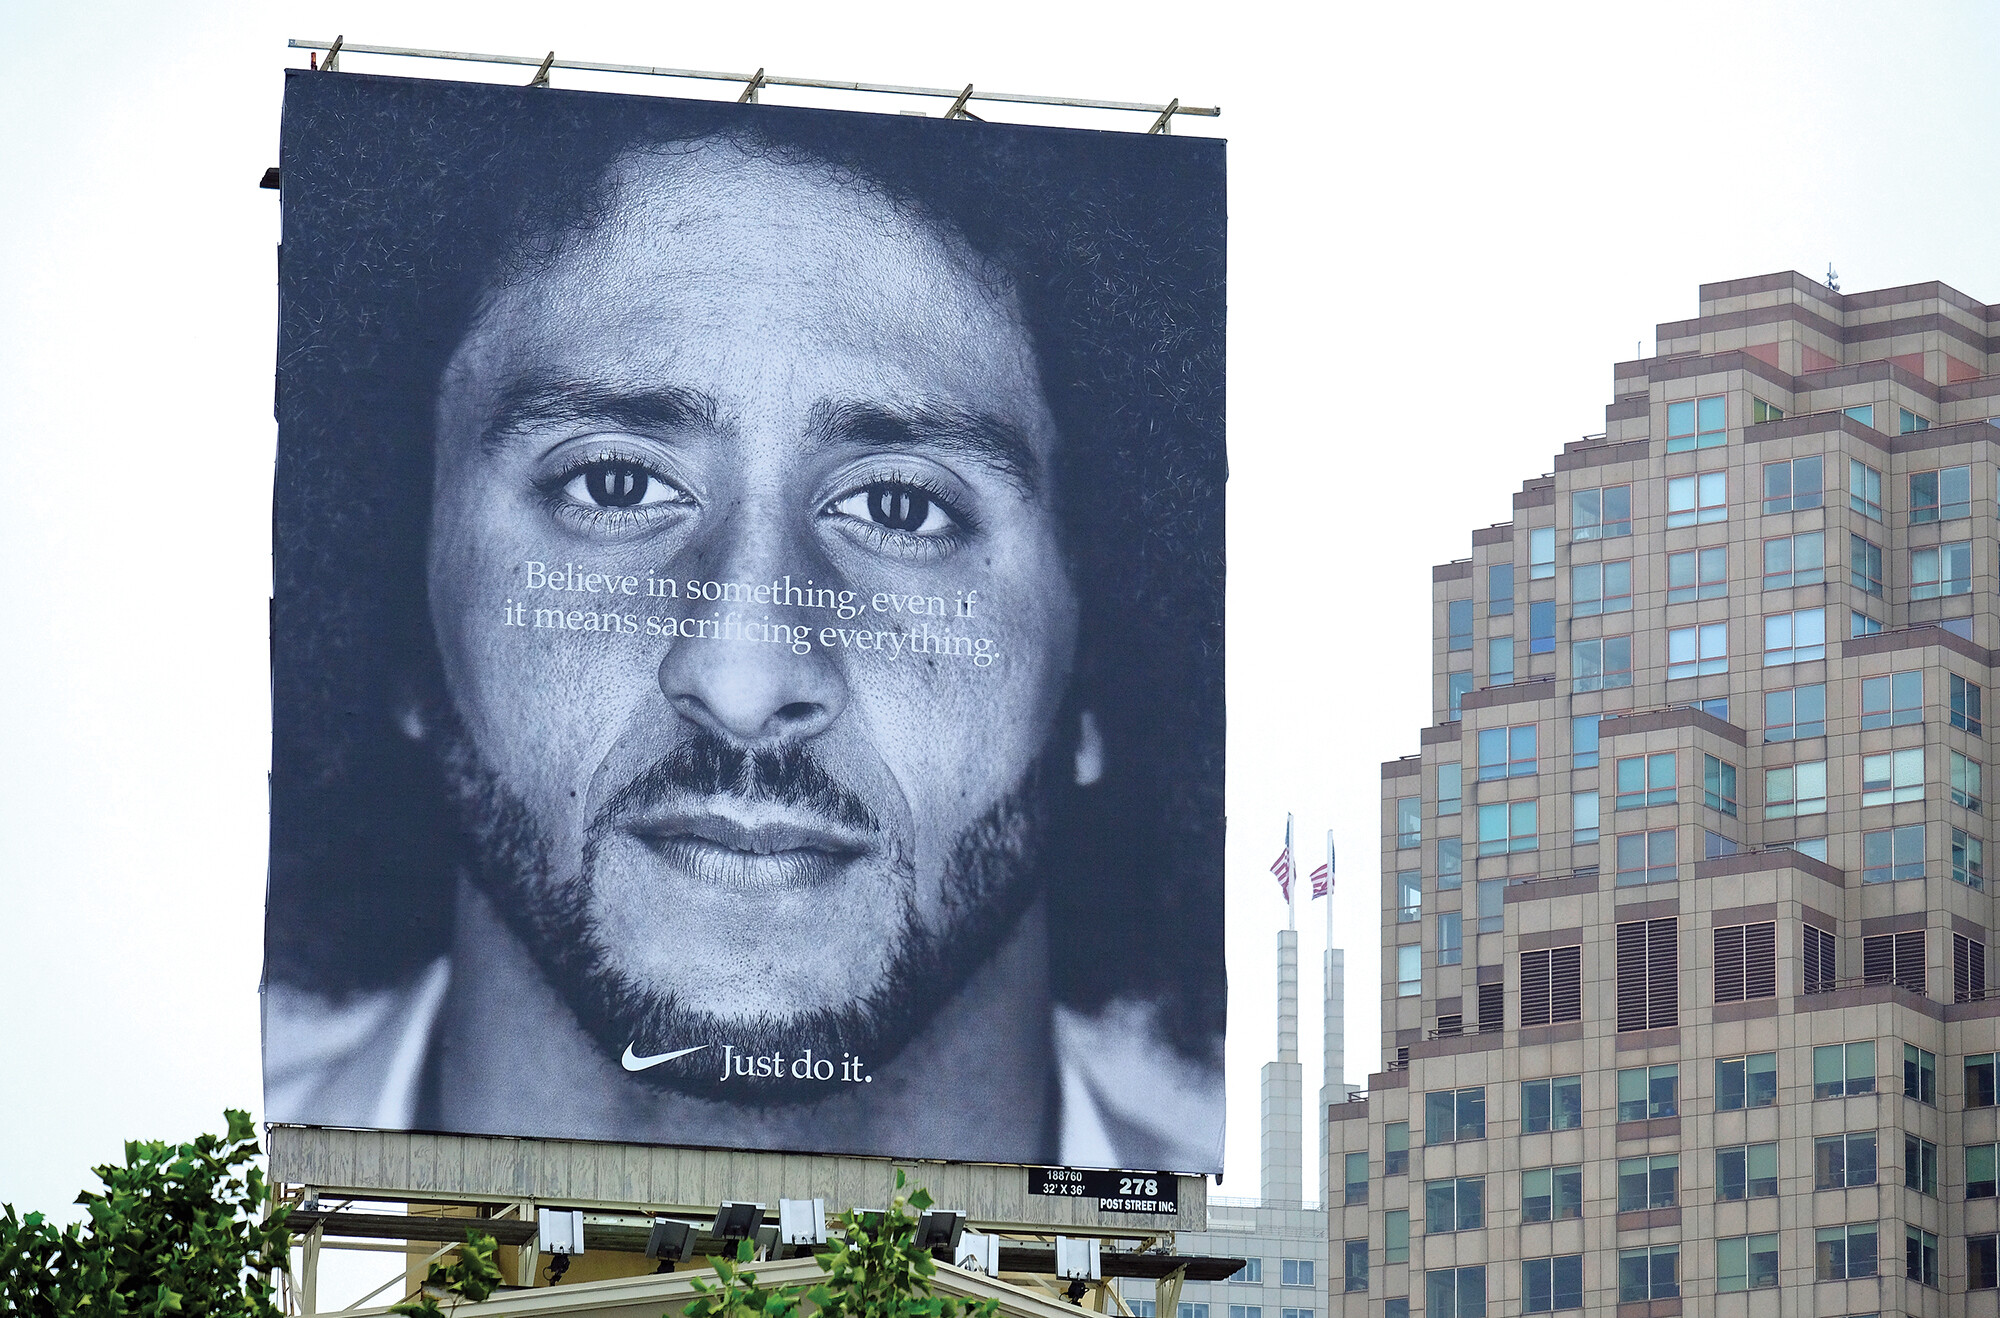
The advertisement features a black and white headshot of Colin Kaepernick looking solemn. White text across his face reads, “Believe in something, even if it means sacrificing everything.” The logo of Nike along with its tagline, “Just do it,” appear in white at the bottom-center of the ad.
Nike’s Just Do It ad campaign featuring former football quarterback Colin Kaepernick. About his controversial gesture, Kaepernick explained, “I am not going to stand up to show pride in a flag for a country that oppresses black people and people of color.”
Conlon concludes with a prediction and wider implications of the ad: “Short-term pain for Nike’s brand, but long-term gain. The social discussion around the campaign will elevate public understanding of the greatness of America and the need for more respect and regard for all people, of all colors and classes.” Note how the author begins with a question and then presents evidence by analyzing the ad’s tone, stance, context, and how all of these elements will play with specific audiences.
In the following example from her study of a literacy tradition in African American churches, rhetorician Beverly Moss uses direct quotations from her field notes to illustrate a key rhetorical pattern she noticed in one preacher’s sermons.
One of the patterns that leapt out at me as I sat in the pew during all the sermons and as I listened to tapes and reviewed fieldnotes was the high level of participation in the sermons by the congregation. . . . It is a pattern that almost any discussion of African American preaching addresses. Just as in the three churches highlighted [earlier], in this church, the congregation and Reverend M. engaged in a call-and-response dialogue. At times during the revival sermons, the feedback from the congregation was so intense that it was impossible to separate speaker from audience. Consider the following exchange. . . .
When you shout before the battle is over (Preach!)
It puts things in a proper perspective (Yeah!)
It puts you in a posture of obedience (Yeah!)
And it puts things in a proper perspective
But finally
When you shout before the battle is fought
It puts the enemy in confusion (Yeah! That’s right!)
The parenthetical expressions, responses from the congregation, do not appear on separate lines because there was little or no pause between the minister’s statement and the congregation’s response. Often, the congregation’s response overlapped with the minister’s statement. This type of feedback was typical in the sermons Reverend M. preached to this congregation, as was applause, people standing, cheering, and so on. Practically every sermon Reverend M. preached ended with the majority of the congregation on their feet clapping and talking back to Reverend M.
—BEVERLY MOSS, A Community Text Arises
Members of a congregation move and shout in response to the preacher’s words.
Moss analyzes and presents evidence from a spoken text. Because she was writing a print book, she could not include the actual audio of the sermon, but still she presents evidence in a way that demonstrates a key point of her analysis: that the closeness of the preacher’s “call” and the congregation’s “response” made it almost “impossible to separate speaker from audience.” This quoted evidence shows a specific example of how the congregation’s response becomes a part of the sermon, filling the church with “applause, people standing, cheering.”
Discourse analysis. This kind of analysis can focus on any spoken or written language used in a particular social context. Discourse analysis often entails analyzing the communication practices of a specific community—people who share basic values, practices, and goals. For example, a community of scholars such as the teachers at your school all likely value education, believe in helping students grow intellectually, and practice their profession by providing instruction to enable students to achieve their goals. You’ve probably noticed that most of your teachers—especially those in a particular discipline or department—share a specific vocabulary. This holds true for any field, any profession, any group of people with shared interests; they develop ways of interacting and communicating most effectively with each other. In order to analyze how a specific group communicates, you’ll examine that community’s practices, an effort that requires careful observation and even immersion when possible.
Look at the following example by Alberta Negri, a student at the University of Cincinnati, that analyzes the communication practices of a local group of bikers. Note how the introduction draws you in with a brief narrative and specific sensory details before offering background information. The author moves from common misperceptions of bikers to her specific subject, a group she refers to as the “Shell Station Squad.” Note that Negri gives a rationale for focusing on this group; she tells readers why it matters.
It’s 8:56 p.m. on a Tuesday evening, and from my third-floor dorm room, I can once again hear the aggressive growls of 600-pound motorcycles as they roll into the parking lot of the Shell station across the street. The riders meet every night around 9:00 and face the usual apprehensive looks from bystanders. . . . Few investigations have been done from within the biking community; even fewer have examined the inner workings of the communication among members. . . . The following research makes the effort to peek into this unexplored group and discuss the less action-packed qualities, including its status as a discourse community, the process of club enculturation, and how a member’s new identity can complicate their previous social roles.
—ALBERTA NEGRI, “Underneath the Leather Jackets and Chrome Pipes: Research into a Community of Local Bikers”
Negri goes on to explain the methods used to conduct her research—including firsthand observation—and then she begins her analysis:
What do these men have in common? The riders of the Shell Station Squad have separate personal lives: full-time gunsmith, engineering firm representative, college student and Call of Duty gamer among them, but they all plan to meet every night and anticipate their 9 p.m. ride all day. Their passion to ride is often their only unifying characteristic. There is no need for them to begin each ride with a preface, stating the goals for the ride for the night, or what they hope to accomplish as a team. There is a simple, unspoken understanding that if you pull into that gas station parking lot, you’re there for the chance to revel in the thrill of weaving through streets on a motorcycle, while flocking as a group to make the experience a little safer for all involved. . . .
Their primary mode of correspondence is Facebook; they use social media to create a private group for discussing matters such as driving routes and safety updates. . . . There is no clear pecking order. The peer-appointed leader never dominated the discourse. More often, he would push for more interaction from those who were recently recruited: addressing questions to them to get individual opinions and inviting them to special weekend rides. [This leader] went as far as directly introducing new riders, saying, “Guys: new kid with us tonight. Thomas is a student at [the university], new rider, let’s make sure to make him feel welcome tonight, alrite? Good kid, i think” [sic] (Lucius). His digital diction was a tad gentler in these interactions compared to his brash joking with the more experienced riders.
Negri analyzes the shared motivations and passions that build kinship among the group members—“the thrill of weaving through streets on a motorcycle”—and acknowledges what sets them apart from one another, too: their personal lives outside of biking. She goes on to examine the group’s way of communicating and building community, in person and online, in order to understand how the community operates. To conduct her analysis, Negri relies on interviews with group members as well as primary texts: text messages, Facebook posts, and hand signals.
Process analysis. Analyzing a process requires you to break down a task into individual steps and examine each one to understand how something works or how something is done. Thus there are two kinds of process analyses: INFORMATIONAL, showing how something works; and INSTRUCTIONAL, telling how something is done. An analysis of the chemistry that makes a cake rise would be informational, whereas an analysis of how to make a cake would be instructional.
The following example analyzes the process of how skaters make high-speed turns. This is the most critical element in speed skating, for being able to consistently make fast turns without slipping can be the difference between winning and losing. This analysis from Science Buddies, a website for students and parents, closely examines the key steps of the process. Note how the author provides some information about the basic physics of speed and turns and then systematically explains how each element of the action—speed, angle, push-back force from the surface—contributes to the total turn.
Whether it’s ice, wood, or a paved surface, the science that governs a skater’s ability to turn is essentially the same. It’s based on a couple of basic laws of physics that describe speed and the circular motion of turns. The first is Newton’s law of inertia that says a body in motion will stay in motion unless there is some outside force that changes it. To skaters hoping to make a turn after they speed down the straightaway, that means the force of inertia would tend to keep them going straight ahead if there wasn’t a greater force to make them change direction and begin turning.
The force that causes the change in direction comes from the skater’s blades or wheels as they cross over at an angle in front of the skater leaning to make a turn. Newton’s law of reaction explains that the push from the skater’s skates generates an equal but opposite push back from the ice or floor. This push back force draws the skater in towards the track and is described as a “center seeking” or centripetal type of force. It’s the reason why turns are possible in any sport. The wheels of a bicycle, for example, also angle into the road surface when the cyclist leans to begin a turn. As the road pushes back on both bike and rider, it supplies the inward centripetal force to generate the turning motion.
The more a skater leans into a turn, the more powerful the push from the skate, and the greater centripetal force produced to carry the skater through the turn. Leaning in also creates a smaller arc, or tighter turn, making for a shorter distance and a faster path around the turn. However, there’s a catch. As the skater leans more and more into the track, the balancing point of the body, or the skater’s center of gravity, also shifts more and more to the side. If it shifts too far, the skater no longer can maintain balance and ends up splayed out onto the rink rather than happily heading round the turn to the finishing line.
More information
The skaters wear helmets, goggles, and suits. They balance the fingertips of their gloved left hands on the icy surface as they skate. The skaters’ bodies are almost parallel to the ice surface. Advertisements appear on a barricade in the background.
Skaters from around the world competing in the 2021 Short Track Speed Skating World Cup.
So success in turns, especially fast ones, means skaters must constantly find their center of gravity while teetering on the edge of their skates. To make the turn at all requires that the skater push the skates against the ice with sufficient power to generate enough inward centripetal force to counter the inertia of skating straight ahead. And to keep up speed in a race, a skater must calculate and execute the shortest, or tightest, turns possible around the track.
—DARLENE JENKINS, “Tightening the Turns in Speed Skating: Lessons in Centripetal Force and Balance”
This kind of close examination of the subject is the heart of analysis. Darlene Jenkins explains the key elements in the process of making a high-speed turn—speed, angle, push-back force—and also examines the relationships among these elements as she describes what happens in minute detail, revealing how they all combine to create the pattern of movement that leads to a successful high-speed turn. By including a photograph that shows skaters leaning into a turn, blades and bodies angled precariously, Jenkins shows what the process entails, and readers can actually see what’s being described.
Causal analysis. Why is the Arctic ice pack decreasing in volume? What causes extreme droughts in California? These and other questions about why something occurs or once occurred call on you to analyze what caused a certain event, the possible effects of an event, or the links in a chain of connected events. Put most simply, causal analyses look at why something happened or will happen as a result of something else.
Behavioral ecologist Karen McComb, who studies communication between animals and humans, wanted to understand why cat owners so often respond to purring cats by feeding them. To answer this question, McComb and a team recorded a number of domestic cats in their homes and discovered what the team termed “solicitation purring”—an urgent high-frequency sound, similar to an infant’s cry, that is embedded within the cats’ more pleasing and low-pitched purring and that apparently triggered an innate nurturing response in their owners. In an article presenting their findings, the team provided quantitative data about the pitch and frequency of different kinds of purring to support their conclusion about what the data showed: that the similarities in pitch and frequency to the cries of human infants “make them very difficult to ignore.”
Using data like these to support an analysis is common in science classes, while in the humanities and social sciences, you’re more likely to write about causes that are plausible or probable than ones that can be measured. In a literature class, for example, you might be asked to analyze the influences that shaped F. Scott Fitzgerald’s creation of Jay Gatsby in The Great Gatsby—that is, to try to explain what caused Fitzgerald to develop Gatsby the way he did. In a sociology class, you might be asked to analyze what factors contributed to a population decline in a certain neighborhood. In both cases, these causes are probabilities—plausible but not provable.
Data analysis. Some subjects will require you to examine data. QUANTITATIVE analysis looks at numerical data; QUALITATIVE analysis looks at data that’s not numerical.
When Beverly Moss analyzed the rhetoric of three ministers, she worked with qualitative data: transcripts of sermons, personal testimonies, her own observations from the church pews. Her data came mostly in the forms of words and text, not statistics.
Now see how blogger Will Moller analyzes the performances of ten major-league baseball pitchers using quantitative data—baseball statistics, in this case—to answer the question of whether New York Yankees pitcher Andy Pettitte is likely to get into baseball’s Hall of Fame.
I prefer to look at Andy versus his peers, because simply put, it would be very odd for 10 pitchers from the same decade to get in (though this number is rather arbitrary). Along that line, who are the best pitchers of Andy’s generation, so we can compare them?
Wins
Win%
WAR
ERA+
IP
K
K/BB
WAR/9IP
Martinez
219
68.7%
89.4
154
2827
3154
4.15
0.28
Clemens
354
65.8%
145.5
143
4917
4672
2.96
0.27
Johnson
303
64.6%
114.8
136
4135
4875
3.26
0.25
Schilling
216
59.7%
86.1
128
3261
3116
4.38
0.24
Maddux
355
61.0%
120.6
132
5008
3371
3.37
0.22
Mussina
270
63.8%
85.6
123
3563
2813
3.58
0.22
Smoltz
213
57.9%
82.5
125
3473
3084
3.05
0.21
Brown
211
59.4%
77.2
127
3256
2397
2.66
0.21
Pettitte
240
63.5%
66.9
117
3055
2251
2.34
0.20
Glavine
305
60.0%
67.1
118
4413
2607
1.74
0.14
The above table tells the story pretty well. I’ve bolded the numbers that are particularly absurd, and italicized one in particular which should act as a veto. Though I imagine most of the readers of this blog know full well what these statistics mean at this point, for those of you who don’t, a primer:
WAR stands for Wins Above Replacement, and is a somewhat complicated equation which estimates the true value of a pitcher, taking into account league, ERA, park effects, etc. For instance, a pitcher that wins a game but gives up 15 earned runs has probably lost value in their career WAR, even though they get the shiny addition to their win-loss record. We like WAR around these parts.
ERA+ is a normalized version of ERA centered on 100, basically showing how much better or worse a pitcher was compared to their league average (by ERA). 110, for example, would indicate that the pitcher’s ERA was 10% better than average. 95, on the other hand, would be roughly 5% worse than average. This is a good statistic for comparing pitchers between different time periods—a 4.00 ERA in 2000 doesn’t mean the same thing as a 4.00 ERA in 1920, for example.
K/BB is how many strikeouts a pitcher had per walk. More is better, less is worse.
As you can see, the above table doesn’t do Andy any favors. He’s 6th in wins and 5th in winning percentage, but he’s 9th in ERA+ and dead last in WAR. His K/BB beats only Tom Glavine, who comes off looking pretty bad on this list. The only thing he has going for him is his playoff record—and frankly, the team he was on won a whole bunch of playoff games while he was on the team, even when he wasn’t pitching. Besides, we’re pretty much past the point of taking W/L record as a good indication of pitcher skill—why is it that when we slap the word “postseason” onto the statistic, we suddenly devolve 10 years to when such things seemed to matter?
—WILL MOLLER, “A Painful Posting”
Moller’s guiding question, “Should Andy Pettitte be in the Hall of Fame?,” is unstated in this excerpt, but it is made clear earlier in the piece. He presents the data in a table for readers to see—and then walks us through his analysis of that data. It’s critical when using numerical data like these not only to present the information but also to say what it means. That’s a key part of your analysis. Using a table to present data is a good way to include numerical evidence, but be careful that you don’t just drop the table in; you need to explain to readers what the data mean and to explain any abbreviations that readers may not know, as Moller does. Though he does not state his conclusions explicitly here, his analysis makes clear what he thinks.
Insight Gained from Your Analysis
One key purpose of an analysis is to offer your audience some insight on the subject you are analyzing. As you examine your subject, you discover patterns, data, specific details, and key information drawn from the subject—which will lead you to some insight, a deeper understanding of the subject you’re analyzing. The insight that you gain will lead you to your thesis. When the sheikh, pastor, and rabbi mentioned earlier in this chapter analyzed a sentence in their book that offended the rabbi, each gained insight into the others’ principles that led them to further understanding. In “I’m a Black Scholar Who Studies Race. Here’s Why I Capitalize ‘White.’,” Eve L. Ewing makes clear the insights she derived from analyzing the reasons for and against capitalizing “White” and especially why she believes it’s an important topic:
Ultimately, it’s good that we’re having this public conversation. Plenty of other scholars who study race and racism will disagree with me on this, and that’s fine. In fact, I disagree with myself from two years ago. . . . I might change my mind again. Language and racial categories have some important things in common: They are fluid, they are inherently political, and they are a socially constructed set of shared norms that are constantly in flux as our beliefs and circumstances change.
The terms we use, and the ways we write them, are less about saying or doing the “correct” thing, the thing that will prevent you from getting flamed on Twitter or earning an eye roll in a staff meeting. Rather, it’s about what we want words to do for us and the arguments we’re trying to make about ourselves and the world through the words we choose.
—EVE L. EWING, “I’m a Black Scholar Who Studies Race. Here’s Why I Capitalize ‘White.’”
Ewing makes clear that the words we use—and how we style them—are powerful tools for reflecting and engaging with the world around us.
Summarizing the study of the way humans react to a cat’s purr, Karen McComb and her team note parallels between the isolation cry of domestic cats and the distress cry of human infants as a way of understanding why the “cry embedded within the purr” is so successful in motivating owners to feed their cats. They conclude that the cats have learned to communicate their need for attention in ways that are impossible to ignore, ways that prompt caring responses from people. Thus, their work suggests that much can be learned by studying animal-human communication from both directions, from animals to humans as well as the reverse.
Remember that any analysis you do needs to have a purpose—to discover how cats motivate their owners to provide food on demand, to understand the power behind word and style choices, to explain why a favorite baseball player’s statistics probably won’t get him into the Hall of Fame. In writing up your analysis, your point will be to communicate the insight you gain from the analysis.
REFLECT & WRITE.Review the chapter so far and identify one or two questions you still have about analytical writing. Either list your questions here using the NOTETAKING TOOL in this ebook, or highlight the text in the chapter that triggered your question and use the notetaking tool to jot down what you want clarified. Be ready to share your questions with your peers.
Clear, Precise Language
Since the point of an analysis is to help an audience understand something, you need to pay extra attention to the words you use and the way you explain your findings. You want your audience to follow your analysis easily and not get sidetracked. You need to demonstrate that you know what you are talking about. You’ve studied your subject, looked at it closely, thought about it—analyzed it; you know what to say about it and why. Now you have to craft your analysis in such a way that your readers will follow that analysis and understand what it shows. Andy Pettitte doesn’t just rank low by his statistics; “he’s 9th in ERA+ and dead last in WAR.” It’s not just that White people don’t have to think about their race while others do: “White people get to be only normal, neutral, or without any race at all, while the rest of us are saddled with this unpleasant business of being racialized.” Like Moller and Ewing, you should be precise in your explanations and in your choice of words.
Analyzing an intricate process or a complicated text requires you to use language that your audience will understand. The analysis of speed skating turns earlier in this chapter was written for an audience of young people and their parents. The language used to describe the physics that govern the process of turning works well for such an audience—precise but not technical. When the author refers to Newton’s law of inertia, she defines “inertia” and then explains what it means for skaters. The role of centripetal force is explained as “the more a skater leans into a turn, the more powerful the push from the skate.” Everything is clear because the writer uses simple, everyday words—“tighter turn,” “teetering on the edge of their skates”—to convey complex science.
You need to consider what your audience knows about your topic and what information you’ll need to include to make sure they’ll understand what you write. You’ll also want to be careful to state your conclusions explicitly—in clear, specific language.
Data that describe something in unquantifiable terms—for example, with DESCRIPTION, ANECDOTES, and other nonnumerical information, including that found through FIELD RESEARCH.
In the Norton Ebook Reader, select some text with your cursor or finger to open the annotation tools for highlighting and taking notes. These tools may function differently on other ebook platforms.
In the Norton Ebook Reader, select some text with your cursor or finger to open the annotation tools for highlighting and taking notes. These tools may function differently on other ebook platforms.