KEYCONCEPT QUESTION
1.2 Describe how anthropogenically driven climate change might affect other behaviors such as migration.
Any scientific endeavor requires that we generate and test alternative hypotheses. Indeed, the scientific process involves a back and forth between testable hypotheses and data used to refine them or discriminate among them (Chamberlin 1897; Mayr 1982, 1983). Evolutionary biologists go about this process using a combination of empirical and theoretical approaches.
Theory plays an important role in shaping and furthering the research agenda of evolutionary biology (Shou et al. 2015). This work often involves creating mathematical models of biological systems. In evolutionary biology, as in science more broadly, mathematical models are used for many different purposes. At the most general level, models help us understand how complicated systems work. A good model does this, in part, by making assumptions that allow us to focus on the critical details of a system, so we can understand how that system operates. Once we do this, we can use our model to make predictions and inferences.
One of the most common uses of models is to make predictions and plan for the future. When we check a weather report, we are relying on a set of models of weather patterns to help us predict what the weather will be like tomorrow and to enable us to make sensible decisions about what to wear and whether to bring along an umbrella. Models from evolutionary biology can be used similarly. For example, when conservation biologists design captive breeding plans for highly endangered species, they use population genetic models (Chapters 7–9) to ensure that they are able to preserve sufficient genetic variation for the species to remain viable.
Another common use of models is to make inferences. Models of processes that we understand in detail help us use observable patterns to infer information that is more difficult to observe directly. When a police officer clocks the speed of a motorist using a radar gun, she is not measuring speed directly. Rather, she is measuring the Doppler shift in radio waves emitted by the gun as they bounce off the target automobile. The radar gun then uses a simple mathematical model to compute a motorist’s speed from the observed Doppler shift. When evolutionary biologists estimate fitness by measuring the change in allele frequencies over time, they are doing something similar: They are using a mathematical model to connect the observable changes in gene frequencies to the less easily observed differences in fitness (we discuss this in more depth in Chapter 7). Similarly, whenever we infer phylogenetic trees from genetic data, we are applying a model of how genetic sequences change over time to observed gene sequences in order to make inferences about evolutionary history (Chapter 5).
Most of this book focuses on empirical research. As we will see, empirical work in evolutionary biology can take many forms, but it almost always falls under one of two categories: observations or manipulations. Observational work entails gathering data to test hypotheses without attempting to manipulate or control the system being studied. Examples include (1) studying the fossil record to test predictions from evolutionary biology, as well as to generate new predictions; (2) inferring evolutionary history from genetic sequences; and (3) recording and measuring behaviors occurring in a natural population of organisms. Observational studies are a powerful form of scientific research, and they have been used to test a myriad of evolutionary hypotheses.
Another approach is to design controlled manipulative experiments to test a hypothesis. These experiments allow a scientist to assess directly how changes in one component of a system influence the other components. Manipulative experiments make it easier to determine causality; that is, to find out what causes what. Ideally, such experiments alter only one variable at a time, so that the investigator can ascertain which changes yield what results.
To examine how empirical studies in evolution work, we will consider a comparison of the human and chimp genomes and explain what this comparison can teach us about primate evolution.
More than 150 years ago, Darwin and his colleague Thomas Henry Huxley hypothesized that humans share a common ancestor with the great apes (chimpanzees, gorillas, and orangutans) and gibbons. Their hypothesis was primarily based on data from comparative anatomy. Darwin and Huxley made inferences about the evolutionary history of humans by comparing the anatomical similarities and differences observed between humans and other primates in such traits as tooth and jaw shape, bone structure of the hands and feet, mode of locomotion, and brain size and structure (Figure 1.14). This work, in part, led Darwin to speculate on where humans evolved. In The Descent of Man, he wrote that:
in each great region of the world the living mammals are closely related to the extinct species of the same region. It is, therefore, probable that Africa was formerly inhabited by extinct apes closely allied to the gorilla and chimpanzee; and as these two species are now man’s nearest allies, it is somewhat more probable that our early progenitors lived on the African continent than elsewhere. (Darwin, 1871, p. 190)
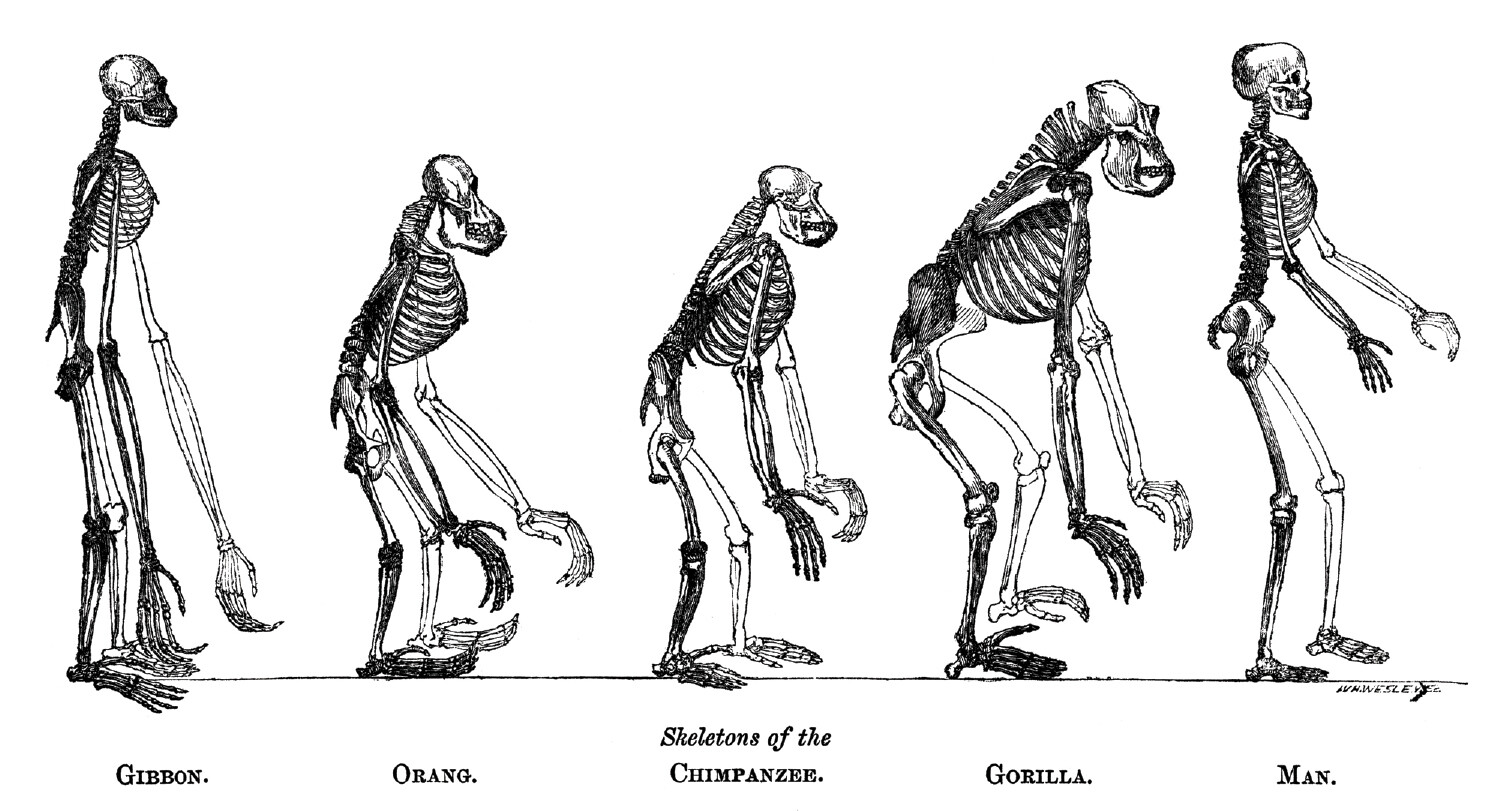
Five primate skeletons, with labeling in an antiquarian typeface. From left to right, the skeletons are those of the gibbon, orangutan, chimpanzee, gorilla, and human. The non-human primates bend forward at the waist to varying degrees, and have longer arms and larger feet and hands. The orangutan and gorilla have larger skulls.
If Darwin and Huxley’s hypothesis is correct—if the great apes are our closest living relatives—data from modern molecular genetics should corroborate the inferences drawn from comparative anatomy. Indeed, this is the case. Evidence from molecular genetics provides strong support for Darwin and Huxley’s hypothesis, with chimpanzees and bonobos (pygmy chimps) as our closest living relatives. Humans and chimps, for example, have very similar genomic structure. They differ by one set of chromosomes: Humans have 23 pairs and chimps have 24 pairs. When high-resolution pictures are taken of human and chimpanzee chromosomes, researchers can see that human chromosome 2 is the result of a fusion of two chromosomes at some point in human evolutionary history (Yunis and Prakash 1982) (Figure 1.15). Subsequent molecular genetic analyses, in which the DNA sequences from chromosome 2 in both chimps and humans were lined up and compared—nucleotide by nucleotide—has shown researchers the exact location where the chromosomal fusion occurred (Fan et al. 2002).
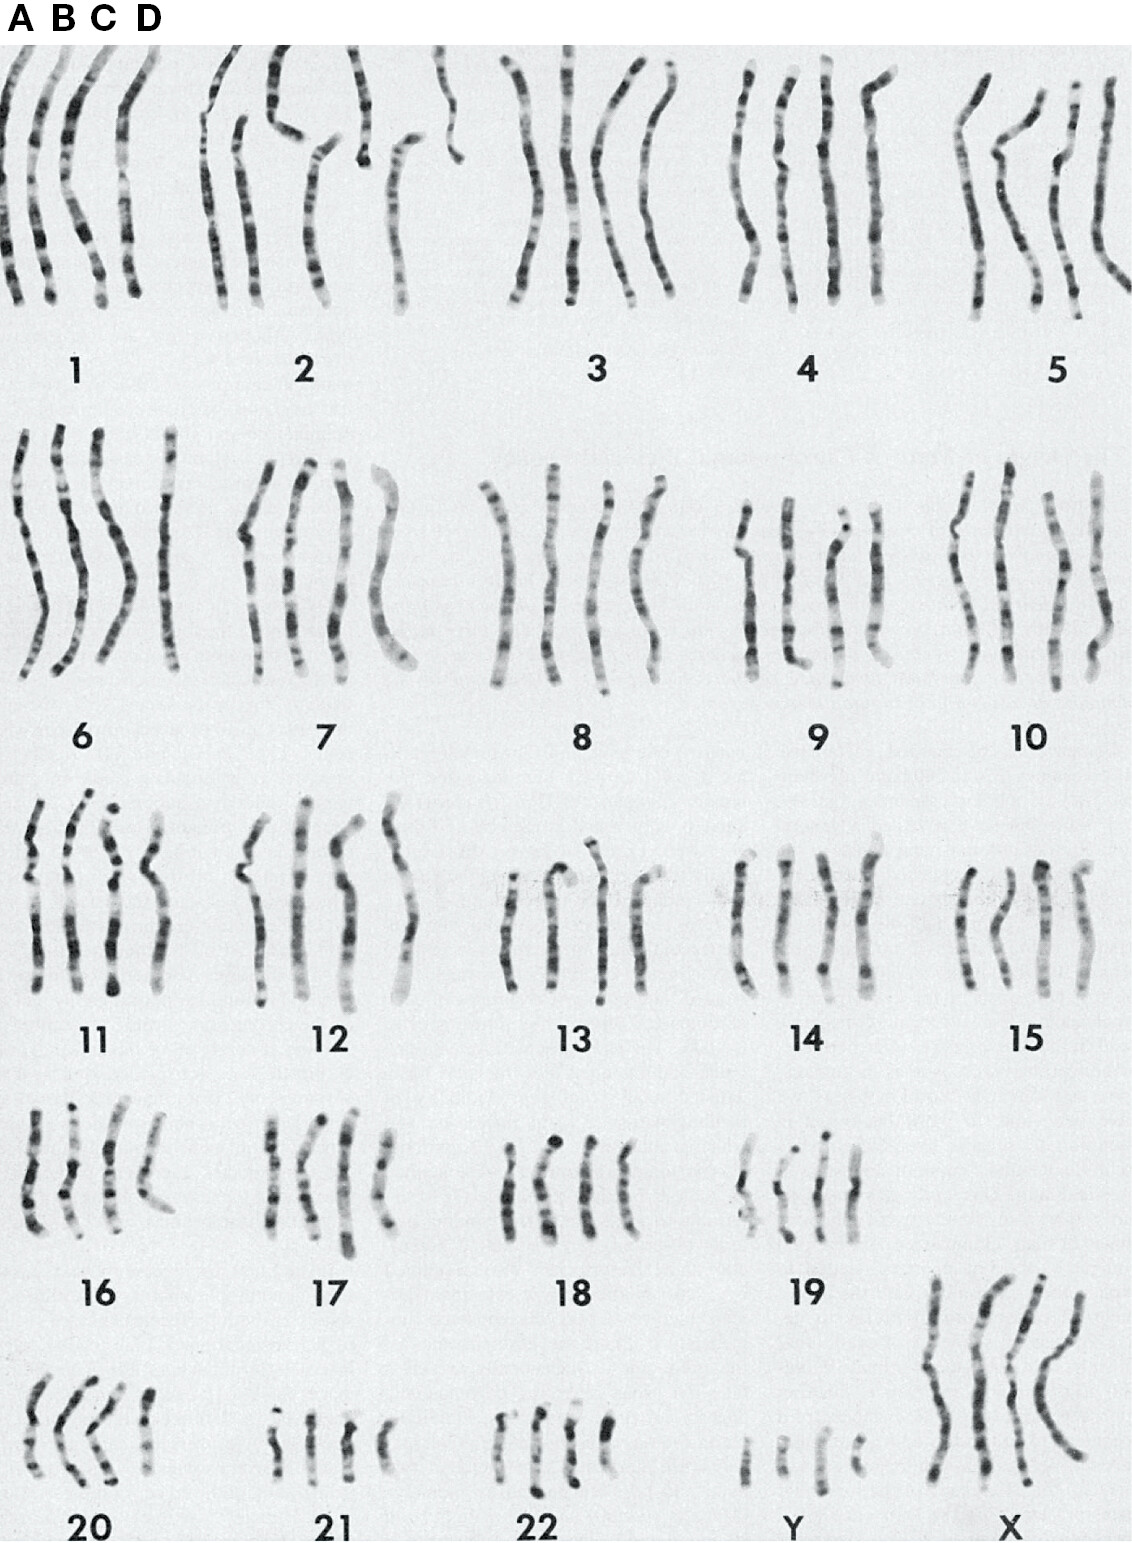
Chromosomes in groups labeled one through 22 as well as X and Y are shown. Every group contains four chromosomes, A through D, except group 2, which has seven chromosomes, two each under B, C and D. The order of the chromosomes corresponds to their length: chromosome one is the longest, while chromosome 22 is the shortest, with the exception of the Y chromosome, which is shorter. While the different species chromosomes are of very similar lengths, they differ somewhat at various points in their conformations and gene densities along their lengths.
The entire genomes of both the chimpanzee and the human have now been mapped out in great detail, which allows us to make unprecedented molecular genetic comparisons to examine questions of primate evolution (Mikkelsen et al. 2005; Khaitovich et al. 2006). Tarjei Mikkelsen and his colleagues in the Chimpanzee Sequencing and Analysis Consortium mapped out approximately 95% of the chimpanzee genome (from eight chimpanzees) and compared that with the human genome (mapped out from a small set of humans). A whole-genome comparison of DNA nucleotides found that humans and chimps differ by about 1.3%, although comparisons of specific sections of the genomes reveal that the DNA sequences differ more in some areas and less in others (Figure 1.16).
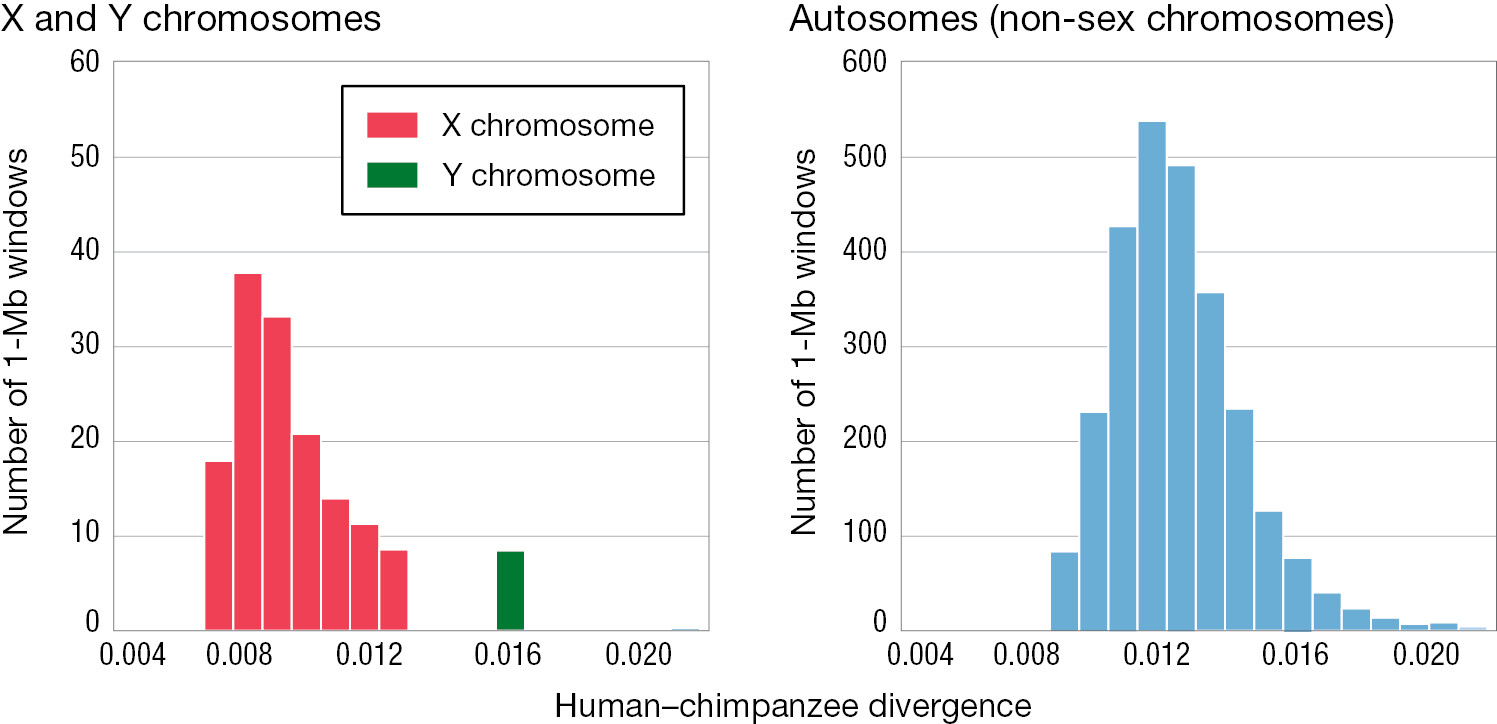
Two bar graphs illustrating human-chimpanzee genetic divergence from 0.004 to 0.020 on the x axis. The first graph shows the x and y chromosomes with the y axis representing “Number of one-megabase windows,” and runs from 0 to 60. Seven bars represent divergences on the X chromosome, with levels of divergence from 0.007 to 0.012 and one-megabase windows ranging from 9 to 38. At peak, 38 one-megabase windows diverge at the level of 0.008. One bar represents divergence on the Y chromosome. Eight one-megabase windows diverge by 0.016. The second graph illustrates human-chimpanzee divergence on autosomes, or non-sex chromosomes. Its y axis, labeled “Number of one-megabase windows,” runs from 0 to 600. Divergences on autosomes follow a standard distribution ranging from 0.008 to 0.020, and one-megabases ranging from 1 to 525, with a peak of 525 one-megabase windows at the divergence level of 0.012. From there the bars decrease to become shorter and shorter.
When Mikkelsen’s group compared 13,454 pairs of genes in humans and chimpanzees, they began by calculating how much we would expect the human and chimp genomes to differ because of the accumulation of neutral mutations; that is, genetic changes that have no effect on fitness. The number of neutral mutations served as a baseline value that accounted for differences between the human and chimp genomes that were not caused by natural selection.
Once these neutral genetic differences were accounted for, Mikkelsen and his colleagues could search for evidence of differences between chimps and humans that resulted from natural selection by examining whether some genes diverged, that is changed in one species relative to the other at higher rates than expected in the absence of selection. When they found such genes, Mikkelsen and his team could often correlate these increased rates of divergence with known functions of the genes in question. This type of analysis found evidence for rapid evolutionary changes as a result of natural selection. These included genetic changes in humans associated with increased resistance to a bacterium that causes tuberculosis and a protozoan that causes malaria.
If chimpanzee and human genomes differ by only about 1.3% at the level of DNA base pairs, then how can we explain the dramatic differences in appearance and behavior between humans and chimps? Part of the answer involves differences in the expression of genes. To understand the power of gene expression—which genes are turned on and off, and the timing of when they are turned on and off—remember that every cell in your body has the same set of genes. But skin cells look, feel, and act differently than muscle cells, liver cells, and so on, because of differences in the expression of genes in these different cell types.
The way in which genes are expressed in humans and chimps may in part explain why chimps and humans look and act so differently, despite limited divergence at the level of DNA base pairs (Khaitovich et al. 2005, 2006; Suntsova and Buzdin 2020). Philip Khaitovich and his colleagues at the Max Planck Institute for Evolutionary Anthropology measured gene expression of 21,000 genes in heart, liver, and kidney tissues in both humans and chimps. They found evidence suggesting that in these tissues, the gene expression differences between human and chimps are small enough to be explained by random neutral changes. In contrast, they found much larger differences in gene expression and much stronger evidence for natural selection when they compared gene expression in the cells of human and chimp testes. Divergence in gene expression in the testes is likely a result of the very different mating systems—the way in which reproductive behaviors are structured in a population—seen in humans and chimps (Harcourt et al. 1981; Kappeler and van Schaik 2004).
Khaitovich and his team also examined gene expression in the brains of humans and chimps (Khaitovich et al. 2006; Somel et al. 2013). Here the results were surprising. Given the evolution of language and other cognitively sophisticated traits in humans, we might expect high divergence in gene expression in the brains of humans and chimps (Dorus et al. 2004). Yet, this was not the case. Indeed, divergence in gene expression between the brains of humans and chimps was quite small compared to differences in gene expression in other organs. There is, however, some subtle evidence that natural selection has operated on gene expression in the brain during human evolution. Although the divergence in gene expression in the brains of humans and chimps is low, much of the difference that does exist appears to arise from natural selection on humans, not chimps, suggesting selection for brain function in humans relative to other primates. When Khaitovich and his team compared gene expression in both humans and chimps to gene expression in other mammalian species, they found evidence that, although there were relatively few changes in gene expression in the brains of humans versus chimpanzees, the changes that had occurred were large in magnitude and more often arose from changes in the human brain rather than in the chimp brain. This result highlights a question that has been central to evolutionary biology since the time of Darwin and which studies in evolutionary genomics are slowly starting to unravel: Does major evolutionary change occur as a result of a large number of mutations with modest effects or a small number of mutations that have large effects? We return to this question in later chapters.
This study offers a glimpse of how researchers investigate the evolutionary process and its consequences. There are literally tens of thousands of observational and experimental studies of evolution in the literature, including, most recently, studies of evolution in the Anthropocene era.
With the drastic environmental changes associated with climate change caused by human activity, human population growth, large-scale production of toxins, and more, many scientists argue we are now living in the Anthropocene era. Although the starting date is contentious, the Anthropocene Working Group formed by the International Commission on Stratigraphy (involved in naming geological time periods) suggests that the Anthropocene began in the mid-twentieth century.
The ongoing and accelerating changes of the Anthropocene era affect the speed at which evolution occurs, which traits are favored by natural selection, the relationship between artificial and natural selection, the processes of speciation, extinction, migration, and more. Here we will discuss a few studies that touch on topics that we return to many times in the book: reproductive success, genetic variation, and migration.
Anthropogenically driven climate change, largely the result of increased emission of CO2, has led to dramatic changes in annual temperatures all over the planet. Temperature, in part, determines when many animals and plants reproduce. Consider tree swallows (Tachycineta bicolor). Across the United States, as spring thaws have been arriving earlier and earlier, tree swallows have advanced the start of breeding by an average of 9 days between 1950 and 1990. In Ithaca, New York, where the average temperature has increased about 1.9°C during the spring, Ryan Shipley and his colleagues (Shipley et al. 2020) found that tree swallows advanced the start of their breeding by 13 days between 1972 and 2015 (Figure 1.17).
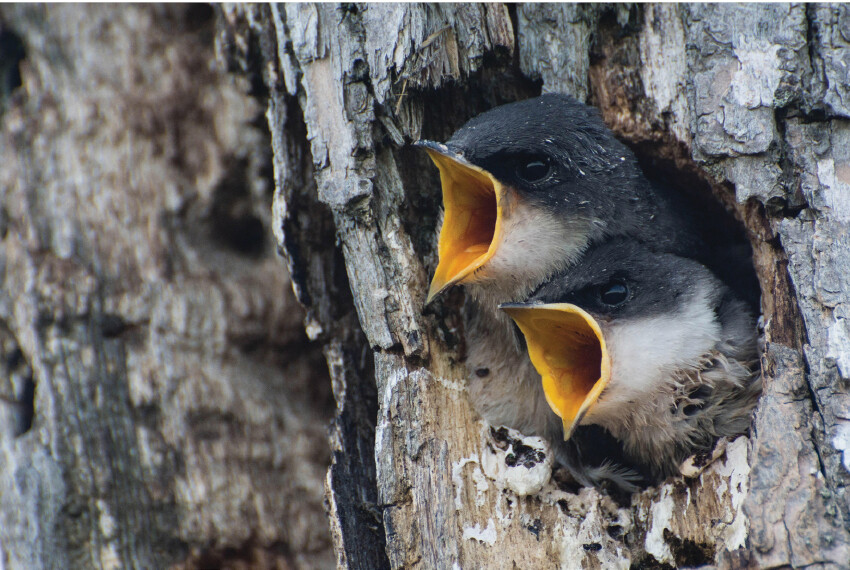
Two tree swallow chicks beg for food.
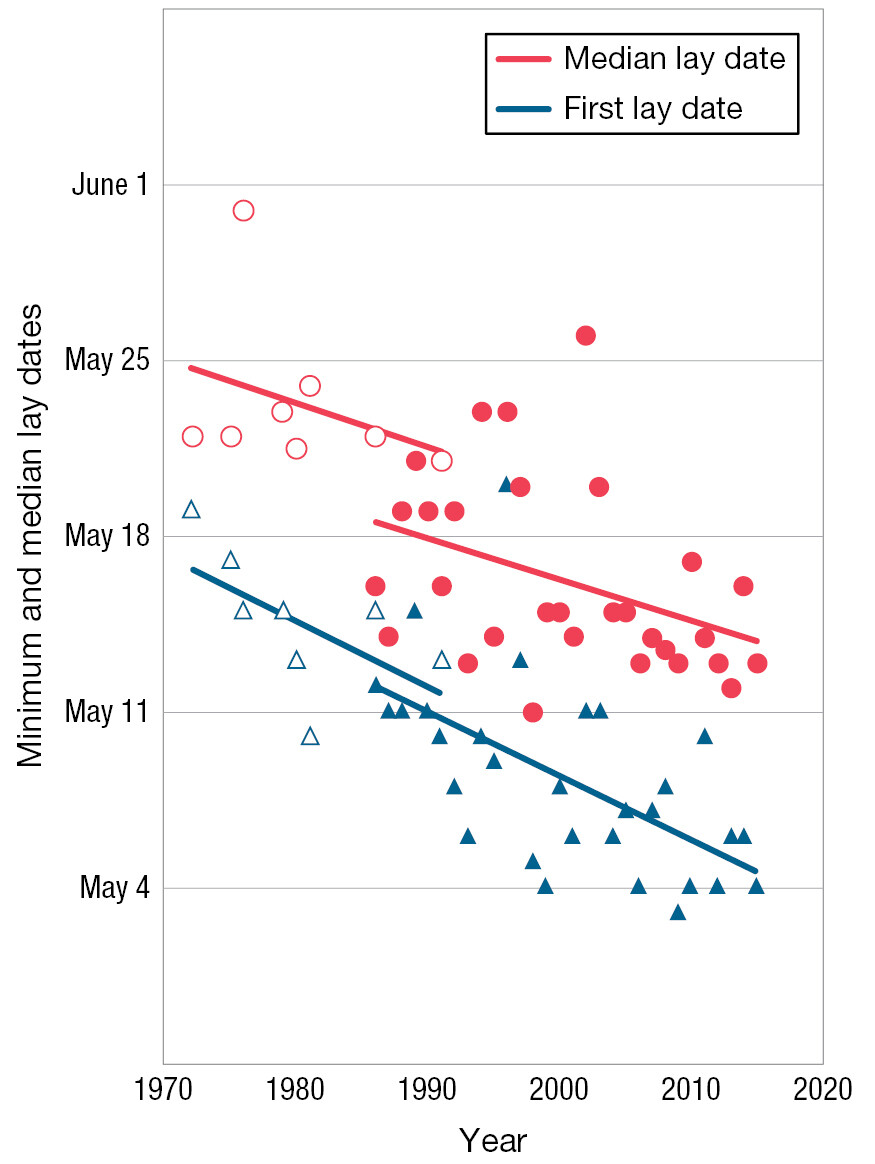
Earliest and median egg laying dates at two tree swallow sites. A scatterplot with trend lines shows that the first lay date was 17 or 18 May in 1970 but by the mid 2010s was May 4 or 5. The median lay date was May 25 in 1970 but by the mid 2010s was May 14.
As the climate shifts, the cues that swallows use to time their migration and breeding have become mismatched to the conditions that they experience upon arrival. This mismatch imposes a serious cost on the birds. By breeding earlier in the season, they risk being exposed to cold snaps. The problem with cold snaps is not that swallows suffer from the low temperatures directly, but rather that their food source, flying insects, reduce their activity during periods of unusual cold. Parents are then unable to find enough food for their brood, which has significant effects on hatchling survival and fitness. Shipley and his colleagues found that tree swallow nestlings hatched between 2011 and 2015 were twice as likely to experience a cold snap during their early development as birds hatched in the 1970s, resulting in an increase in the number of complete nest failures. One cold snap in early June 2016 resulted in the death of all chicks in 71% of nests.
KEYCONCEPT QUESTION
1.2 Describe how anthropogenically driven climate change might affect other behaviors such as migration.
As we will explore in much more depth in later chapters, genetic variation within populations is the fuel that feeds natural selection; without it, there is nothing for nature to select among. Chloé Schmidt and her colleagues examined the effect of urbanization on genetic diversity in both mammals and nonmigratory birds (Schmidt et al. 2020). Using data from 85 published studies, involving more than 40,000 animals sampled across 1,006 sites in the United States, they compared population size, genetic variation in populations, and genetic variation between populations in urban and rural habitats. They also made a similar comparison using the Human Footprint Index, a composite index that takes into account human population density, land use, infrastructure (for example, nighttime lights, and land use and land cover), and access (roads, railroads, navigable rivers, and so on).
For the 25 bird species they analyzed, Schmidt and her colleagues found no anthropogenic effects on genetic diversity within or between populations. The results were markedly different for mammals. In mammals, genetic diversity (both the diversity of genes and the number of different variants for a given gene) within populations was significant lower in urban locations compared with rural areas and where the Human Footprint Index was large as opposed to small. For these 41 species of mammals, anthropogenic effects are exhausting the variation upon which natural selection acts. In addition, genetic variation among populations increased in both urban areas and when the Human Footprint Index was large, suggesting that another effect of anthropogenic change is the differentiation of populations within the same species.
One likely reason for the differentiation of the mammalian populations in the Schmidt et al. study is the reduction in both short-range and longer-range movement in urban areas, and more generally, areas with a large human footprint. Although Schmidt’s team did not explicitly look at this, Marlee Tucker and her colleagues have (Tucker et al. 2018). Using Global Positioning System (GPS) data gathered on 803 individuals from 57 species of mammals, they found that the median amount of movement in areas with a large human footprint averaged one-half to one-third the extent of such movements in low footprint areas (Figure 1.18). Their statistical analysis suggests two factors that help explain the reduction: individual animals exhibit behavioral changes and species with long-range movements are more likely to be excluded from regions with a large human footprint.
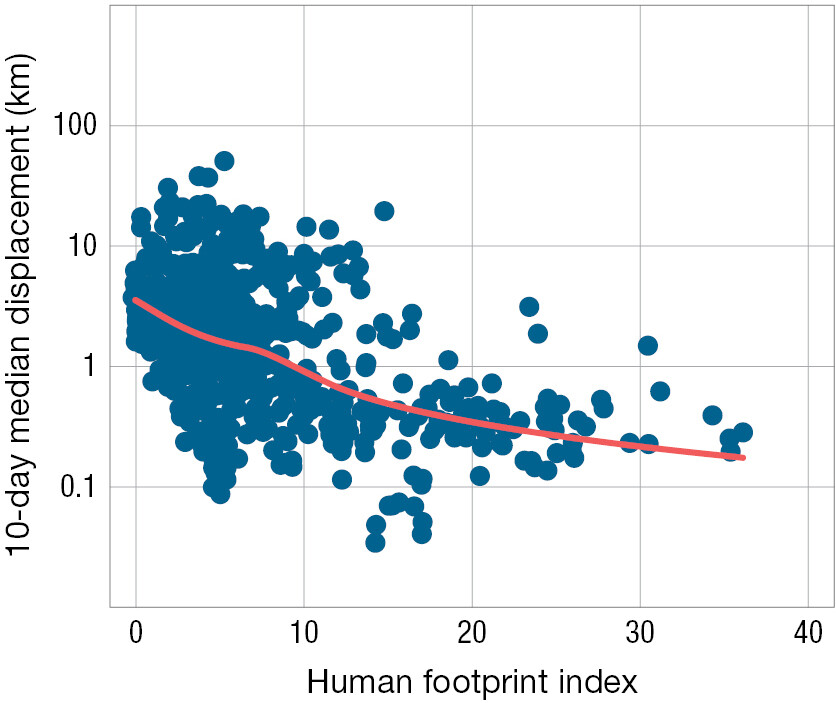
A scatterplot relating movement in mammals to the human footprint index. The 10-day displacement declines dramatically as the human footprint index increases.
Anthropogenic factors (e.g., human population density, human appropriation of wildlife habitat, and increased average temperature) are also affecting which mammalian species are thriving and which are declining. Michela Pacifici and her colleagues found that of 204 mammal species they examined, 106 species had their habitat range reduced between the 1970s and 2015, with 40 of those species losing more than half of the habitat they occupied in the 1970s (Pacifici et al. 2020). The species that suffered declines tended to have large-bodied individuals, low reproductive rates, and a relatively narrow foraging niche. Conversely, 44 of the 106 species saw their habitat expand. These species tended to have smaller-bodied individuals, multiple small broods, and be foraging generalists. Given that the human footprint is growing larger with time, Pacifici and her team predict that these smaller generalist mammals will begin to replace larger, more slowly reproducing mammals.
In this chapter, we have only skimmed the surface in terms of understanding how evolution operates. To understand the details of evolutionary biology, however, we need to first examine the historical context in which the discipline developed. And so in Chapter 2, we will explore some of the ideas that existed before Darwin revolutionized the study of biology and then proceed to consider Darwin’s insights.