STUDY UNIT 2.8 Correlations Reveal Relationships but Are Not Enough to Support Causal Claims
Explore...
- What makes some correlations stronger than others?
- What do people mean when they say that “correlation is not causation”?
When two variables are correlated positively or negatively, we can predict a person’s score on one variable from knowing her score on the other variable. For example, since we know that socioeconomic status and generosity are negatively correlated, if we know that somebody places herself near the top of the socioeconomic ladder, we can predict that she will donate fewer-than-average points to an anonymous partner. And if we know that somebody places himself near the bottom of the socioeconomic ladder, we can predict that he will donate an above-average number of points to the partner. Our predictions won’t always be perfect, but they will be more accurate than simply guessing how many points a person will give.
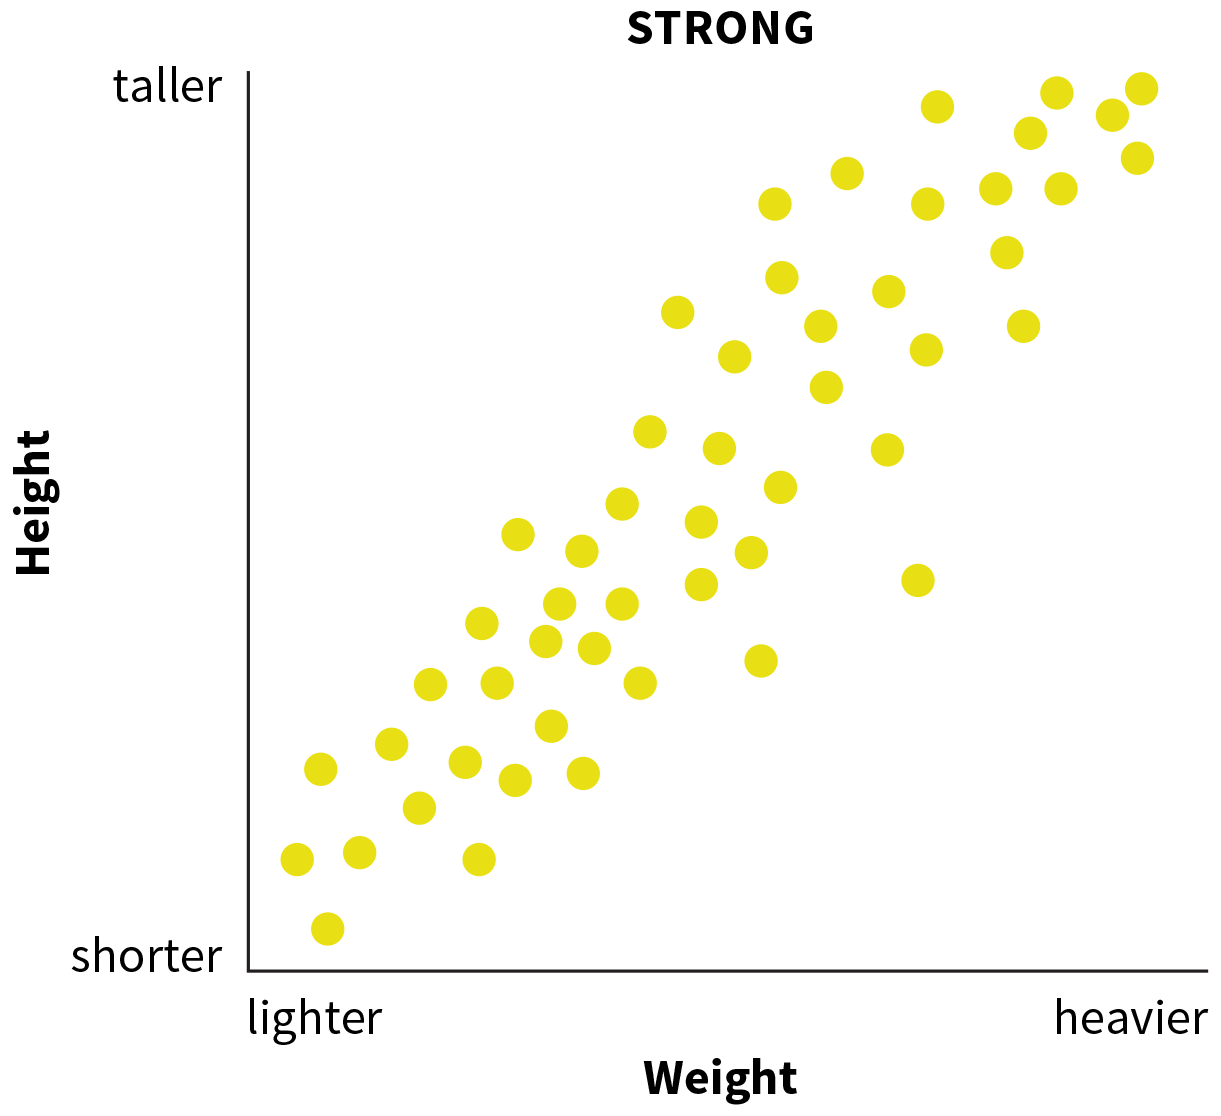
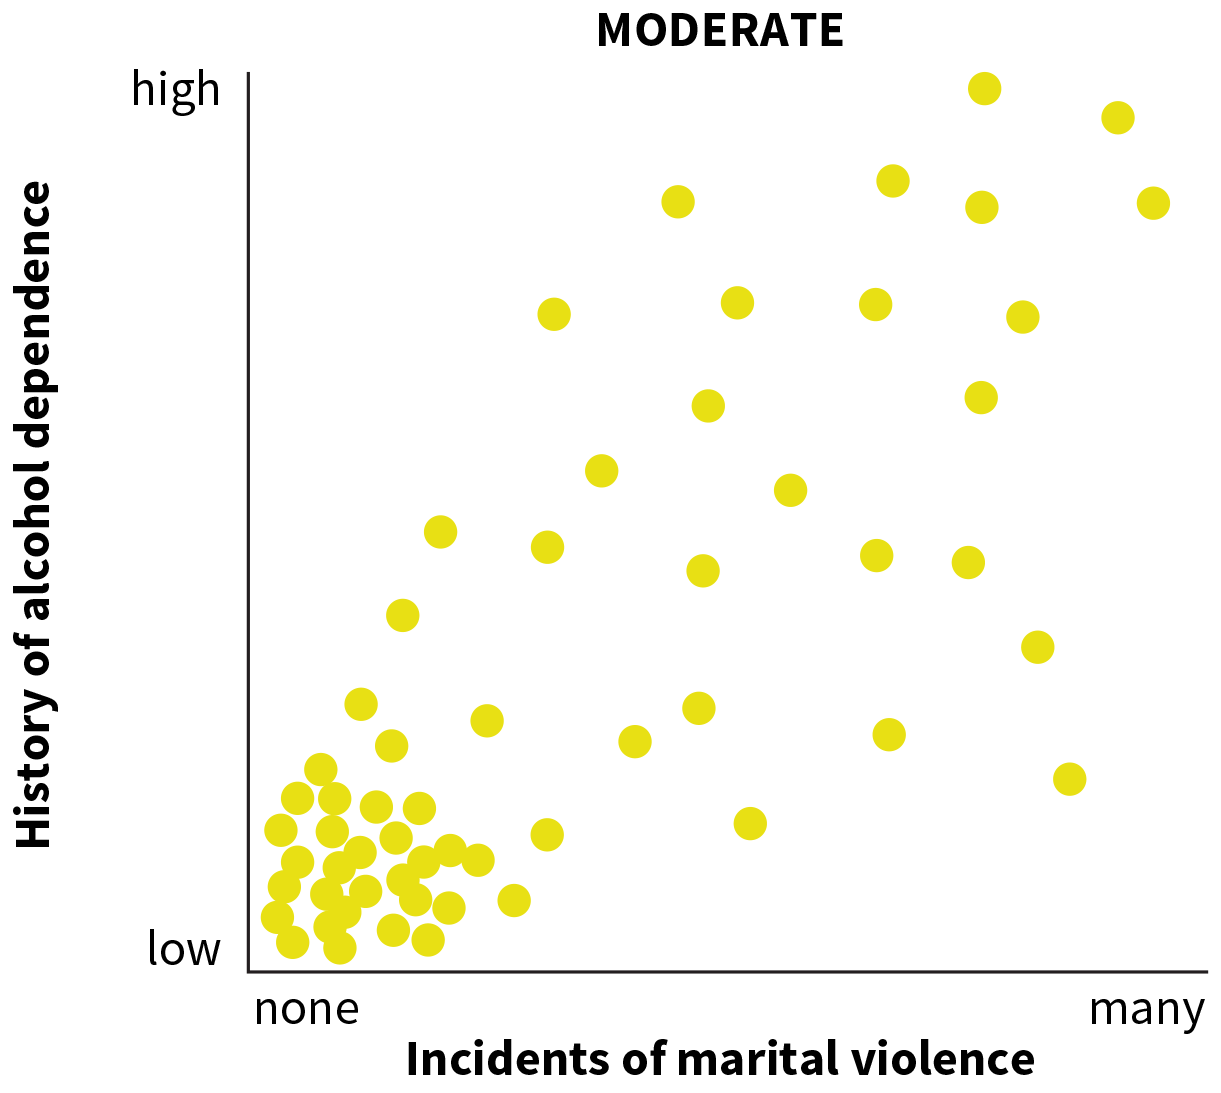
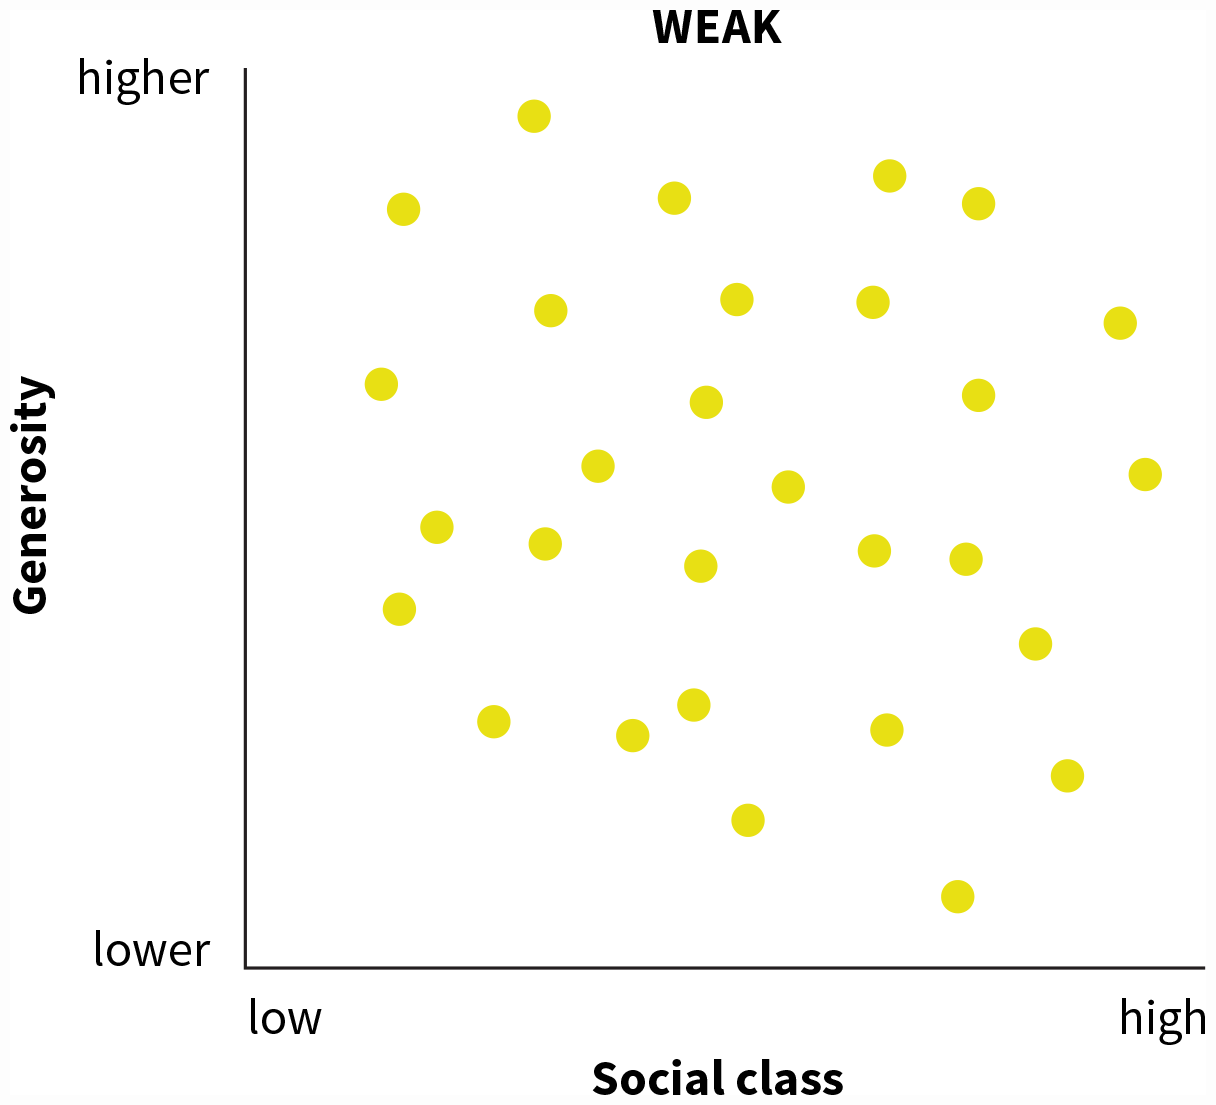
Furthermore, the stronger a correlation is, the better our predictions will be. You’ll learn more about how the strength of a correlation is determined in Study Unit 2.17. For now, just note that correlations may be described as “weak,” “moderate,” or “strong,” as shown in FIGURE 2.19. Certain correlations are very strong, such as the strong positive correlation between a person’s height and weight, or the strong negative correlation between how long a person’s legs are and the number of steps it takes them to walk across the room. Other correlations turn out to be moderate in strength, such as the moderately positive correlation between marital violence and problem drinking behaviors, or the moderately negative correlation between socioeconomic status and generosity. Moderate and even weak correlations still enable us to make predictions. We can predict generosity from socioeconomic status because studies have demonstrated that these two variables are moderately correlated. However, weaker correlations lead to less-accurate predictions. In contrast, when two variables have zero correlation, we cannot predict one variable from the other. For example, if height and generosity are not correlated, we cannot predict how many points someone will donate based only on how tall or short she is. You can explore all of the elements of a scatterplot in INTERACTIVE FIGURE 2.20.
More information
A scatter plot shows a strong correlation. The horizontal axis is weight, going from lighter on the left to heavier on the right. The vertical axis is height, with shorter at the bottom of the graph and taller at the top. The data points start in the bottom left of the graph and move uniformly in an upward diagonal direction toward taller and heavier.
More information
A scatter plot shows a moderate correlation. The horizontal axis is labeled incidents of marital violence, and left to right goes from none to many. The vertical axis is history of alcohol dependence, with low at the bottom of the graph and high at the top. There are a concentrated amount of data in the lower left corner, near low and none. With more instances of marital violence, generally comes a higher history of alcohol dependence, though there are some exceptions.
More information
A scatter plot shows a weak correlation. The horizontal axis is social class, and goes from low to high. The vertical axis is generosity and goes from lower to higher. There is no pattern or trend in the data.
FIGURE 2.19 Examples of Strong, Moderate, and Weak Correlations
Scatterplots can show when a correlation is strong, moderate, or weak. Panel (a) shows a strong, positive correlation. Panel (b) shows a moderate positive correlation. Panel (c) shows a weak negative correlation.
Even though a correlation that is positive or negative can help us predict one variable from another, a correlation—even a very strong one—does not allow us to say that one variable causes the other. You may have even heard before that “correlation is not causation.” If we read that men who are dependent on alcohol exhibit more aggression toward their wives, we can’t simply assume that the alcohol caused those men to be aggressive. Why not? To be convinced that one variable causes another, we have to satisfy three criteria. First, the two variables must be correlated. Second, we must know for certain which variable came first in time. Third, there must be no reasonable alternative explanations for the pattern. Correlational studies might satisfy the first criterion, but they usually do not satisfy the second and third criteria.
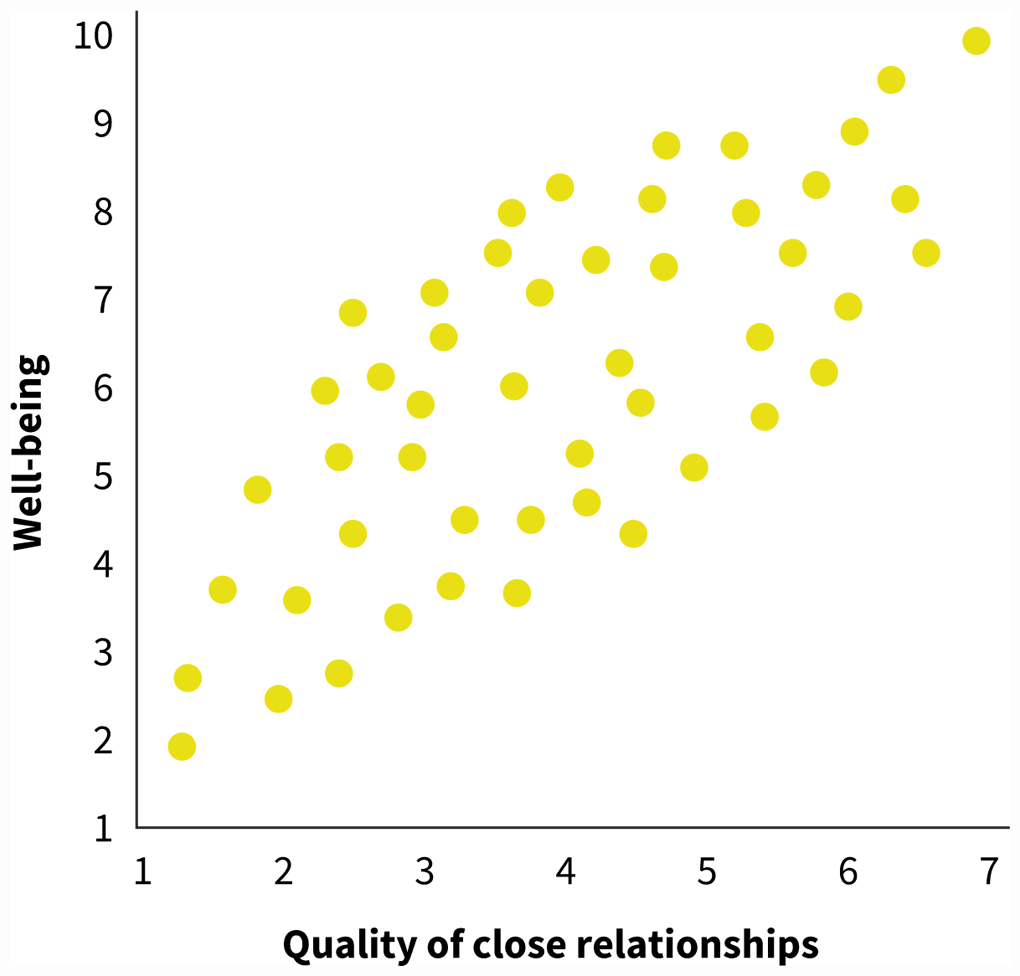
Let’s practice applying these three criteria to an example. A number of correlational studies have found that people who have strong social relationships score higher in well-being. In one of these studies, a group of researchers used self-report measures, asking people to indicate the quality of their social relationships (on a 1-to-7 scale, where 7 meant “I am very satisfied with my close social relationships”) and also to indicate their well-being on the ladder-of-life measure (Diener & Seligman, 2002; see Figure 2.9). The researchers found a positive correlation between these two variables (FIGURE 2.21). We might be tempted to conclude that forming strong relationships causes well-being to improve, but can we support this causal claim?
More information
A scatterplot shows a positive correlation between well-being and the quality of close relationships. The y-axis represents well-being and ranges from 1 to 10, in increments of 1. The x-axis represents quality of close relationships and ranges from 1 to 7, in increments of 1. Data points move in an upward, positive manner, with the higher quality of close relationships leading to a higher sense of well-bring.
FIGURE 2.21By Itself, a Correlation Doesn’t Indicate Causation
People who have strong social relationships have a better sense of well-being. Does this correlation mean that developing stronger social relationships will cause well-being to increase?
Applying the three criteria described above, we note that the first criterion is met: We do observe a correlation between having strong social relationships and having a better sense of well-being. But what about the second criterion? Do we know for certain which variable came first in time? Because quality of relationships and well-being were measured at the same time in the study, we cannot know for sure. It’s possible that having good relationships came first, causing people to be happier. But it’s also possible that people who first had higher well-being found it easier to form and maintain strong social relationships. The way the data were collected makes it impossible to determine which variable caused the other.
The third criterion is not met either: We cannot rule out alternative explanations. Because of the way the data were collected, it’s possible that well-being and relationship quality are correlated only because both of them are related to some third variable, lurking in the background, that would actually explain the link. This lurking variable might not have been measured in the study but could nonetheless be the reason that strong relationships and well-being are correlated. For example, perhaps people who are more neurotic—those who tend to have a more anxious and negative outlook on the world—both have a lower sense of well-being and also have poorer social relationships. In other words, a personality trait such as neuroticism could be the true causal variable that predicts both well-being and social relationships, creating a correlation between those two variables but not a causal link between them. This type of third-variable problem occurs whenever a correlation observed between two variables is actually explained by the influence of some third variable. The three criteria for establishing causation are reviewed in FIGURE 2.22.
More information
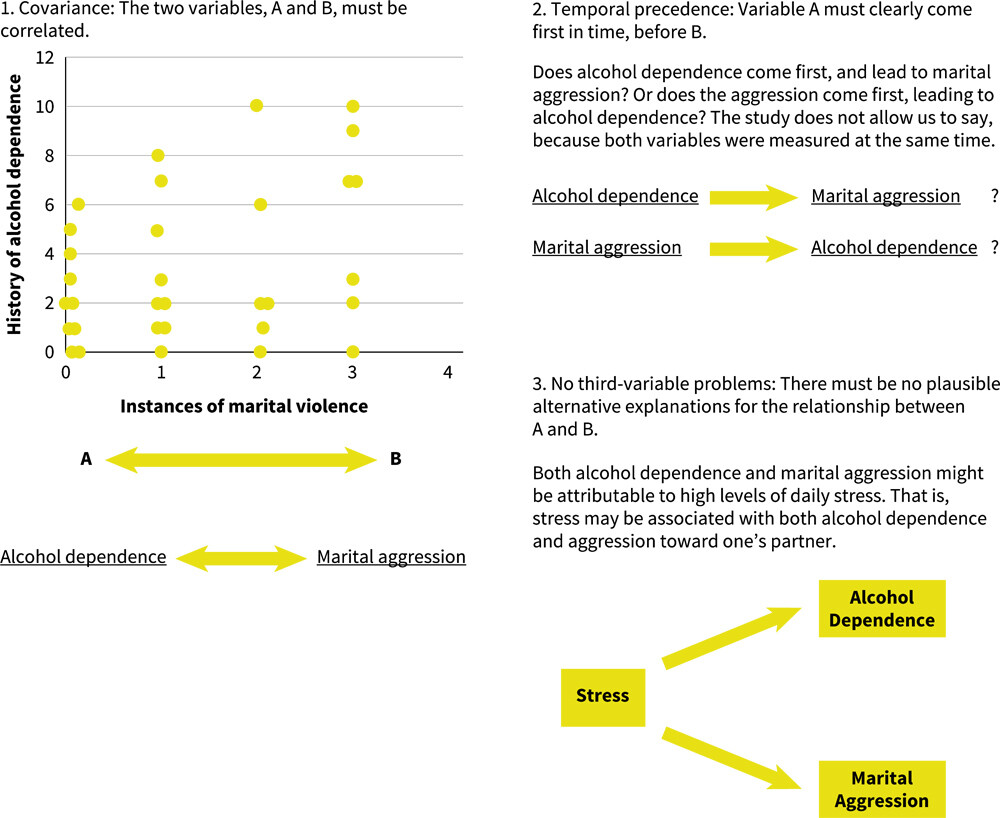
A series of steps illustrate how to determine if there is causation in a relationship between two variables, A and B. The three steps are as follows. Step 1, covariance: the two variables, A and B, must be correlated. There is a scatter plot titled history of alcohol dependence. The horizontal axis is instances of marital violence and the vertical axis is history of alcohol dependence. The data in the graph show a correlation between instances of marital violence and a history of alcohol dependence. Variable A is alcohol dependence and variable B is marital aggression. Step 2, temporal precedence: variable A must clearly come first in time, before B. Does alcohol dependence come first, and lead to marital aggression? Or does the aggression come first, leading to alcohol dependence? The study does not allow us to say, because both variables were measured at the same time. Step 3, no third-variable problems: there must be no plausible alternative explanations for the relationship between A and B. Both alcohol dependence and marital aggression might be attributed to high levels of daily stress. That is, stress may be associated with both alcohol dependence and aggression toward one’s partner.
FIGURE 2.22Three Criteria for Causation (Does Variable A Cause Variable B?)
In order to support a causal claim, the results have to show a correlation between variable A and variable B; the method has to ensure that variable A came first in time, and there must be no alternative explanations for the relationship.
When researchers conduct correlational studies, they try to anticipate and measure possible third variables that could explain the relationships they wish to test. But one correlational study cannot rule out all possible third-variable problems. Even when researchers meet the second criterion, and one variable is clearly measured before the other, the third-variable problem is still hard to solve. For example, suppose we use the relationships students form during their first semester of college to predict their well-being at the end of the year. This study would establish temporal precedence because relationships would be measured before well-being. However, highly neurotic students might still have a harder time both making friends at the start of the year and achieving high well-being at the end of their first year—a third-variable problem. Correlational studies can never support causal claims because they can never rule out all possible third variables. FIGURE 2.23 allows you to view some new examples.
More information
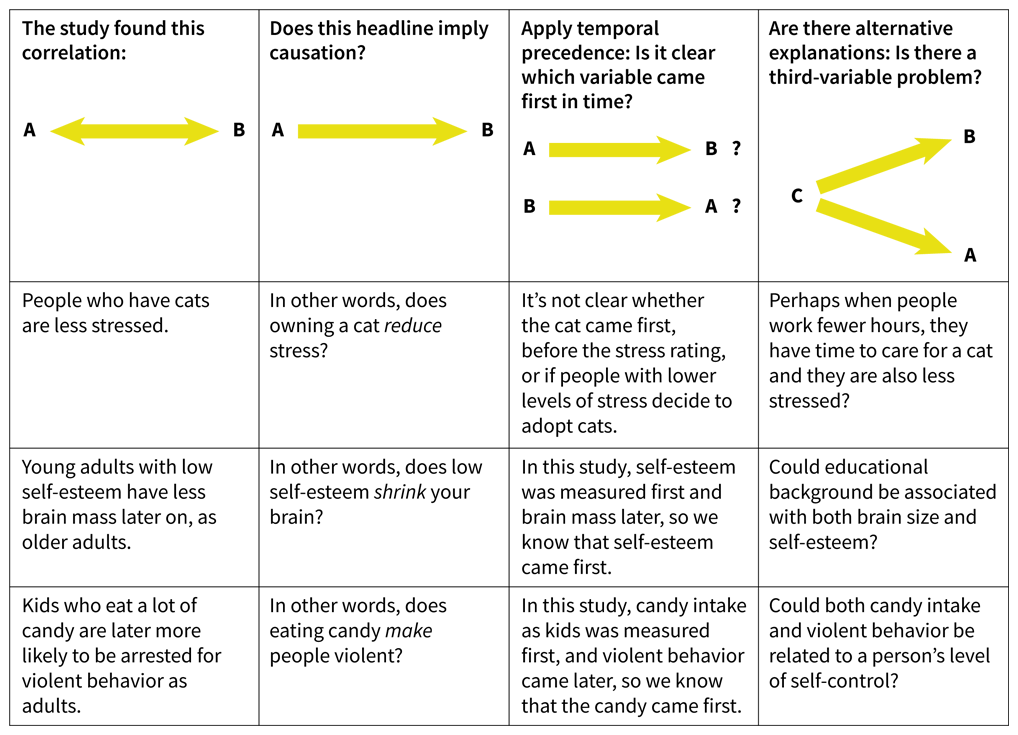
A four by four table compares three studies using the criteria for causation in correlational studies. The first row has column headers and it shows the correlation between two variables A and B in the first three columns and correlation between variables A, B, and C in the third column. Rows 2 through 4 answer the column headers for three different correlational studies. The column headers are as follows. column 1: The study found this correlation:; column 2: Does this headline imply causation; column 3: Apply temporal precedence: Is it clear which variable came first in time?, column 4: Are there alternative explanations: Is there a third-variable problem?
FIGURE 2.23Three Criteria for Causation in Correlational Studies
Each study shows a correlation, but is it clear which variable comes first in time? What third variables could be responsible for each relationship?
Glossary
- third-variable problem
- For a given observed relationship between two variables, an additional variable that is associated with both of them, making the additional variable an alternative explanation for the observed relationship.