2.3 Bright-Field Microscopy and Phase-Contrast Microscopy
The most common kind of light microscopy is called bright-field microscopy, in which an object such as a bacterial cell is perceived as a dark silhouette blocking the passage of light (for examples, see Fig. 2.6A, C, E). Details of the object are defined by the points of light surrounding its edge. Here we explain how a typical student’s microscope works and how to use it to image microbes.
Magnification
How do the optics of a bright-field microscope maximize the observation of detail? We consider the following factors:
Wavelength and resolution. Our eyes can resolve a distance as small as 100–200 µm, while the resolution limit from the wavelength of light is 200 nm (0.2 µm); that is, 500- to 1,000-fold smaller. Thus, the greatest magnification that can improve our perception of detail is about 1,000×. Any greater magnification expands the image size, but the peaks expand without resolution between them (see Fig. 2.12). As we noted in the previous section, this expansion without increasing resolution is called empty magnification.
Light and contrast. For any given lens system, a balanced amount of light yields the highest contrast between the dark specimen and the light background. High contrast is needed to perceive the full resolution at a given magnification.
Lens quality. All lenses contain inherent aberrations that detract from perfect curvature. Optical properties limit the perfection of a single lens, but manufacturers construct microscopes with a series of lenses that multiply each other’s magnification and correct for aberrations.
Let’s first consider magnification of an image by a single lens. Figure 2.13 shows an objective lens, a lens situated directly above an object or specimen that we wish to observe at high resolution. How can we maximize the resolution of details?
More information
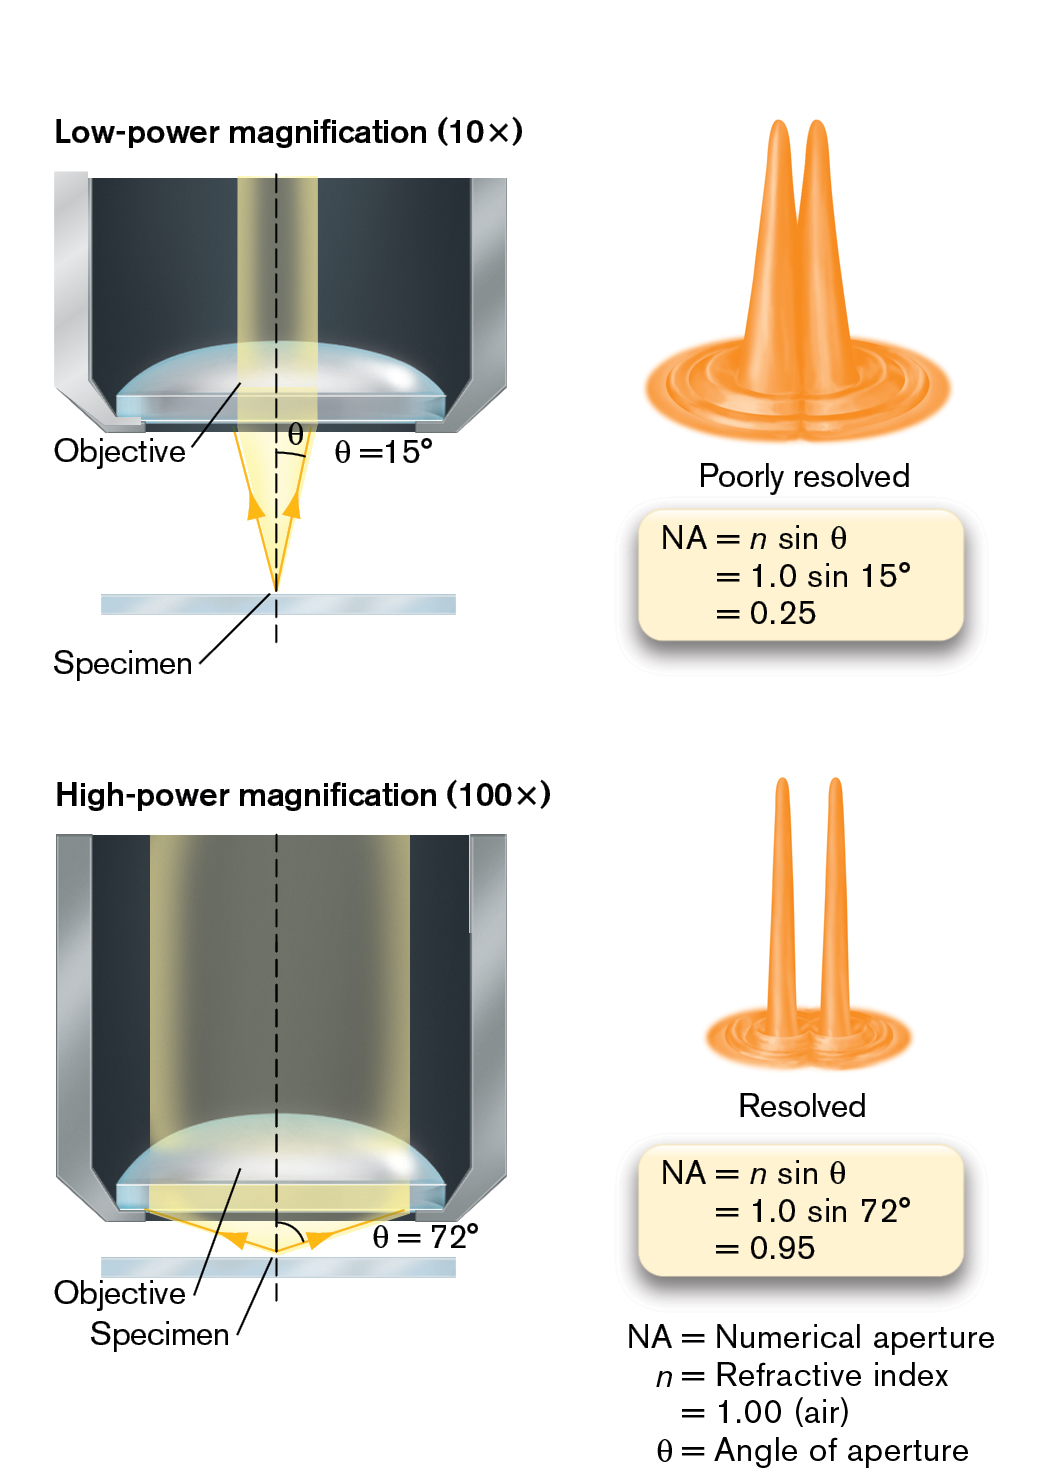
A two-part illustration shows the resolution and the numerical aperture. The first part shows low-power magnification, at 10 times, consisting of a hollow cylinder in which a semi oval-shaped object is placed at the bottom. A horizontal line labeled specimen is at the bottom. A narrow beam is inserted to the specimen through an objective at an angle that equals 15 degrees. To the right shows, two narrow peaks bonded on a circular coil labeled as poorly resolved. At the bottom it reads N A equals n sine of theta equals 1.0 times sine of 15 degrees equals 0.25. The second part shows high-power magnification, at 100 times, consisting of a hollow cylinder in which a semi oval-shaped object is placed at the bottom. A horizontal line is labeled specimen at the bottom. A narrow beam is inserted to the specimen through objective at an angle of that equals 72 degrees. A dashed vertical line is drawn in the mid of the beam. To the right shows two narrow peaks on a circular coil labeled as resolved. An at the bottom reads N A equals n sine of theta equals 1.0 times sine of 72 degrees equals 0.95. The corresponding text reads N A N theta equals Numerical aperture equals Refractive index equals 1.00 (air). Theta equals Angle of aperture.
FIGURE 2.13 ■Numerical aperture and resolution. The numerical aperture (NA) equals the refractive index (n) of the medium (air) containing the light cone, multiplied by the sine of the angle (θ) of the light cone. Higher NA allows greater resolution.
An object at the focal point of a lens sits at the tip of a cone of light formed by rays from the lens converging at the object. The angle of the light cone is determined by the curvature and refractive index of the lens. The lens fills an aperture, or hole, for the passage of light, and for a given lens the light cone is defined by an angle theta (θ) projecting from the midline, known as the angle of aperture. As θ increases and the horizontal width of the light cone (sin θ) increases, a wider cone of light passes through the specimen. The wider the cone of light rays, the less the interference between wavefronts—and the narrower the peak intensities in the image. Thus, a wider light cone enables us to resolve smaller details. The greater the angle of aperture of the lens (sin θ), the better the resolution.
Resolution also depends on the refractive index of the medium that contains the light cone, which is usually air. The refractive index (n) is the ratio of the speed of light in a vacuum to its speed in another medium. For air, n is extremely close to 1. For water, n = 1.33; for lens material, n ranges from 1.4 to 1.6. As light passing through air or water enters a lens of higher refractive index, the light bends, at angles (θ) up to a maximum. The product of the refractive index (n) of the medium multiplied by sin θ is the numerical aperture (NA):
NA = n sin θ
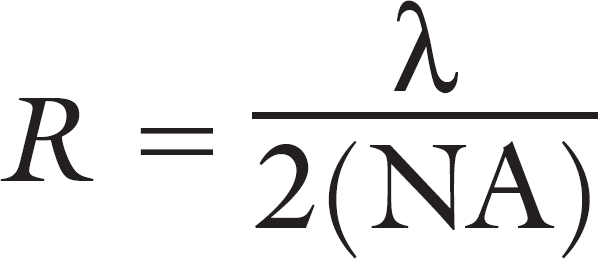
In Figure 2.13 we see the calculation of NA for an objective lens of magnification 10× and for a lens of magnification 100×. As NA increases, the peak intensities of an image narrow and the distance between two objects that can be resolved decreases. The minimum resolution distance R varies inversely with NA:
where λ represents the wavelength of incident light. Notice that this equation limits resolution to approximately half the wavelength of light (λ/2).
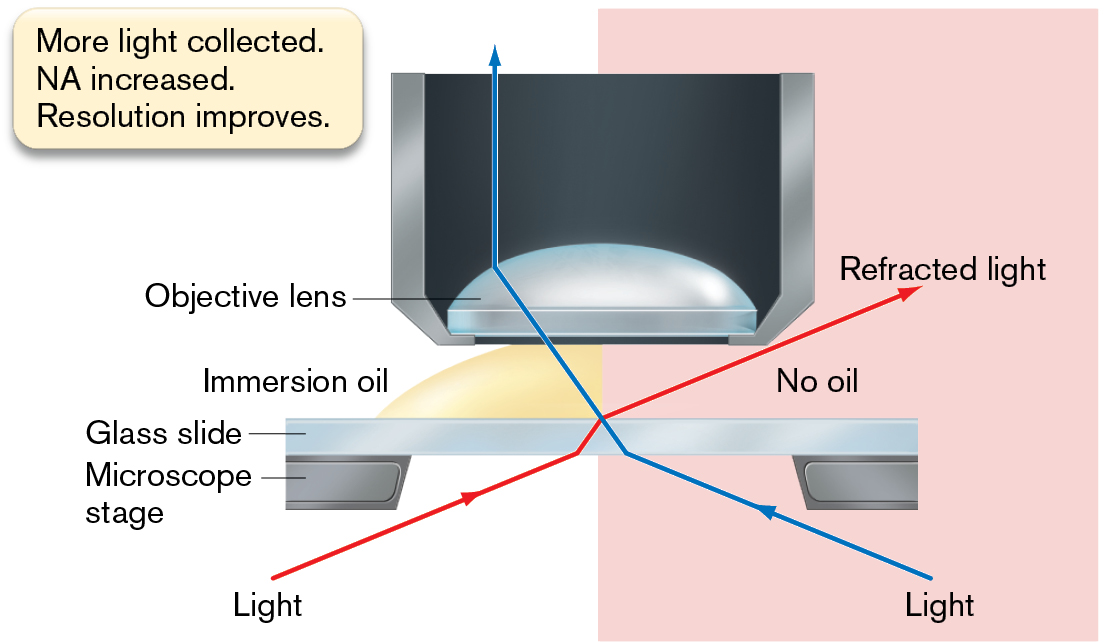
As the lens strength increases and the light cone widens, the lens must come nearer the object. Defects in lens curvature become more of a problem, and focusing becomes more challenging. As θ becomes very wide, too much of the light from the object is lost from refraction at the glass-to-air interface. To collect and focus more light, we need to increase the refractive index of the medium (air) between the object and the objective lens. For the highest-power objective lens, generally 100×, we can replace air with immersion oil between the object and the lens. Immersion oil has a refractive index (n = 1.5) comparable to that of the lens (Fig. 2.14). Immersion oil minimizes the loss of light rays by refraction and makes it possible to reach 100× magnification with minimal distortion. The 100× objective with immersion oil is generally the most powerful lens available on a student’s microscope.
More information
An illustration shows the use of oil immersion in microscopy. A horizontal bar labeled glass slide is shown. Two short bars supporting the glass side are labeled as microscope stage. A concave down-facing lens labeled as an objective lens is placed on the bottom of the material, above the glass slide. The immersion oil is present on the left side between the material and glass slide. There is no oil on the right side. Light is focused through the immersion oil into the microscope. Without immersion oil, light is refracted away from the microscope. The corresponding text reads more light collected. N A increased. resolution improves.
FIGURE 2.14 ■Use of immersion oil in microscopy. Immersion oil with a refractive index comparable to that of glass (n = 1.5) prevents light rays from bending away from the objective lens.
Thought Question
2.4 (refer to Fig. 2.13) For a single lens, what angle θ might offer magnification even greater than 100×? What practical problem would you have in designing such a lens to generate this light cone?
ANSWER ANSWER
In theory, an angle θ (theta) of 90° would produce the highest resolution—even greater than 100°. However, a 90° angle θ generates a cone of 180°, which would require the object to sit in the same position as the objective lens—in other words, to have a focal distance of zero. In practice, the cone of light needs to be somewhat less than 180°, to allow room for the object and to avoid substantial aberrations (light-distorting properties) in the lens material.
The Compound Microscope
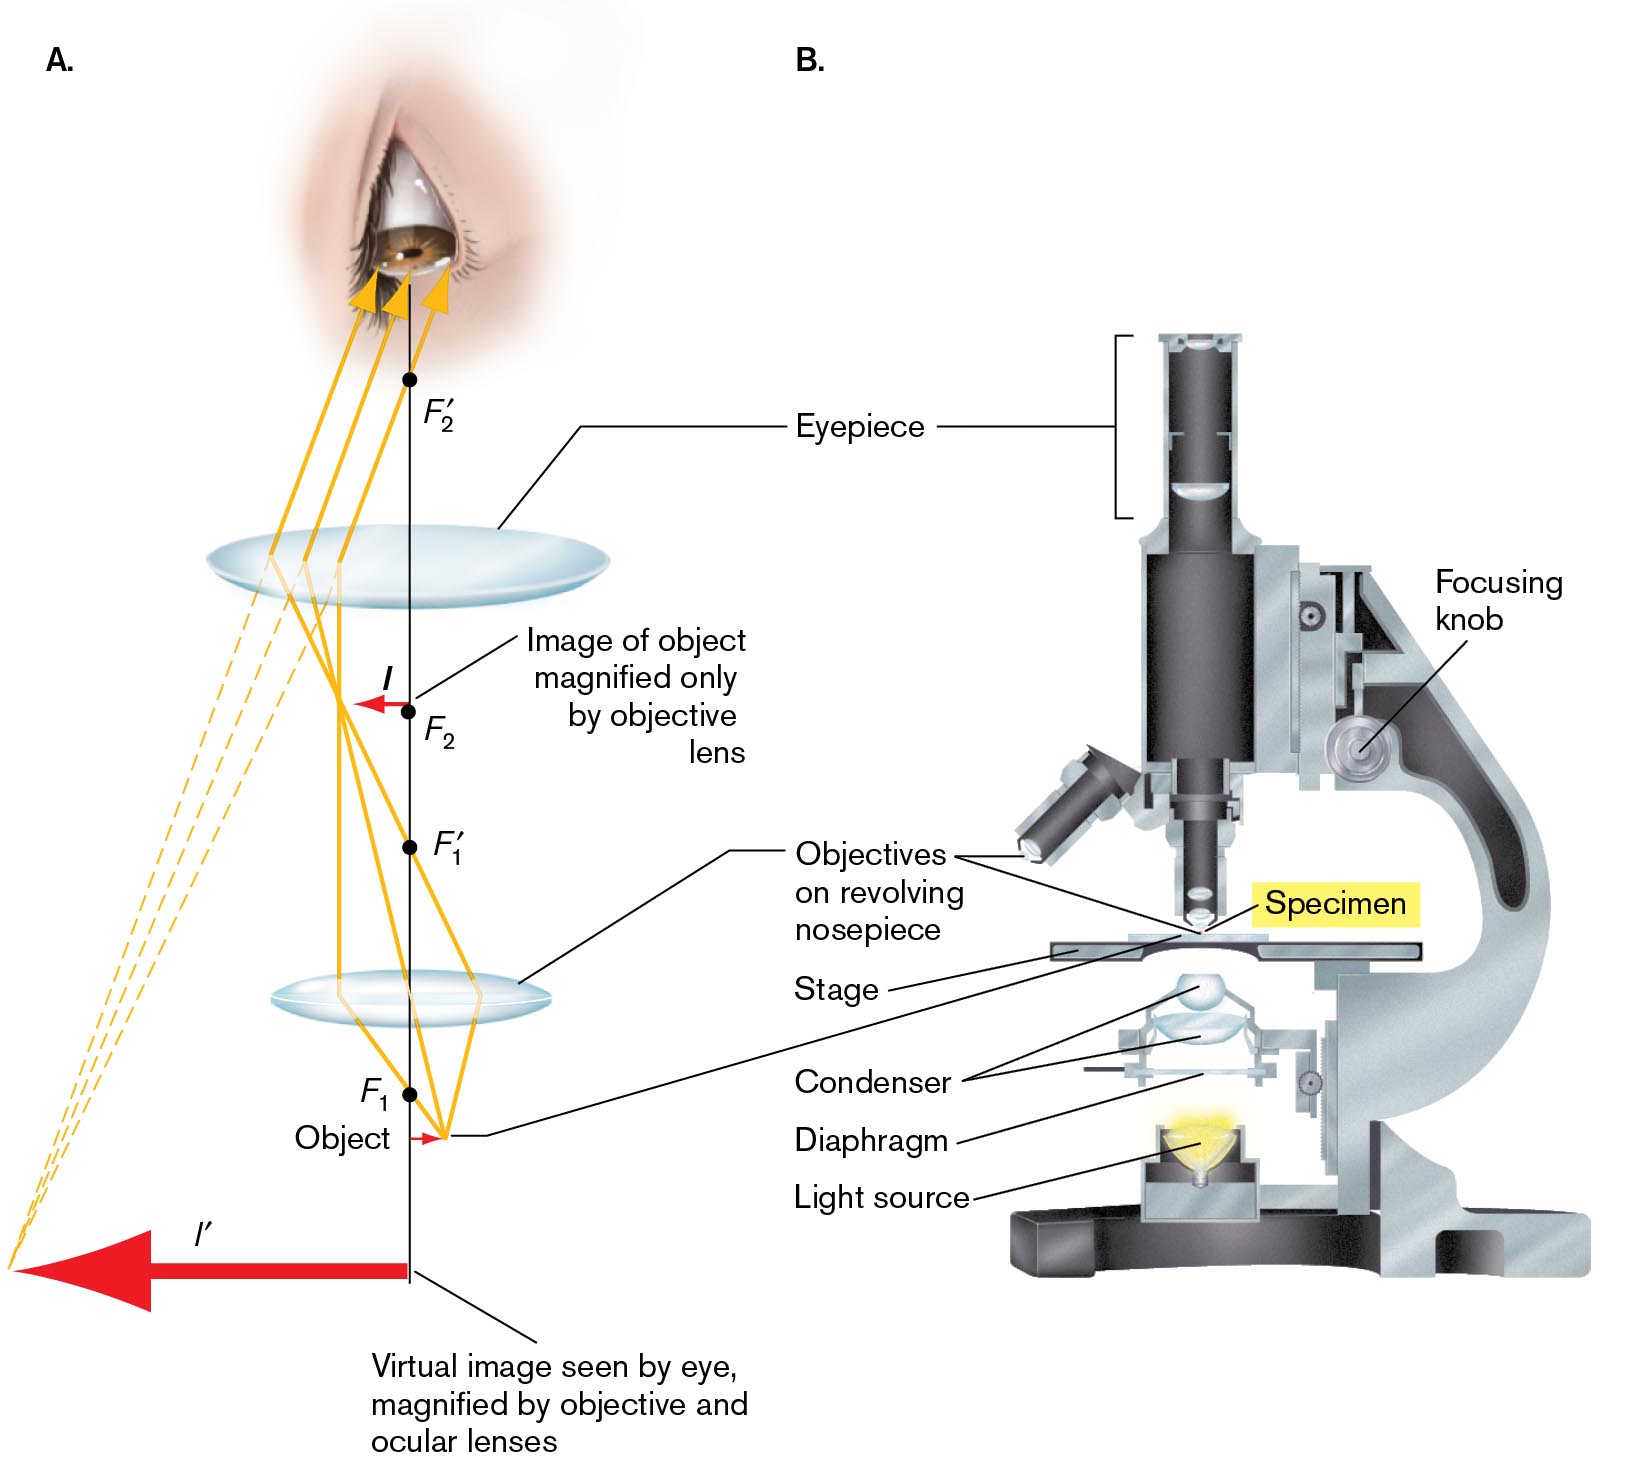
A compound microscope is a system of multiple lenses designed to correct or compensate for lens aberrations. Why do we use a compound microscope instead of a single perfect lens? The manufacture of high-power lenses is difficult because as the glass curvature increases, the effects of aberration increase faster than the magnification. Instead of one thick lens, a series of lower-power lenses can multiply their magnification with minimal aberration. Figure 2.15 shows a typical arrangement of a compound microscope: the light source is placed at the bottom, shining upward through a series of lenses, including the condenser, objective, and ocular lenses.
More information
A two-part illustration shows the light path through a microscope and the structure of a microscope.
The path of light through a microscope is illustrated. It consists of an objective lens labeled eyepiece, and an objective lens on revolving nosepiece. The lens are placed on a vertical line with the eyepiece higher than the objective A view of the human eye is shown at the top of the first lens. A vertical line is drawn from the eye to the bottom through the lenses. Four focus points labeled F 1, F 1 prime, F 2, and F 2 prime are plotted on the vertical line from bottom to top. An arrow below F 1 is labeled as object, and the left arrow is labeled I is placed at point F 2, and the corresponding text reads Image of object magnified only by an objective lens. A thick left arrow labeled I prime, at the bottom of the vertical line, and the corresponding text reads Virtual image seen by eye, magnified by objective and ocular lenses. Three arrows representing light from the object passes to the eyepiece through the two objective lenses. Three dashed lines from the left arrow are drawn to the center lens.
The structure of a compound microscope is illustrated. The second part shows a cutaway view of the microscope, and the labeled parts are eyepiece, focusing knob, stage, condenser, diaphragm, and light source. The specimen is placed between the stage and the eyepiece. The condenser and diaphragm are above the light source but beneath the stage. The objectives are placed on a rotational unit that moves the objectives into line with the eyepiece at the top of the microscope.
FIGURE 2.15 ■Anatomy of a compound microscope.A. Light path through the microscope. B. Cutaway view.
Microscopy: Optics and Properties of Light
Between the light source and the condenser sits a diaphragm, a device to cut the diameter of the light column. Lower-power lenses require lower light levels because the excess light makes it impossible to observe the darkening effect of specimen absorbance. Higher-power lenses spread the light rays farther and thus require an open diaphragm to collect sufficient light for contrast between the dark specimen and the bright field.
Above the diaphragm, the condenser consists of one or more lenses that collect a beam of rays from the light source onto a small area of the slide, where light may be absorbed by the object or specimen. Condenser lenses increase light available for contrast but do not participate in magnification.
The objective lens is the first to form a magnified image (I) of the object (Fig. 2.15A). As the image forms, each light ray traces a path toward a position opposite its point of origin; thus, the image is inverted (rotated 180°).
The first image of the object (I) is then amplified by a secondary magnification step through the ocular lens within the eyepiece. The final image (I′) is comparable to the virtual image of Figure 2.11, but I′ includes the total magnification of the object by both objective and ocular lenses. The magnification factor of the ocular lens is multiplied by the magnification factor of the objective lens to generate the total magnification (power). Thus, a 10× ocular multiplied by a 40× objective generates 400× total magnification. A 100× objective with immersion oil is multiplied by 10× ocular magnification to yield 1,000× total magnification.
The nosepiece of a compound microscope typically holds three or four objective lenses of different magnifying power, such as 4×, 10×, 40×, and 100× (requiring immersion oil). These lenses are arranged so that they rotate in turn into the optical column. In a high-quality instrument, the lenses are set at different heights from the slide so as to be parfocal. In a parfocal system, when an object is focused with one lens, it remains in focus, or nearly so, when another lens is rotated to replace the first.
Note: Objective lenses can be obtained in several different grades of quality, manufactured with different kinds of correction for aberrations. Lenses should feature at minimum the following corrections: “plan” correction for field curvature, to generate a field that appears flat; and “apochromat” correction for spherical and chromatic aberrations.
Observing a specimen under a compound microscope requires several steps:
Position the specimen centrally in the optical column. Only a small area of a slide can be visualized within the field of view of a given lens. The higher the magnification, the smaller the field of view that will be seen.
Optimize the amount of light. At lower power, too much light will wash out the light absorption of the specimen. At higher power, more light needs to be collected, lest everything appear dark. To optimize light, the condenser must be set at the correct vertical position to focus on the specimen, and the diaphragm must be adjusted to transmit the amount of light that produces the best contrast.
Focus the objective lens. The focusing knob permits adjustment of the focal distance between the objective lens and the specimen on the slide so as to bring the specimen into the focal plane, the plane that contains the focal points for light entering the lens from all directions. Typically, we focus first using a low-power objective, which generates a greater depth of field; that is, a range of planes in which the object appears in or near focus. After focusing under low power, we can rotate a higher-power lens into view and then fine-tune the adjustment.
Preparing a Specimen for Microscopy
A simple way to observe microbes is to place them in a drop of water on a slide with a coverslip. This is called a wet mount preparation. The advantage of the wet mount is that the organism is viewed in as natural a state as possible, without artifacts resulting from chemical treatment, and we can observe live behavior such as swimming (see Fig. 2.3B). The disadvantage of the wet mount is that most living cells are transparent and therefore show little contrast with the external medium. With limited contrast, the cells can barely be distinguished from background, and both detection and resolution are minimal.
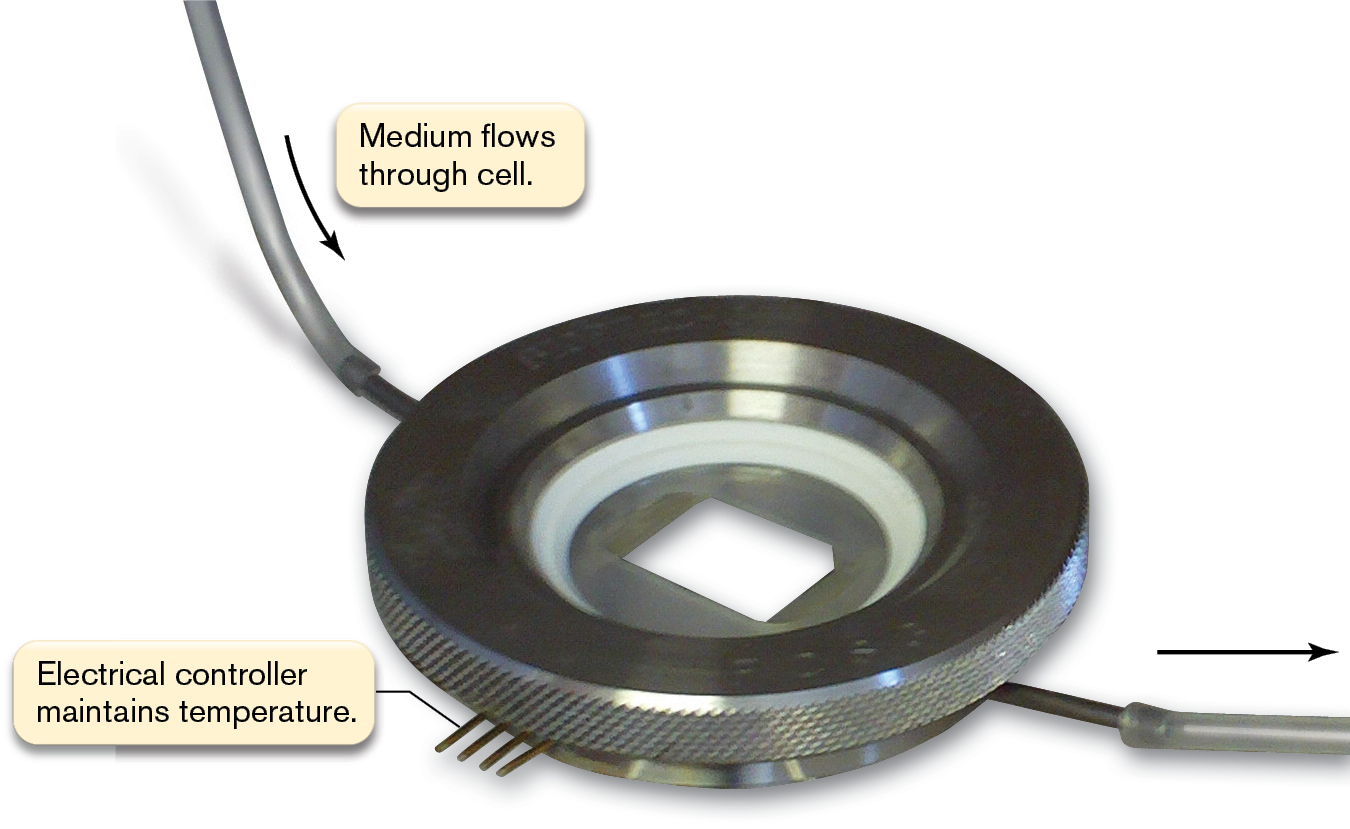
Another disadvantage of the wet mount is that the sample rapidly converts absorbed light to heat, thus tending to overheat and dry out. To avoid overheating, researchers use a temperature-controlled flow cell, in which fresh medium passes through the specimen (Fig. 2.16). The microbe to be observed must adhere to a specially coated slide within the flow cell. The adherent cells may grow and multiply as a biofilm, nourished continually by fresh medium.
More information
A photo of a flow cell. It consists of a round disk-shaped chamber attached with two tubes, and a fork-shaped structure at the bottom is labeled as the Electrical controller maintains temperature. The medium flows through a cell in the left tube and exits through the bottom tube.
FIGURE 2.16 ■A flow cell enables extended observation of living microbes. In a flow cell, culture medium flows through an inlet tube into the slide chamber and then exits through the outlet.BIOPTECHS FLOW CELL (PHOTO BY J. SLONCZEWSKI)
Focusing the Object
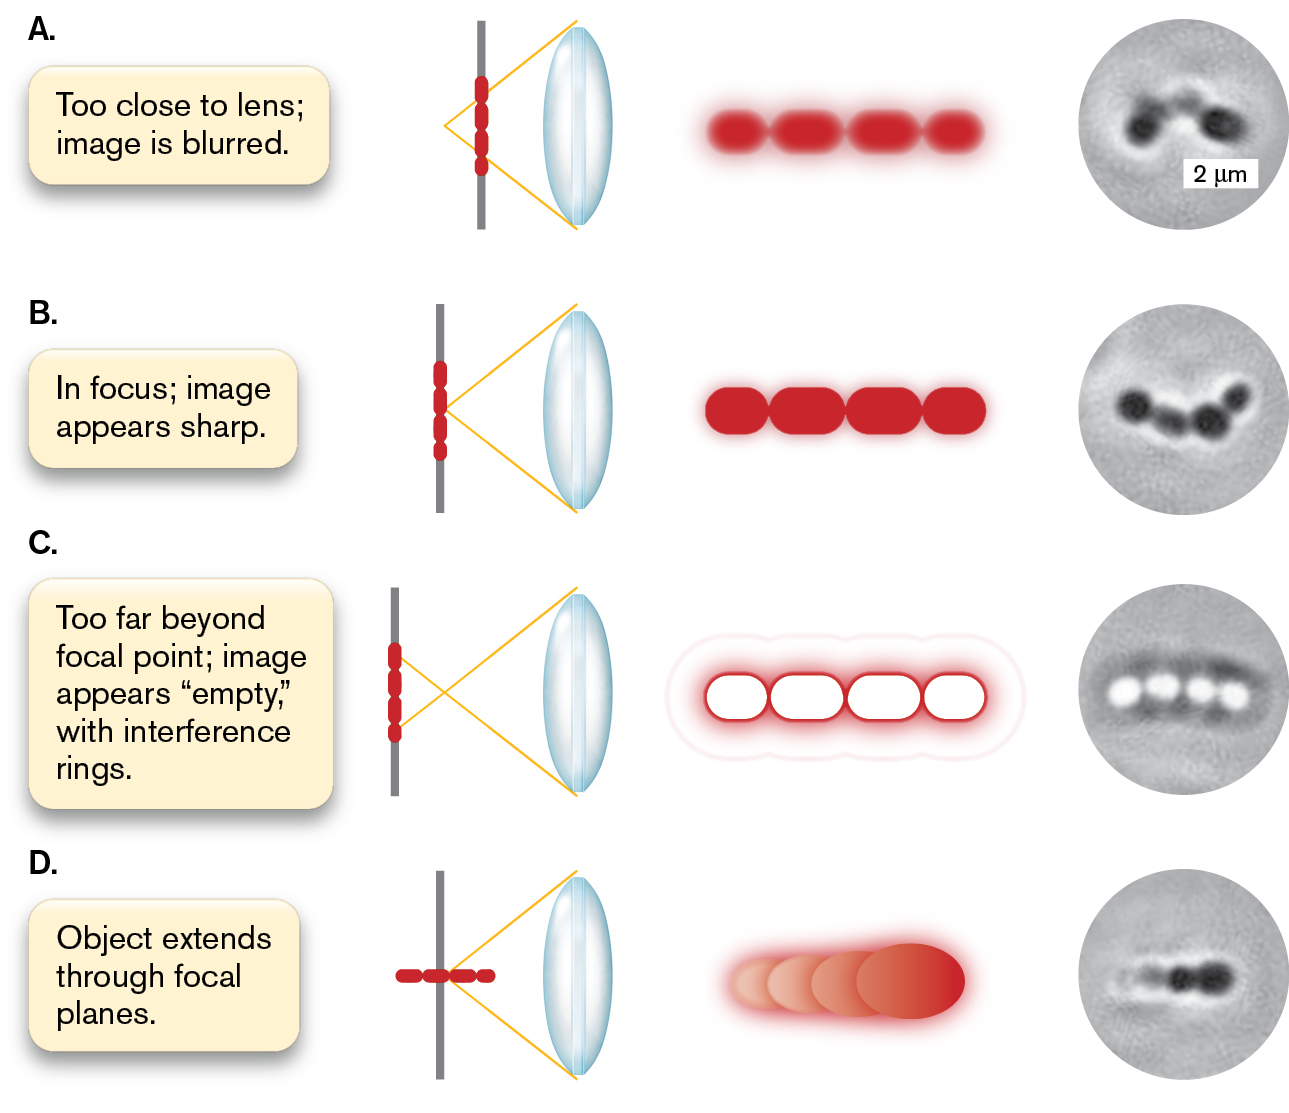
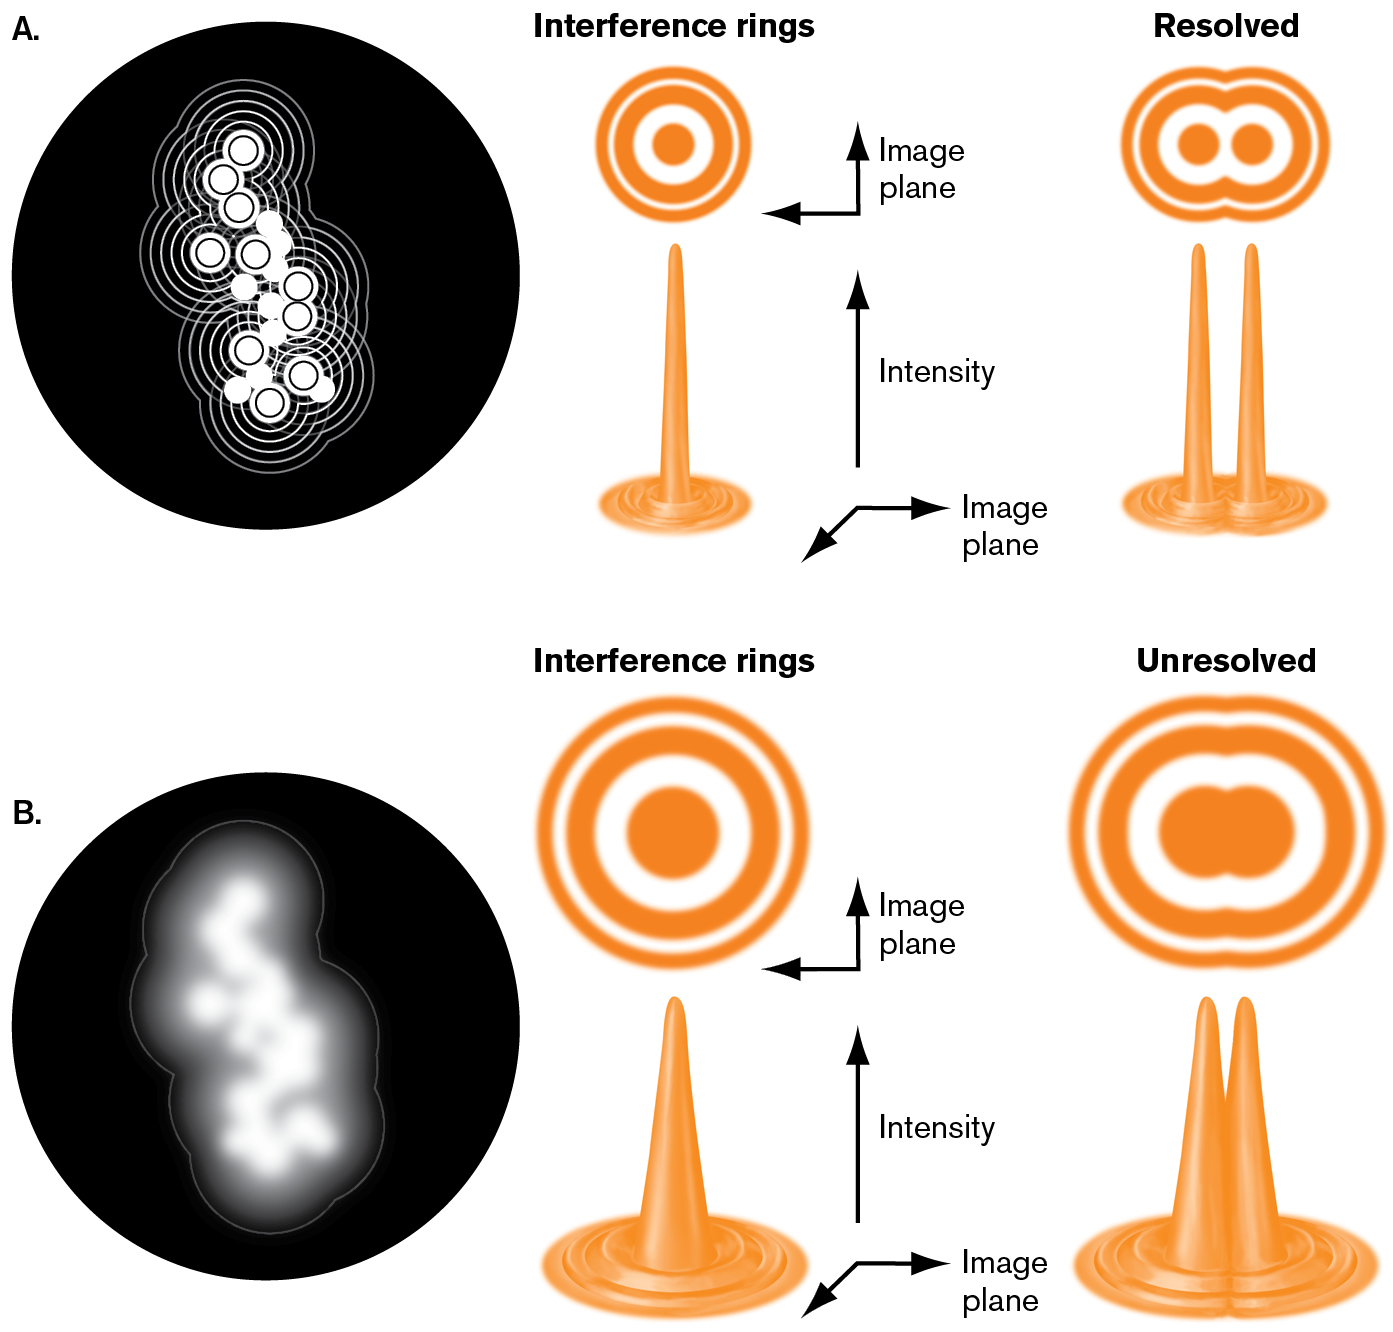
An object appears in focus (that is, it is situated within the focal plane of the lens) when its edge appears sharp and distinct from the background. The shape of the dark object is actually defined by the points of light surrounding its edge. At higher power, as we reach the resolution limit, these points of light are only partly resolved. The partial resolution of these points of light generates interference effects, such as extra rings of light surrounding an object.
In Figure 2.17 we observe Oenococcus oeni, bacteria that ferment the malic acid of grapes during wine production. As chains of O. oeni drift in and out of the focal plane, their appearance changes through optical effects. When a bacterium drifts out of the focal plane too close to the lens, resolution declines and the image blurs (Fig. 2.17A). When the bacterium lies within the focal plane, its image appears sharp, with a bright line along its edge (Fig. 2.17B). When the chain of cells lies too far past the focal plane, the bright interference lines collapse into the object’s silhouette, which now appears bright or “hollow,” or surrounded by rings (Fig. 2.17C). In fact, the bacterium is not hollow at all; only its image has changed.
When the chain extends across several focal planes, different portions appear out of focus (either too near or too far from the lens; Fig. 2.17D). In addition, when the end of a cell points toward the observer, light travels through the length of the cell before reaching the observer, so the cell absorbs more light and appears dark.
More information
Four micrographs of bacteria are shown at different levels of focus. An illustration accompanies the micrographs describing why the image is distorted.
Micrograph A is blurred because the microscope lens is too close to the slide. Four ovals are bonded closely on a line oriented parallel to a lens. The ovals are shown in greater detail as a sequence of four ovals with blurred edges. A micrograph at the right shows two thick circles. A note reads too close to the lens; the image is blurred.
Micrograph B appears sharp because it is in focus. Four ovals are bonded closely on a vertical line oriented parallel to a lens. The ovals are shown in greater detail as a sequence of four ovals with sharp edges. A micrograph at the right shows four thick circles in sequence bonded. A note reads In focus; the image appears sharp.
Micrograph C the image appears empty because the focus is too far beyond the focal point. Four ovals are bonded closely on a vertical line oriented parallel to a lens. The ovals are shown in greater detail as a sequence of four ovals with blurred edges and hollow centers. A micrograph at the right shows four circles in sequence bonded, the centers of the circles are white. A note reads too far beyond the focal point; the image appears “empty,„ with interference rings.
Micrograph D the object structure is difficult to distinguish because the object extends through focal planes. A vertical line representing a slide is oriented parallel to the lens. A sequence of four ovals are shown perpendicular to the line. The ovals are shown in greater detail as a sequence of four to five overlapping ovals. A micrograph at the right shows overlapping circles in sequence. A note reads object extends through focal planes.
FIGURE 2.17 ■Bacteria observed at different levels of focus.C. M. LUCY JOSEPH, UC DAVIS DEPT. OF VITICULTURE AND ENOLOGY WINE YEAST AND BACTERIA COLLECTION
How do we observe microbes that are actively motile? Motile bacteria swimming in and out of the focal plane present a challenge even to experienced microscopists. The higher the magnification, the narrower the depth of the focal plane; thus, observing swimming organisms requires a trade-off between magnification and depth of field.
Thought Question
2.5 Under starvation, a soil bacterium such as Bacillus subtilis packages its cytoplasm into a spore, leaving behind an empty cell wall. Suppose, under a microscope, you observe what appears to be a hollow cell. How can you tell whether the cell is indeed hollow or is simply out of focus?
ANSWER ANSWER
You can tell whether the cell is out of focus or actually hollow by rotating the fine-focus knob to move the objective up and down while observing the specimen carefully. If the hollow shape appears to be the sharpest image possible, it is probably a hollow cell. If the hollow shape turns momentarily into a sharp, dark cell, it was probably out of focus before. Alternatively, you could use a confocal microscope to visualize the center of the hollow cell.
Phase-Contrast Microscopy
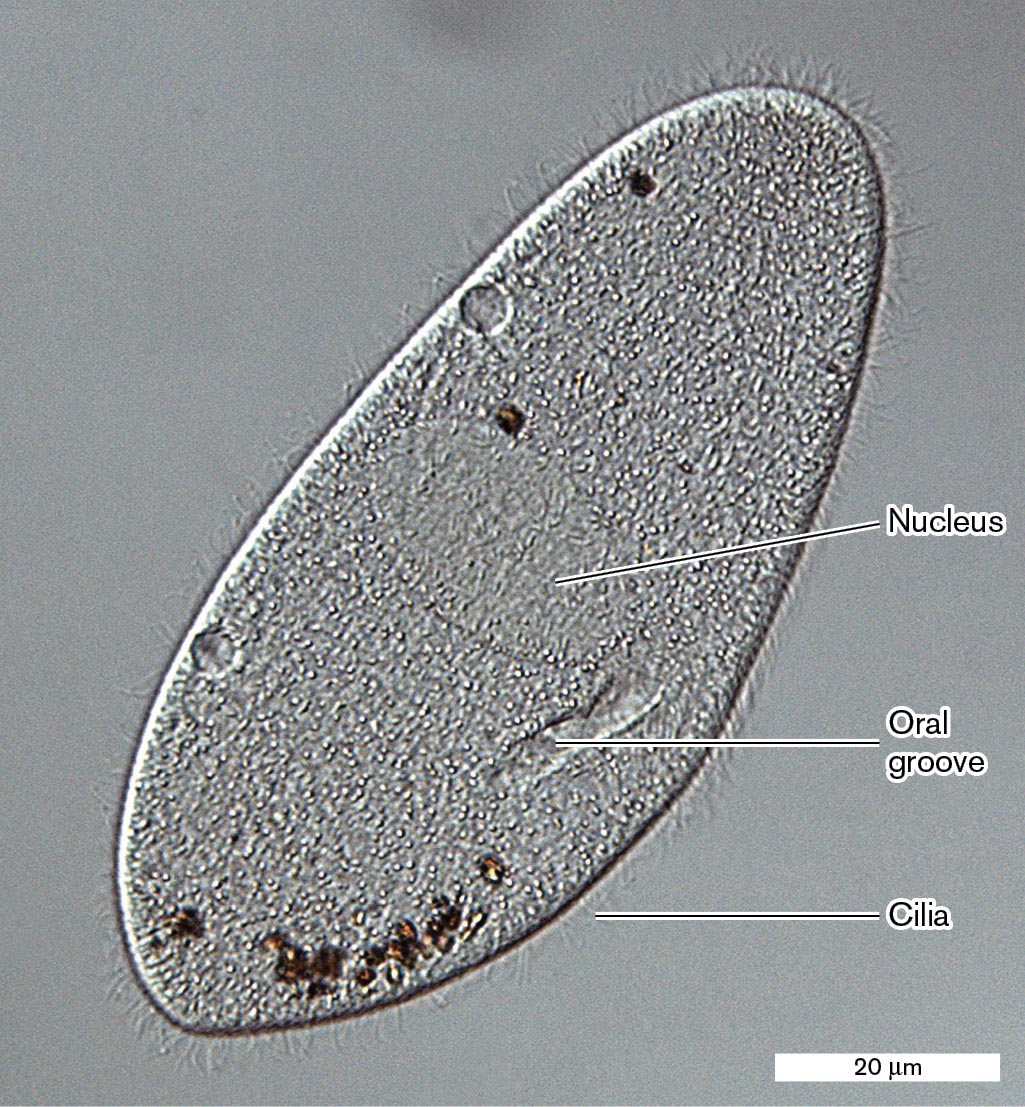
Living microbes are challenging to visualize because their watery cytoplasm is often clear, like the medium they inhabit. One way to increase contrast for living cells is phase-contrast microscopy (PCM). Phase contrast exploits differences in refractive index between the cytoplasm and the surrounding medium or between different organelles. Figure 2.18 shows a paramecium, a ciliated protist found in pond water. Under phase contrast, the cell outlines appear dark because light passes entirely through the cell envelope, whose refractive index is higher than that of cytoplasm. Differences in refractive index reveal the shape of organelles such as the nucleus, oral groove (mouth), and cilia (whiplike structures for motility).
More information
Phase-contrast microscopy shows a paramecium with a few internal structures identified. The paramecium is about 80 micrometers long and 40 micrometers wide. Cilia are visible along the outer edges of the Paramecium body. The nucleus is labeled near the center of the Paramecium. Beneath the nucleus, the oral groove is identified.
FIGURE 2.18 ■Phase-contrast microscopy (PCM) of a paramecium. Differences in refractive index reveal the nucleus, oral groove, and cilia.SCIENCE PHOTO LIBRARY/ALAMY STOCK PHOTO
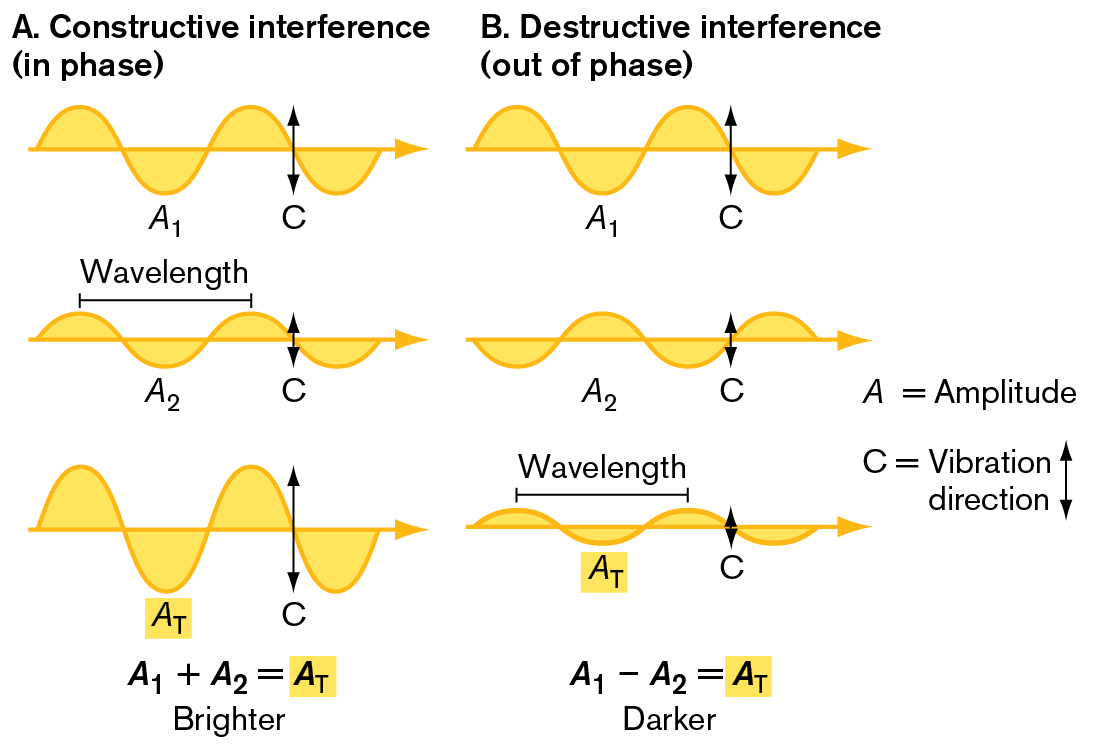
Phase-contrast optics depends on the principle of interference (introduced in Section 2.2). In interference, two wavefronts (or two portions of a wavefront) interact with each other by addition (amplitudes in phase) or subtraction (amplitudes out of phase; Fig. 2.19). The result of interference between two waves is a pattern of alternating zones of constructive and destructive interference (brightness and darkness).
The optical system for phase contrast was invented in the 1930s by the Dutch microscopist Frits Zernike (1888–1966), for which he earned the 1953 Nobel Prize in Physics. In this system, slight differences in the refractive index of the various cell components are transformed into differences in the intensity of transmitted light. Zernike’s scheme makes use of the fact that living cells have relatively high contrast because of their high concentration of solutes. Given the size and refractive index of commonly observed cells, light is retarded by approximately one-quarter of a wavelength when it passes through the cell. In other words, after passing through a cell, light exits the cell about one-quarter of a wavelength behind the phase of light transmitted directly through the medium.
The Zernike optical system is designed to retard the refracted light by an additional quarter of a wavelength, so that the light refracted through the cell is slowed by a total of half a wavelength compared with the light transmitted through the medium. When two waves are out of phase by half a wavelength, they produce destructive interference, canceling each other’s amplitude (Fig. 2.19B). The result is a region of darkness in the image of the specimen.
More information
Two illustrations depict phase interference. The first illustration shows constructive interference and the second illustration shows destructive interference.
An illustration shows constructive interference, or in phase interference. The corresponding text reads A equals amplitude, and C equals vibration direction. The first diagram shows a sinusoidal curve with two peaks at the top and two troughs. The first trough is labeled as A 1 and an arrow indicates the vibration direction is up and down. The second diagram shows a sinusoidal curve with two smaller peaks and troughs. The first trough is labeled as A 2 and an arrow indicates the vibration direction is up and down. The distance between the first and second peaks is labeled as wavelength. The peaks of the first diagram line up with the peaks of the second diagram. The third diagram shows the sinusoidal curve with two peaks and two troughs. These peaks are higher than those of the first two diagrams. The first peak at the bottom is labeled as A subscript T, and the intersecting point of the last two peaks at the top and bottom is labeled as C. An equation at the bottom reads A subscript 1 plus A subscript 2 equals A subscript T, and the text reads brighter.
An illustration shows destructive interference, or out of phase interference. The corresponding text reads A equals amplitude, and C equals vibration direction. The first diagram shows a sinusoidal curve with two peaks and two troughs. The first trough is labeled as A 1 and an arrow indicates the vibration direction is up and down. The second diagram shows a sinusoidal curve with two peaks and two troughs. The first trough is labeled as A 2 and an arrow indicates the vibration direction is up and down. The peaks of the first diagram line up with the troughs of the second diagram. The third diagram shows the sinusoidal curve with two peaks and two troughs. These peaks are lower than those of the first two diagrams. The first peak at the bottom is labeled as A subscript T, and the intersecting point of the last two peaks at the top and bottom is labeled as C. The first peak at the bottom is labeled as A subscript T. The distance between the peaks at the top is labeled as wavelength. An equation at the bottom reads A subscript 1 minus A subscript 2 equals A subscript T, and the text reads darker.
FIGURE 2.19 ■Phase interference.A. In constructive interference, the peaks of the two wave trains rise together; their amplitudes are additive (A1 + A2), forming a wave of greater total amplitude (AT). B. In destructive interference, the peaks of the waves are opposite one another, so their amplitudes cancel (A1 − A2), forming a wave of lesser amplitude.
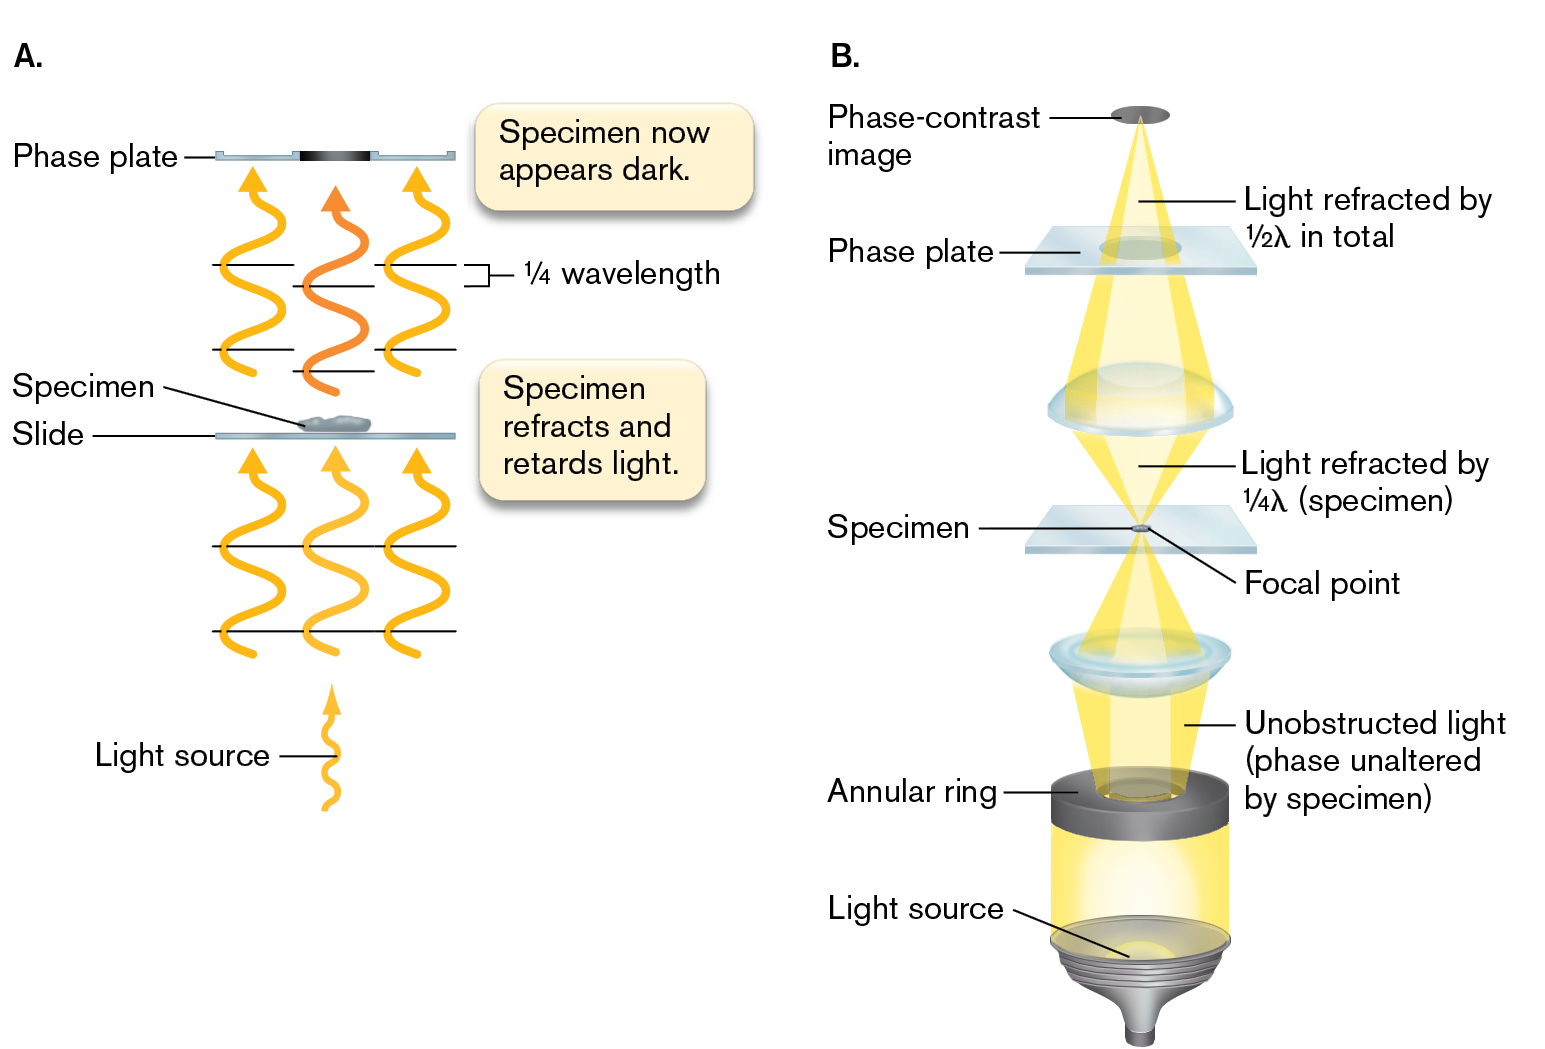
In phase-contrast microscopy, the light transmitted through the medium needs to be separated from the light interacting with the object, where it is slowed by refraction. The transmitted light is separated by a ring-shaped slit (annular ring). The annular ring generates a hollow cone of light, which is focused through the specimen and generates an inverted cone above it (Fig. 2.20). Light passing through the specimen, however, is refracted and thus bent into the central region within the inverted cone.
More information
Two illustrations show the optics of phase contrast and the structure of lenses in a phase contrast microscope.
An illustration shows the optics of phase contrast. The movement of light waves through a phase contrast microscope are shown. Waves of light from a light source hit the Specimen that is on the slide. The corresponding text reads Specimen refracts and retards light. The approximate effect of the Specimen is that the light waves after passing through it are shorter by a quarter of a wavelength. The phase plate at the top is hit by the light waves, some of which have passed through the Specimen, and some of which have not, and the corresponding text reads Specimen now appears dark.
An illustration shows the structure of lenses in the phase-contrast microscope. The light source emanates from a cone shape toward the annular ring, which narrows the light passing through. An unobstructed light, meaning the phase is unaltered by the Specimen, is placed above the annular ring. The light passes through a lens that focuses on the point of the Specimen. Light is then refracted by one-quarter wavelength by the Specimen, passes through another lens, and hits the phase plate. Light is now refracted by half wavelength in total before hitting the phase-contrast image.
FIGURE 2.20 ■Phase-contrast optics.A. The specimen retards light by approximately one-quarter of a wavelength. The phase plate contains a central disk of refractive material that retards light from the specimen by another quarter wavelength, increasing the phase difference to half a wavelength. The light from the specimen and the transmitted light are now fully out of phase; they cancel, making the specimen appear dark. B. In the phase-contrast microscope, the annular ring forms a hollow cone of light that passes through the refractive material of the specimen. When the transmitted and refracted light cones re-join at the focal point, they are out of phase; their amplitudes cancel each other, and that region of the image appears dark against a bright background.
Both the refracted light from the specimen and the outer cone of transmitted light enter the phase plate. The phase plate consists of refractive material that is thinner in the region met by the outer (transmitted) light cone. The refracted light passing through the center of the phase plate is retarded by an additional one-quarter wavelength compared with the transmitted light passing through the thinner region on the outside; the overall difference approximates half a wavelength. When the light from the inner and outer regions focuses at the ocular lens, the amplitudes of the waves cancel and produce a region of darkness. In this system, small differences in refractive index can produce dramatic differences in contrast between the offset phases of light.
Other optical systems exploit the properties of light in different ways. Differential interference contrast microscopy (DIC) with Nomarski optics superimposes interference bands on an image, accentuating small differences in refractive index. A different system, dark-field microscopy, makes use of light scattering (Fig. 2.9D). In dark-field microscopy, only the light rays scattered by an object reach the observer, whereas light rays direct from the source are bent aside. The bright object is viewed against a dark background.
To Summarize
In bright-field microscopy, image quality depends on the wavelength of light; on the magnifying power of a lens; and on the position of the focal plane, the region where the specimen is in focus (that is, where the sharpest image is obtained).
A compound microscope achieves magnification and resolution through the objective and ocular lenses.
A wet mount specimen contains living microbes.
Phase-contrast microscopy with Zernike optics superimposes refracted light and transmitted light shifted out of phase so as to reveal differences in refractive index as patterns of light and dark. Live cells with transparent cytoplasm, and the organelles of eukaryotes, can be observed with high contrast.
High refractive index of the specimen causes light to bend and pass through the highly refractive phase plate. Retarded phase partly cancels the phase of transmitted light, generating a dark edge with high contrast.
The product of the refractive index of the medium and sin θ (where θ is the angle of aperture). As numerical aperture increases, the magnification increases.
An oil with a refractive index similar to glass that minimizes light-ray loss at wide angles, thereby minimizing wavefront interference and maximizing resolution.
In a microscope, a lens that focuses parallel light rays from the light source onto a small area of the specimen to improve the resolution of the objective lens.
Observation of a microscopic object based on the differences in the refractive index between cell components and the surrounding medium. Contrast is generated as the difference between refracted light and transmitted light shifts out of phase.
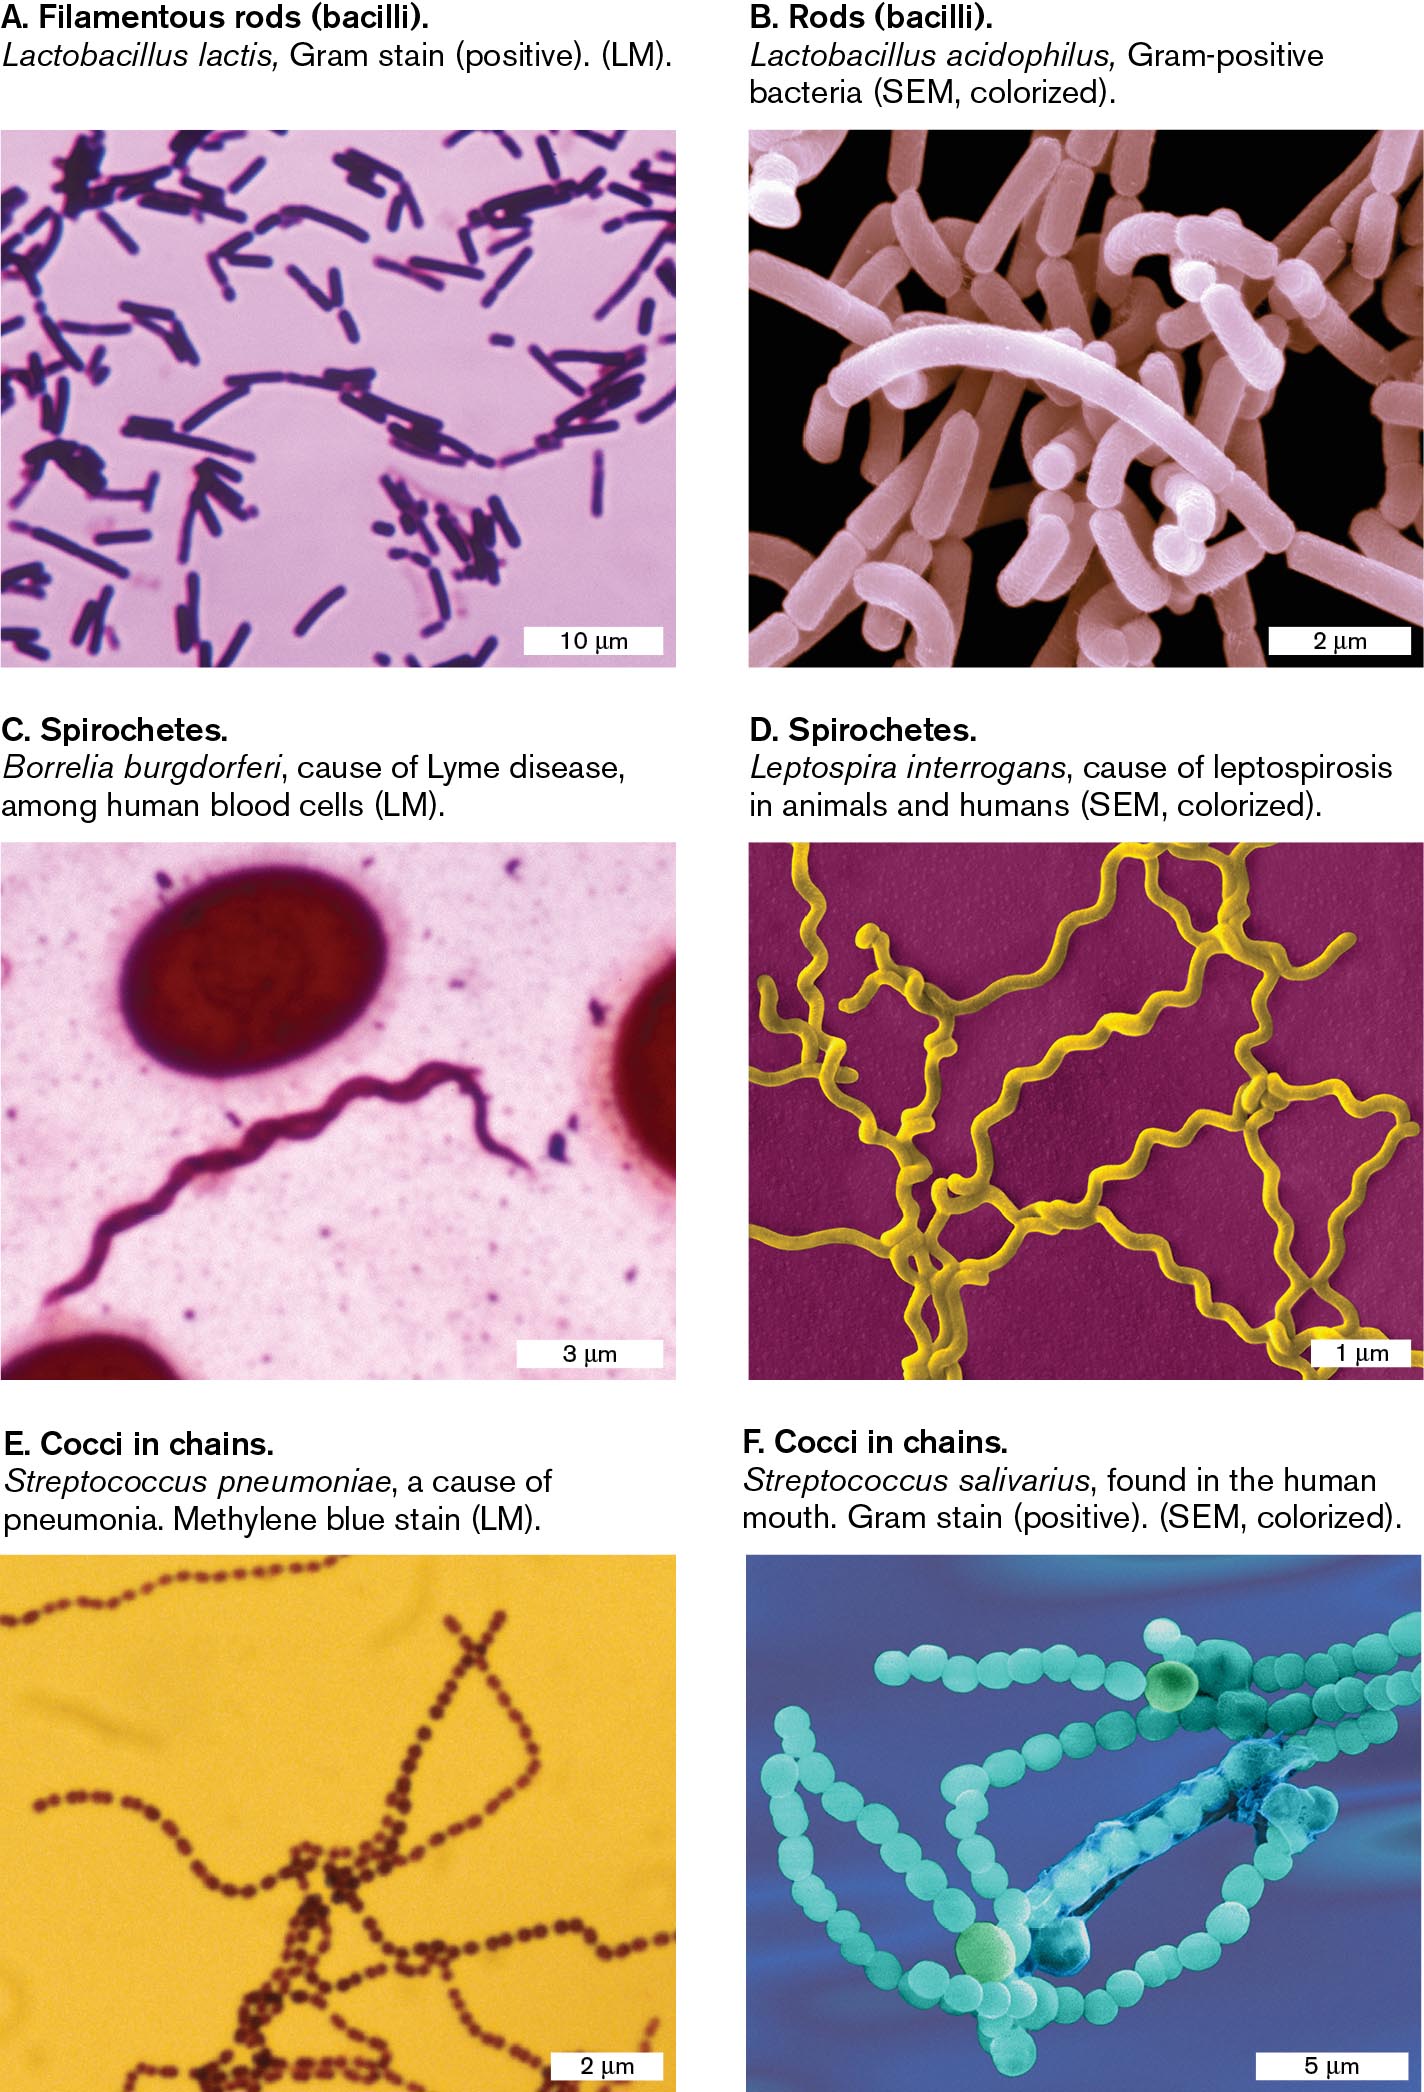
Six micrographs show examples of the common shapes seen in bacterial cells. The first micrograph shows filamentous rods. The second micrograph shows rods. The third and fourth micrographs shows spirochetes. The fifth and sixth micrographs show cocci in chains.
A micrograph of Lactobacillus lactis, a filamentous rod shaped bacteria, as seen under a light microscope. There are many rod-shaped bacteria, each 3-5 micrometers long and 1 micrometer wide. The cells are stained purple.
A micrograph of Lactobacillus acidophilus, a rod shaped bacterium, as seen with a scanning electron microscope. A group of rod shaped bacteria are clumped together. The bacterial cells are each about 2 micrometers long and 0.5 micrometer wide.
A micrograph of Borrelia burgdorferi, a spirochete shaped bacterium, as seen under a light microscope. A single spiral shaped bacterium is on the slide. The cell is about 15 micrometers long and 0.25 micrometer wide. The bacterium is stained pink.
A micrograph of Leptospira interrogans, a spirochete shaped bacterium, as seen with a scanning electron microscope. Several spiral shaped bacteria are seen overlapping each other. The bacteria are about 10 micrometers long and 0.25 micrometer wide.
A micrograph of Streptococcus pneumoniae, a coccus shaped bacterium, as seen under a light microscope. Several long chains of spherical bacteria are seen. Each bacterium is about 0.1 micrometer in diameter.
A micrograph of Streptococcus salivarius, a coccus shaped bacterium, as seen with a scanning electron microscope. Several long chains of spherical bacteria overlap each other. Each bacterium is about 1 micrometer in diameter.
FIGURE 2.6 ■Common shapes of bacteria.A, C, E. The shapes of most bacterial cells can be discerned with light microscopy (LM), but their subcellular structures and surface details cannot be seen. B, D, F. Surface detail is revealed by scanning electron microscopy (SEM). These SEM images are colorized to enhance clarity. DR. A. M. SIEGELMAN/VISUALS UNLIMITED, INC.DENNIS KUNKEL MICROSCOPY/SCIENCE SOURCEMICHAEL ABBEY/VISUALS UNLIMITEDDENNIS KUNKEL MICROSCOPY/SCIENCE SOURCEDR. A. M. SIEGELMAN/VISUALS UNLIMITED, INC.DENNIS KUNKEL MICROSCOPY/SCIENCE SOURCE
Two illustrations explain interference rings that are resolved versus unresolved.
An illustration depicts narrow interference rings with peaks that are well resolved. It consists of the focal points of light waves that exist in a dark circle. The focal points are represented as lighter dots with distinct ripples. To the right shows the interference rings and resolved rings. The interference rings consist of concentric circles and a bidirectional arrow reads image plane. An image of a narrow peak consists of an upward arrow labeled as intensity, and the bidirectional arrow is labeled as an image plane. In resolved, there are two distinct points that have overlapping concentric rings when viewed in the image plane. When viewed from the side, two distinct narrow peaks are visible.
An illustration depicts wide interference rings with peaks that are unresolved. A large circle with a white shaded region in the center. To the right shows two columns labeled interference rings and unresolved. In the interference ring, a large concentric circle is in the image plane. Below, a wider peak consists of an upward arrow labeled as intensity and a bidirectional arrow labeled as the image plane is at the bottom. In the unresolved example, two circles in the middle overlap and can not be differentiated. Below, two peaks overlap at their bases even though their top points are distinct.
FIGURE 2.12 ■Interference of light waves at the focal point generates concentric rings surrounding the peak intensity.A. Broad wavefronts generate narrow interference rings with peaks well resolved. B. Narrow wavefronts generate wide interference rings that are unresolved.
A two-part illustration shows the resolution and the numerical aperture. The first part shows low-power magnification, at 10 times, consisting of a hollow cylinder in which a semi oval-shaped object is placed at the bottom. A horizontal line labeled specimen is at the bottom. A narrow beam is inserted to the specimen through an objective at an angle that equals 15 degrees. To the right shows, two narrow peaks bonded on a circular coil labeled as poorly resolved. At the bottom it reads N A equals n sine of theta equals 1.0 times sine of 15 degrees equals 0.25. The second part shows high-power magnification, at 100 times, consisting of a hollow cylinder in which a semi oval-shaped object is placed at the bottom. A horizontal line is labeled specimen at the bottom. A narrow beam is inserted to the specimen through objective at an angle of that equals 72 degrees. A dashed vertical line is drawn in the mid of the beam. To the right shows two narrow peaks on a circular coil labeled as resolved. An at the bottom reads N A equals n sine of theta equals 1.0 times sine of 72 degrees equals 0.95. The corresponding text reads N A N theta equals Numerical aperture equals Refractive index equals 1.00 (air). Theta equals Angle of aperture.
FIGURE 2.13 ■Numerical aperture and resolution. The numerical aperture (NA) equals the refractive index (n) of the medium (air) containing the light cone, multiplied by the sine of the angle (θ) of the light cone. Higher NA allows greater resolution.
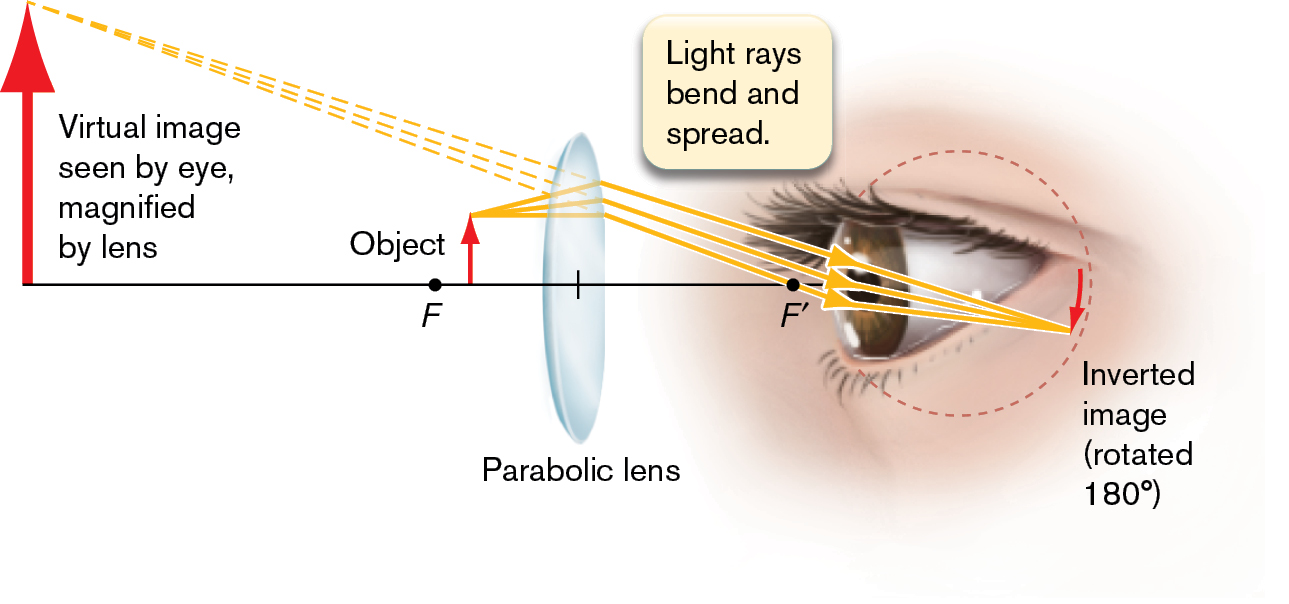
An illustration shows the magnification of an image through a lens. A horizontal line is shown. A dot at the center of the line is labeled as F, and another dot on the right side of the line is labeled as F prime. To the right of the F an upward arrow appears, labeled as an object, and to the right of the object, a parabolic lens is shown. Another upward arrow is placed at the left end of the line, and the corresponding text reads a Virtual image seen by eye, magnified by lens. An image of a human eye appears at the right end of the line to view the object and is labeled as an inverted image, rotated 180 degrees. Three dashed lines from the object arrow fall on the lens, and the inverted image is seen through the eye. A note reads light rays bend and spread.
FIGURE 2.11 ■A lens magnifies an image. The object is placed near the focal point (F) in front of the lens. The lens bends and spreads the light rays.
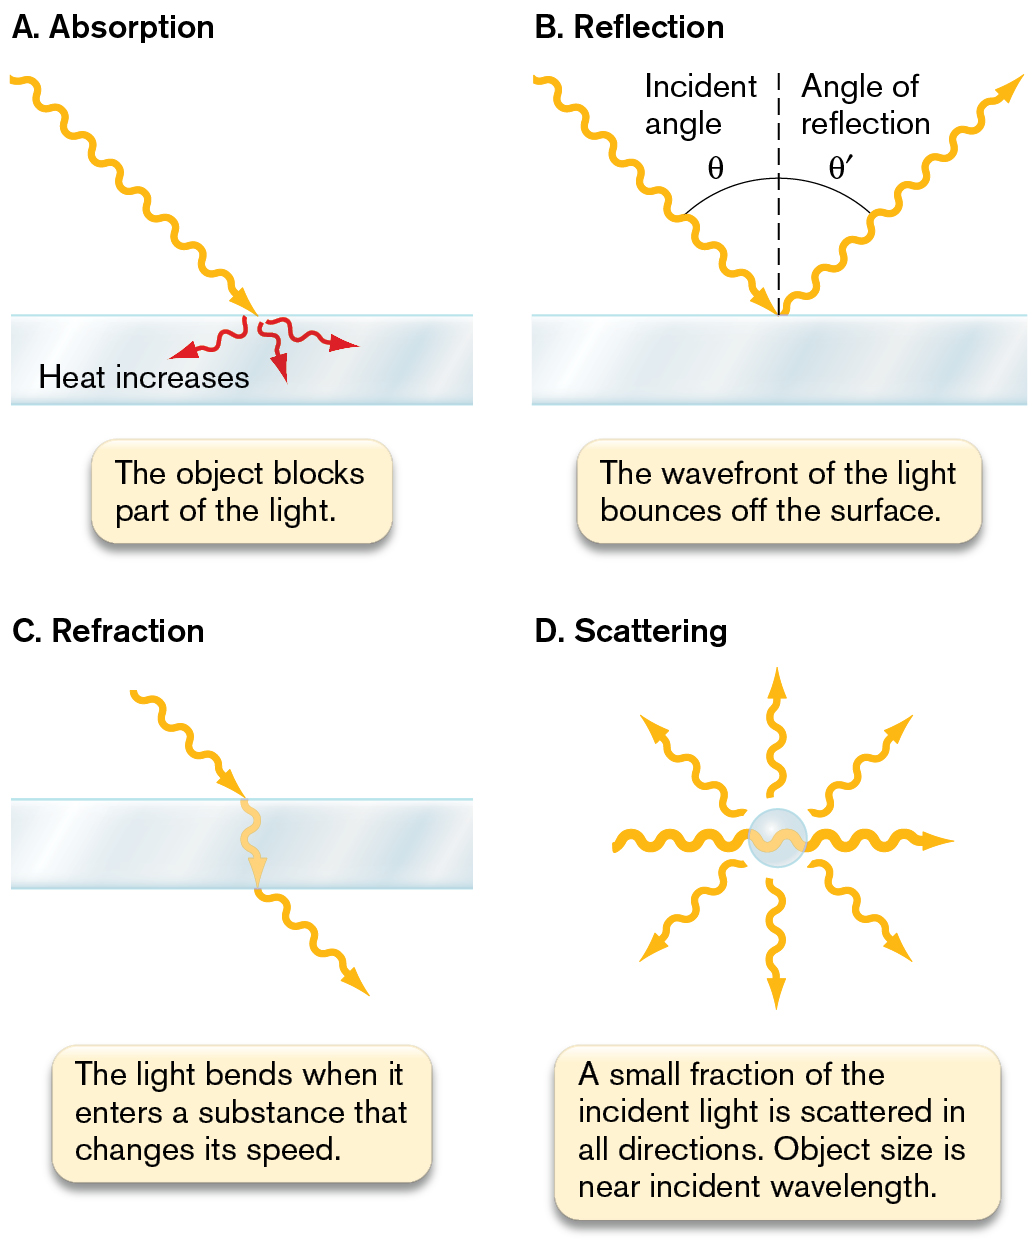
Four illustrations of different light with matter interactions. The first illustration demonstrates absorption. The second illustration demonstrates reflection. The third illustration demonstrates refraction. The fourth illustration demonstrates scattering.
An illustration labeled A shows absorption. It consists of a horizontal bar, in which a wave-shaped arrow from the top left falls on the bar and produces three different arrows within the bar labeled heat increases. The wave shaped bar represents light and the horizontal bar represents matter. The corresponding text reads the object blocks part of life.
An illustration labeled B shows reflection. It consists of a horizontal bar, in which a vertical dashed line is drawn on the midpoint of the bar. A wave-shaped arrow from the top left reaches the bar at the midpoint at an angle of incident angle theta. Another arrow from the right side of the midpoint extends upward at the same angle and exits at the top right. The angle between the dashed line and the second arrow is the angle of reflection theta prime. The horizontal bar represents matter and the wave-shaped arrow represents light. The text reads the wavefront of the light bounces off the surface.
An illustration labeled C shows refraction. It consists of a horizontal bar, in which the arrow representing light enters from the top left at an angle, travels vertically through the bar, and exits the other side of the bar at an angle. The horizontal bar represents matter. The corresponding text reads the light bends when it enters a substance that changes its speed.
An illustration labeled D shows scattering. It consists of a sphere in which the light from the left passes into the sphere and exits the right. Three arrows exit the top of the sphere, and three other arrows exit the bottom of the sphere. The corresponding text reads a small fraction of the incident light is scattered in all directions. Object size is near incident wavelength.
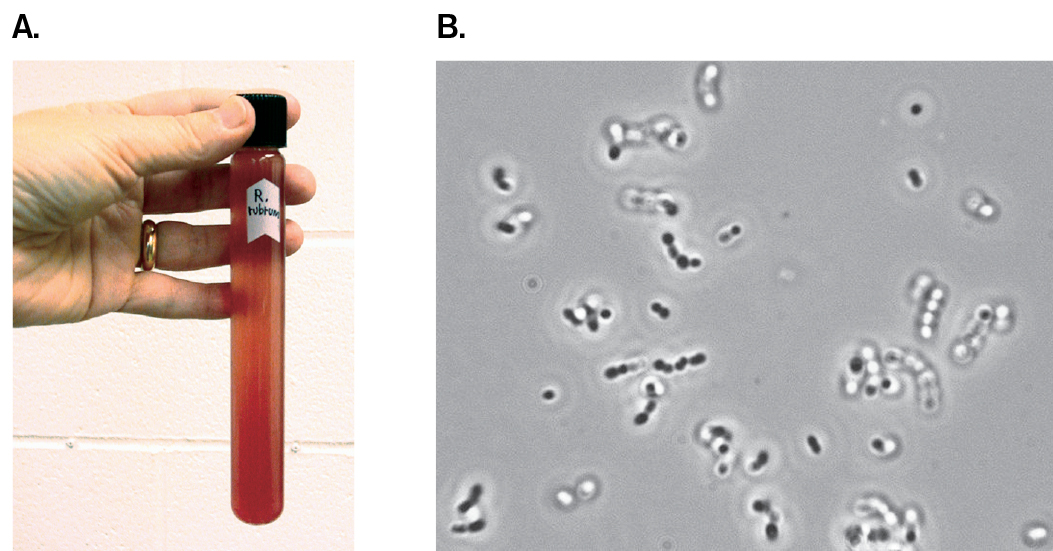
A photo of a bacterial culture tube and a micrograph of coccoid bacteria are shown.
A photo of a human hand holding a tube containing a culture of Rhodospirillum rubrum. The tube contents are turbid and red.
A micrograph of coccoid cells of Oenococcus oeni.
FIGURE 2.3 ■Detecting and resolving bacteria.A. A tube of bacterial culture, Rhodospirillum rubrum. The presence of bacteria is detected, though individual cells are not resolved. B. Individual cells of Oenococcus oeni are resolved by light microscopy.JOAN SLONCZEWSKI, KENYON COLLEGEC. M. LUCY JOSEPH, UC DAVIS DEPT. OF VITICULTURE AND ENOLOGY WINE YEAST AND BACTERIA COLLECTION
 ANSWER
 ANSWER