Trade-offs
What Is a Production Possibilities Frontier?
Now it’s time to learn our first economic model. However, before you go on, you might want to review the appendix on graphing at the end of this chapter. Graphs are a key tool in economics because they display the relationship between two variables. Your ability to read a graph and understand the model it represents is crucial to learning economics.
In Chapter 1, we learned that economics is about the trade-offs individuals and societies face every day. For instance, you may frequently have to decide between spending more time studying or hanging out with your friends, either in person or online. The more time you study, the less time you have for your friends. Similarly, a society has to determine how to allocate its resources. The decision to build new roads will mean that there is less money available for new schools, and vice versa.
A production possibilities frontier (PPF) is a model that illustrates the combinations of outputs a society can produce if all of its resources are being used efficiently. An outcome is considered efficient when resources are fully utilized and potential output is maximized. To preserve ceteris paribus, we assume that the technology available for production and the quantity of resources remain fixed, or constant. These assumptions allow us to model trade-offs more clearly.
Let’s begin by imagining a society that produces only two goods—pizza and chicken wings. This may not seem like a very realistic assumption, since a real economy produces millions of different goods and services, but this approach helps us understand trade-offs by keeping the analysis simple.
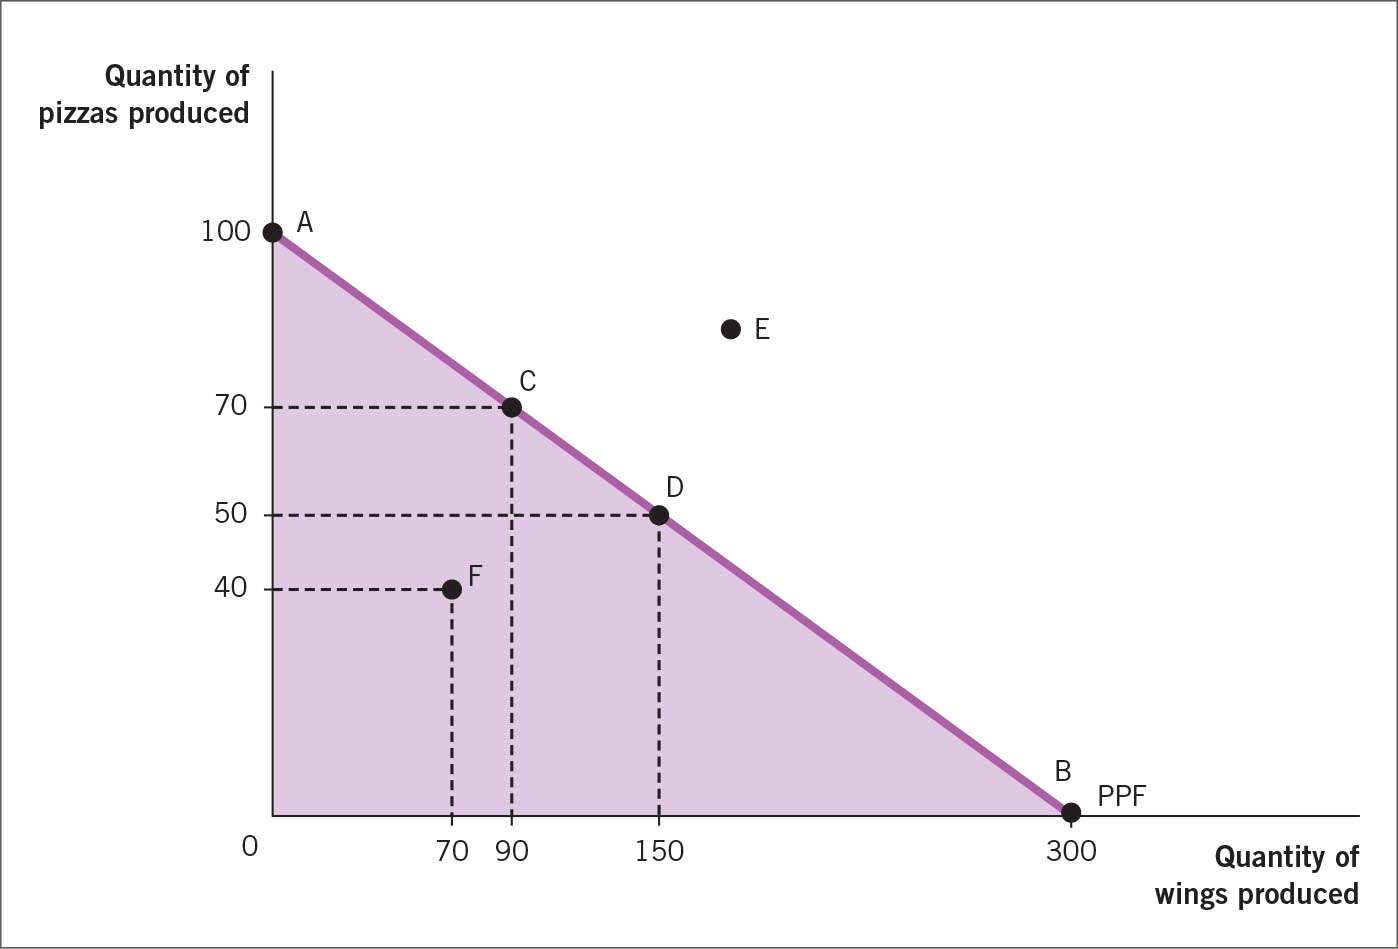
Figure 2.1 shows the production possibilities frontier for our simplified two-product society. Remember that the number of people and the total resources in this two-product society are fixed. If the economy uses all of its resources to produce pizza, it can produce 100 pizzas and 0 wings. If it uses all of its resources to produce wings, it can make 300 wings and 0 pizzas. These outcomes are represented by points A and B, respectively, on the production possibilities frontier. It is unlikely the society will choose either of these extreme outcomes, because it is human nature to enjoy variety.
If our theoretical society decides to spend some of its resources producing pizzas and some of its resources making wings, its economy will end up with a combination of pizza and wings somewhere along the PPF between points A and B. At point C, for example, the society would deploy its resources to produce 70 pizzas and 90 wings. At point D, the combination would be 50 pizzas and 150 wings. Each point along the production possibilities frontier represents a possible set of outcomes the society can choose if it uses all of its resources efficiently.
Notice that some combinations of pizza and wings cannot be produced because not enough resources are available. Our theoretical society would enjoy point E, but given the available resources, it cannot produce that output level. Points beyond the production possibilities frontier are desirable but not feasible with the available resources and technology.
At any combination of wings and pizzas along the production possibilities frontier, the society is using all of its resources in the most efficient way possible. But what about point F and any other points located in the shaded region? These points represent outcomes inside the production possibilities frontier, and they indicate an inefficient use of the society’s resources. Consider, for example, the labor resource. If employees spend many hours at work surfing the Web instead of doing their jobs, the output of pizza and wings will drop, and the outcome will no longer be efficient. As long as workers use all of their time efficiently, they will produce an efficient amount of pizza and wings, and output will lie somewhere on the PPF.
FIGURE 2.1
The Production Possibilities Frontier for Pizza and Chicken Wings
The production possibilities frontier (PPF) shows the trade-off between producing pizza and producing wings. Any combination of pizza and wings is possible along, or inside, the line. Combinations of pizza and wings beyond the production possibilities frontier—for example, at point E—are not possible with the current set of resources. Point F and any other points located in the shaded region are inefficient.
More information
A production possibilities frontier. The x axis represents quantity of wings produced. The y axis represents quantity of pizzas produced. Point A is 100 pizzas produced and 0 wings produced. Point C is 70 pizzas and 90 wings. Point D is 50 pizzas and 150 wings. Point B is 0 pizzas and 300 wings. Points A, C, D, and B lie on the production possibilities frontier, which is a straight line with a negative slope. The area under this line is shaded. Point E is 85 pizzas and 170 wings, and it lies outside the production possibilities frontier. Point F is 40 pizzas and 70 wings, and it lies inside the production possibilities frontier.
Trade-offs
Whenever society is producing on the production possibilities frontier, the only way to get more of one good is to accept less of another. Because an economy operating at a point on the frontier will be efficient, every point on the frontier represents full-capacity output. But a society may favor one point over another because it prefers that combination of goods. For example, in our theoretical two-good society, if wings suddenly become more popular, the movement from point C to point D will represent a desirable trade-off. The society will produce 20 fewer pizzas (decreasing from 70 to 50) but 60 additional wings (increasing from 90 to 150).
The Production Possibilities Frontier and Opportunity Cost
Opportunity cost
Because our two-good society produces only pizza and wings, the trade-offs that occur along the production possibilities frontier represent the opportunity cost of producing one good instead of the other. As we saw in Chapter 1, an opportunity cost is the highest-valued alternative given up to pursue another course of action. As Figure 2.1 shows, when society moves from point C to point D, it gives up 20 pizzas; this is the opportunity cost of producing more wings. The movement from point D to point C has an opportunity cost of 60 wings.
FIGURE 2.2
The Law of Increasing Opportunity Cost
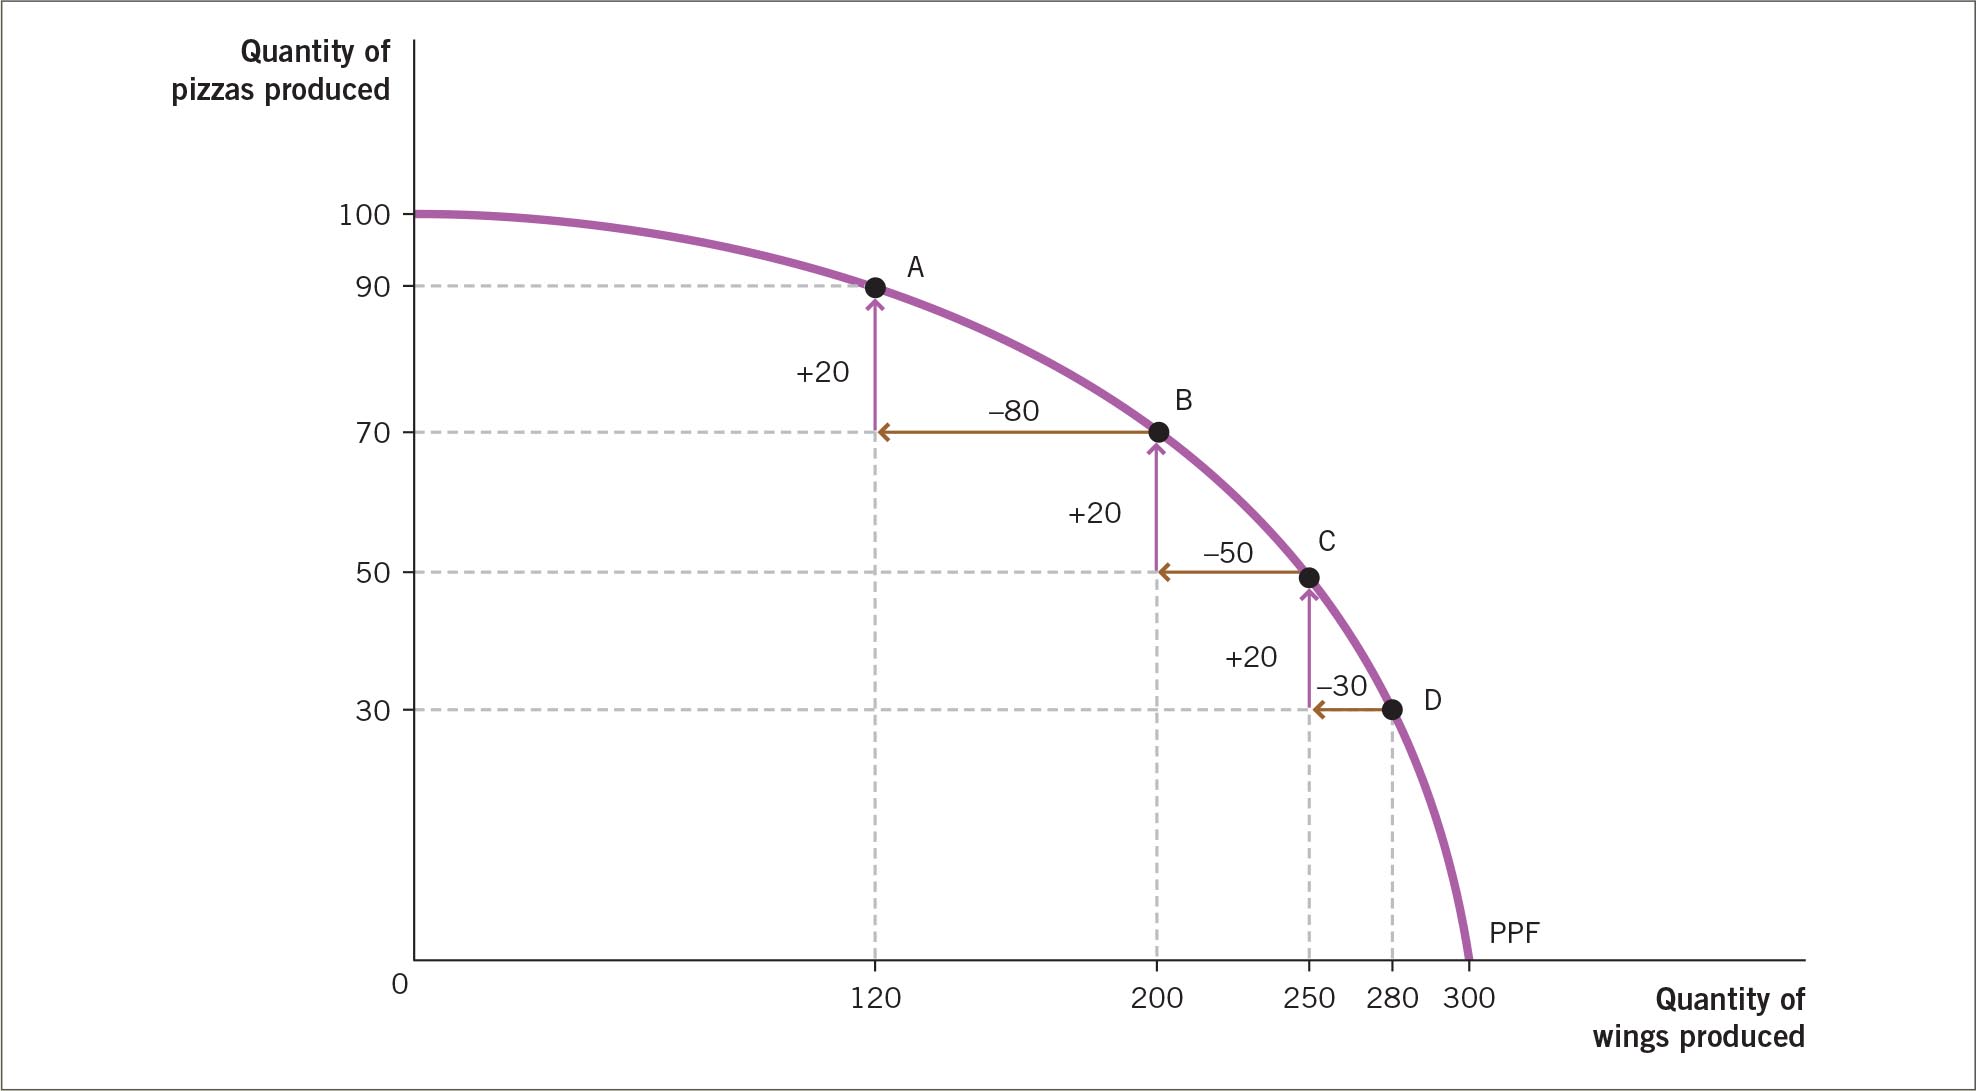
To make more pizzas, the society will have to use workers who are increasingly less skilled at making them. As we move up along the PPF, the result is the opportunity cost of producing an extra 20 pizzas rises from 30 wings between points D and C to 80 wings between points B and A.
More information
A production possibilities frontier. The x axis represents the quantity of wings produced. The y axis represents the quantity of pizzas produced. Point A is 90 pizzas and 120 wings. Point B is 70 pizzas and 200 wings. Point C is 50 pizzas and 250 wings. Point D is 30 pizzas and 280 wings. Points A, B, C, and D lie on the production possibilities frontier, which is a convex curve. Point D to Point C is a decrease of 30 wings and increase of 20 pizzas. Point C to Point B is a decrease of 50 wings and increase of 20 pizzas. Point B to Point A is a decrease of 80 wings and increase of 20 pizzas.
Until now, we have assumed a constant trade-off between the number of pizzas and the number of wings produced. However, not all resources in our theoretical society are perfectly adaptable for use in making pizza and wings. Some workers are good at making pizza, and others are not so good. When the society tries to make as many pizzas as possible, it will be using both types of workers. That is, to get more pizzas, the society will have to use workers who are increasingly less skilled at making them. For this reason, pizza production will not expand at a constant rate. You can see this effect in the new production possibilities frontier in Figure 2.2; it is bowed outward rather than a straight line.
Because resources are not perfectly adaptable, production does not expand at a constant rate. For example, to produce 20 extra pizzas, the society can move from point D (30 pizzas) to point C (50 pizzas). But moving from point D (280 wings) to point C (250 wings) means giving up 30 wings. So moving from point D to point C has an opportunity cost of 30 wings.
Now suppose that the society decides it wants even more pizzas and moves from point C (50 pizzas) to point B (70 pizzas). Now the opportunity cost of 20 more pizzas is 50 wings, because wing production declines from 250 to 200. If the society decides that 70 pizzas are not enough, it can expand pizza production from point B (70 pizzas) to point A (90 pizzas). Now the society gives up 80 wings. Notice that as we move up along the PPF from point D to point A, the opportunity cost of producing an extra 20 pizzas rises from 30 wings to 80 wings. This higher opportunity cost reflects the increased trade-off necessary to produce more pizzas.
A bowed-out production possibilities frontier reflects the increasing opportunity cost of production. Figure 2.2 illustrates the law of increasing opportunity cost, which states that the opportunity cost of producing a good rises as a society produces more of it. Changes in relative cost mean that a society faces a significant trade-off if it tries to produce an extremely large amount of a single good.
The Production Possibilities Frontier and Economic Growth
So far, we have modeled the production possibilities frontier based on the resources available to society at a particular moment in time. However, most societies hope to create economic growth. Economic growth is the process that enables a society to produce more output in the future.
We can use the production possibilities frontier to explore economic growth. For example, we can ask what would happen to the PPF if our two-good society develops a new technology that increases productivity. Suppose that a new pizza assembly line improves the pizza production process and that the new assembly line does not require the use of more resources—it simply redeploys the resources that already exist. This development would allow the society to make more pizza with the same number of workers. Or it would allow the same amount of pizza to be made with fewer workers than previously. Either way, the society has expanded its resource base. Figure 2.3 shows this change as a shift in the PPF.
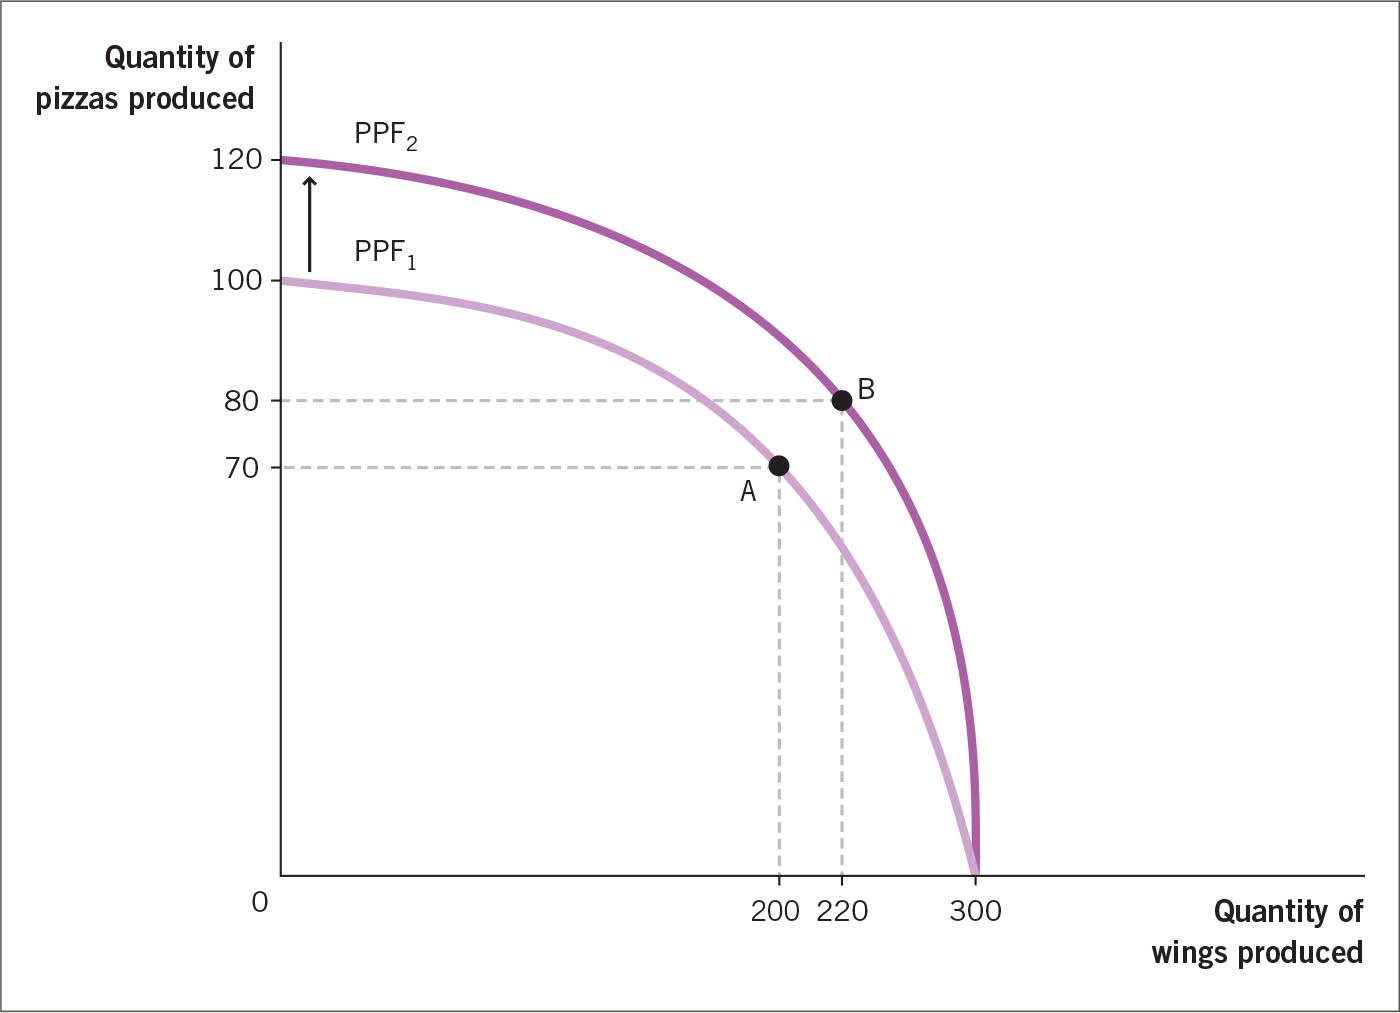
With the new technology, it becomes possible to produce 120 pizzas using the same number of workers and in the same amount of time it previously took to produce 100 pizzas. Although the ability to produce wings has not changed, the new pizza-making technology expands the production possibilities frontier outward from PPF1 to PPF2. It is now possible for the society to move from point A to point B, where it can produce more of both goods (80 pizzas and 220 wings). Why can the society produce more of both? Because the improvement in pizza-making technology—the assembly line—allows a redeployment of the labor force that also increases the production of wings. Improvements in technology make point B possible.
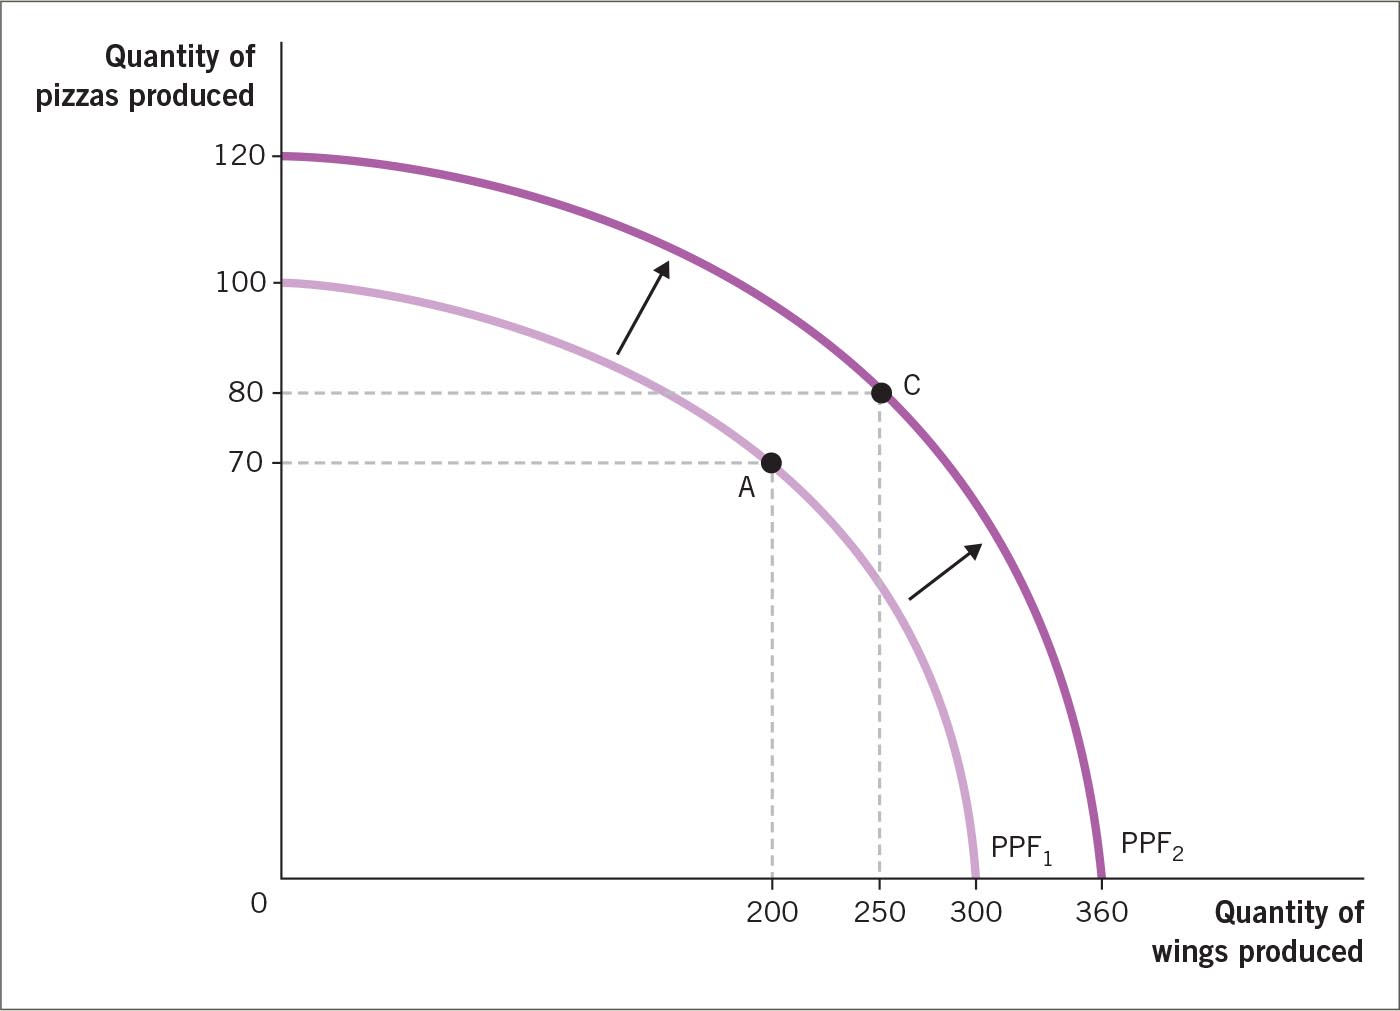
The production possibilities frontier will also expand if the population grows. A larger population means more workers to make pizza and wings. Figure 2.4 illustrates what happens when the society adds workers to help produce pizza and wings. With more workers, the society can produce more pizzas and wings than before. The PPF curve shifts from PPF1 to PPF2, expanding up along the y axis and out along the x axis. Like improvements in technology, additional resources expand the frontier and allow the society to reach a point—in this case, point C—that was not possible before. The extra workers have pushed the entire frontier out—not just one end of it, as the pizza assembly line did.
FIGURE 2.3
A Shift in the Production Possibilities Frontier
A new pizza assembly line that improves the productive capacity of pizza makers shifts the PPF upward from PPF1 to PPF2. More pizzas can be produced. Comparing points A and B, you can see that the enhanced pizza-making capacity also makes it possible to produce more wings at the same time.
More information
The effect of expanded pizza production capacity. The x axis represents the quantity of wings produced. The y axis represents the quantity of pizzas produced. Production possibilities frontier 1 is a convex curve that extends from the point with 0 wings and 100 pizzas to the point with 300 wings and 0 pizzas, while passing through Point A producing 200 wings and 70 pizzas. Production possibilities frontier 2 is a curve expanded upward but not rightward. It extends from the point with 0 wings and 120 pizzas to the point with 300 wings and 0 pizzas, while passing through the Point B producing 220 wings and 80 pizzas.
FIGURE 2.4
More Resources and the Production Possibilities Frontier
When more resources (such as additional workers) are available for the production of either pizza or wings, the entire PPF shifts upward and outward. This shift makes point C, along PPF2, possible.
More information
The effect of increased resources. The x axis represents the quantity of wings produced. The y axis represents the quantity of pizzas produced. Production possibilities frontier 1 is a curve that extends from the point with 0 wings and 100 pizzas to the point with 300 wings and 0 pizzas, while passing through point A producing 200 wings and 70 pizzas. Production possibilities frontier 2 is a convex curve expanded both upward and rightward that extends from the point with 0 wings and 120 pizzas to the point with 360 wings and 0 pizzas, while passing through point C producing 250 wings and 80 pizzas.
PRACTICE WHAT YOU KNOW
The Production Possibilities Frontier: Bicycles and Cars
More information
A yellow Porsche parked in a neighborhood. Next to the car is a mother riding a bicycle with a small boy sitting behind her.
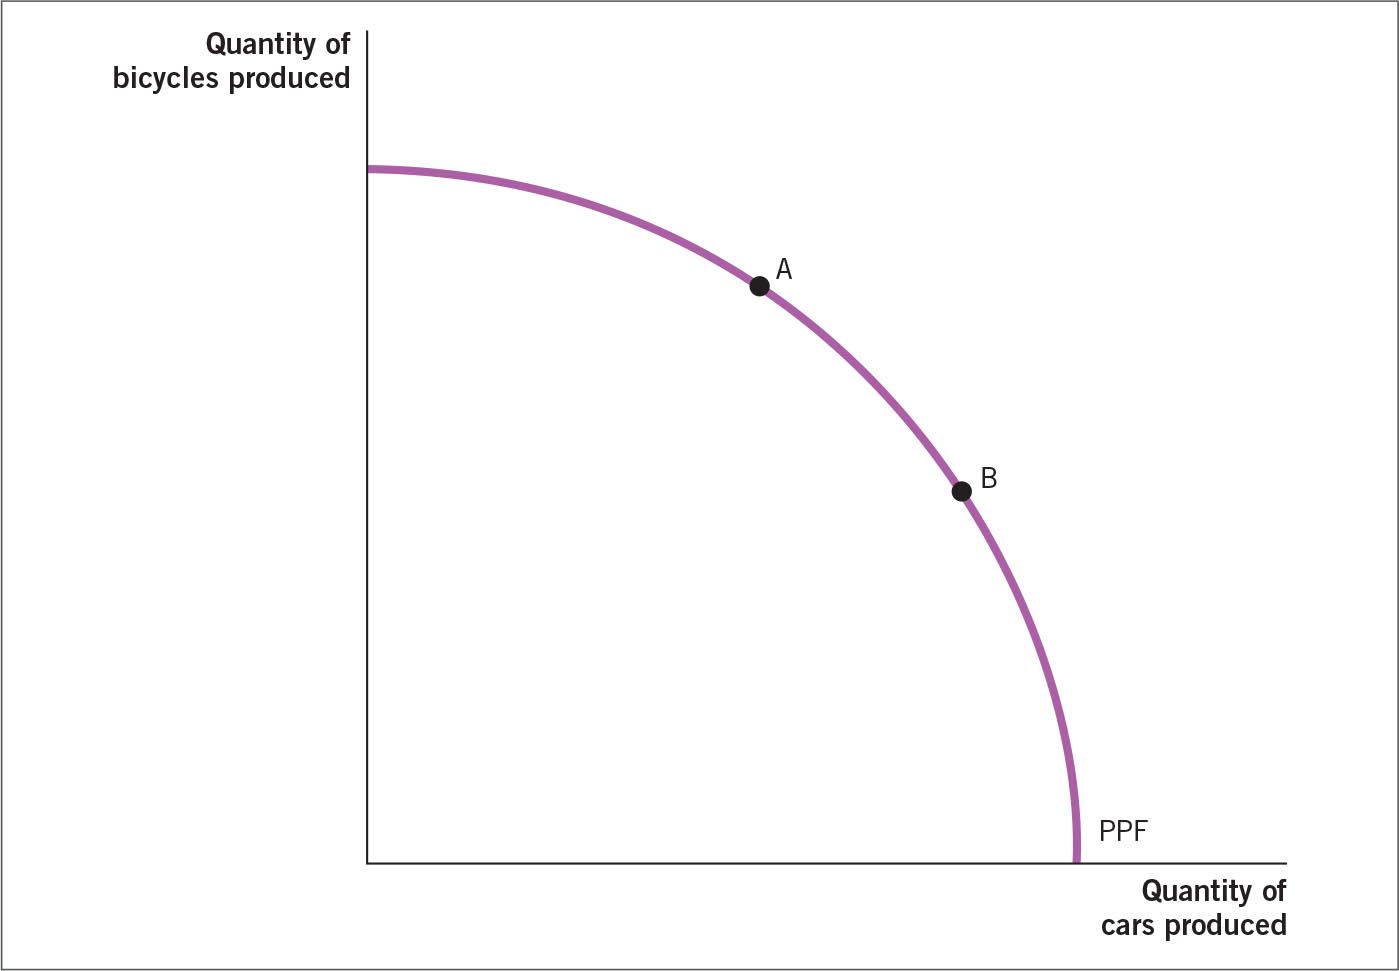
QUESTION: Are the following statements true or false? Base your answers on the PPF shown below.
- Point A represents possible numbers of cars and bicycles that can be sold.
- The movement along the curve from point A to point B shows the opportunity cost of producing more bicycles.
- If society experiences a substantial increase in unemployment, the PPF shifts inward.
- If an improved process for manufacturing cars is introduced, the entire PPF will shift outward.
- If society is operating on the PPF, it is possible to produce more cars and bicycles simultaneously.
More information
A line graph showing the production possibilities frontier curve. The x axis represents the quantity of cars produced. The y axis represents the quantity of bicycles produced. The production possibilities frontier is a convex curve passing through points A and B.
 ANSWERS
 ANSWERS:
- False. Moving from point A to point B shows the opportunity cost of producing more cars, not more bicycles.
- False. Higher unemployment does not shift the curve inward, because the PPF is the maximum that can be produced when all resources are being used efficiently. More unemployment would locate society at a point inside the PPF, because some people who could help produce more cars or bicycles would not be working.
- False. The PPF will shift outward along the car axis, but it will not shift upward along the bicycle axis.
- False. Since society is operating on the PPF, all resources are already in use. This means that it is impossible to simultaneously produce more cars and bicycles, given the resource constraint in place. However, if we relax the resource constraint, by adding more labor or capital, then the PPF can move outward and allow for a simultaneous increase in both goods.
Glossary
- production possibilities frontier (PPF)
- A production possibilities frontier (PPF) is a model that illustrates the combinations of outputs a society can produce if all of its resources are being used efficiently.
- law of increasing opportunity cost
- The law of increasing opportunity cost states that the opportunity cost of producing a good rises as a society produces more of it.