A law professor decides that it is time to buy a house. After careful research into neighborhoods and land values, she picks one. With her excellent credit history and prestigious job, she easily obtains a mortgage over the phone. When the mortgage forms arrive in the mail, she sees to her surprise that the phone representative has identified her race as “white.” Smiling, she checks another box, “African American,” and mails back the form. Suddenly, everything changes. The lending bank wants a bigger down payment and a higher interest rate. When she threatens to sue, the bank backs down. She learns that the bank’s motivation is falling property values in the proposed neighborhood. She doesn’t understand this; those property values were completely stable when she was researching the area. Then she realizes that the values plummeted because of institutional racism: the bank decreased the property values at the mere possibility of a Black homeowner (Williams) moving into the neighborhood.
Patricia Williams’s (1997) experience is not an isolated case, nor is it a historical outlier. Indeed, Drs. Nathan Connolly and Shani Mott, both professors at Johns Hopkins University in Baltimore, found in 2022 that their home appraised almost $300,000 lower when the appraiser knew they were African American. When they removed any evidence that a Black family lived in the home, the appraisal suddenly increased from $470,000 to $750,000 (Kamin 2022). Sociological studies have found this pattern in every major social institution in the United States: Membership in socially constructed categories of race and ethnicity often carries a high price for individuals. We now look at other ways this price might be paid in the areas of family, health, education, work, and criminal justice.
Family
Race, ethnicity, and their correlates (such as socioeconomic status) shape family life in a variety of ways. Data from the U.S. Census Bureau (2022f) show that African Americans are more likely than whites and Hispanic Americans to never marry. While there has been a significant retreat from marriage across all racial groups, the decline has been steeper for Black Americans than white Americans (Cohen and Pepin 2018). While 50 percent of white households and 45 percent of Hispanic households include a married couple, the same is true of just 27 percent of Black households (U.S. Census Bureau 2022c). This means that Black children are significantly more likely to live in single-parent homes. In 2022, for example, 76 percent of white children lived with two parents compared to 68 percent of Hispanic children and just 41 percent of Black children; nearly half of all Black children live with their mother only (U.S. Census Bureau 2022e).
IN RELATIONSHIPS
From the Lovings to Megxit: Interracial Dating and Marriage
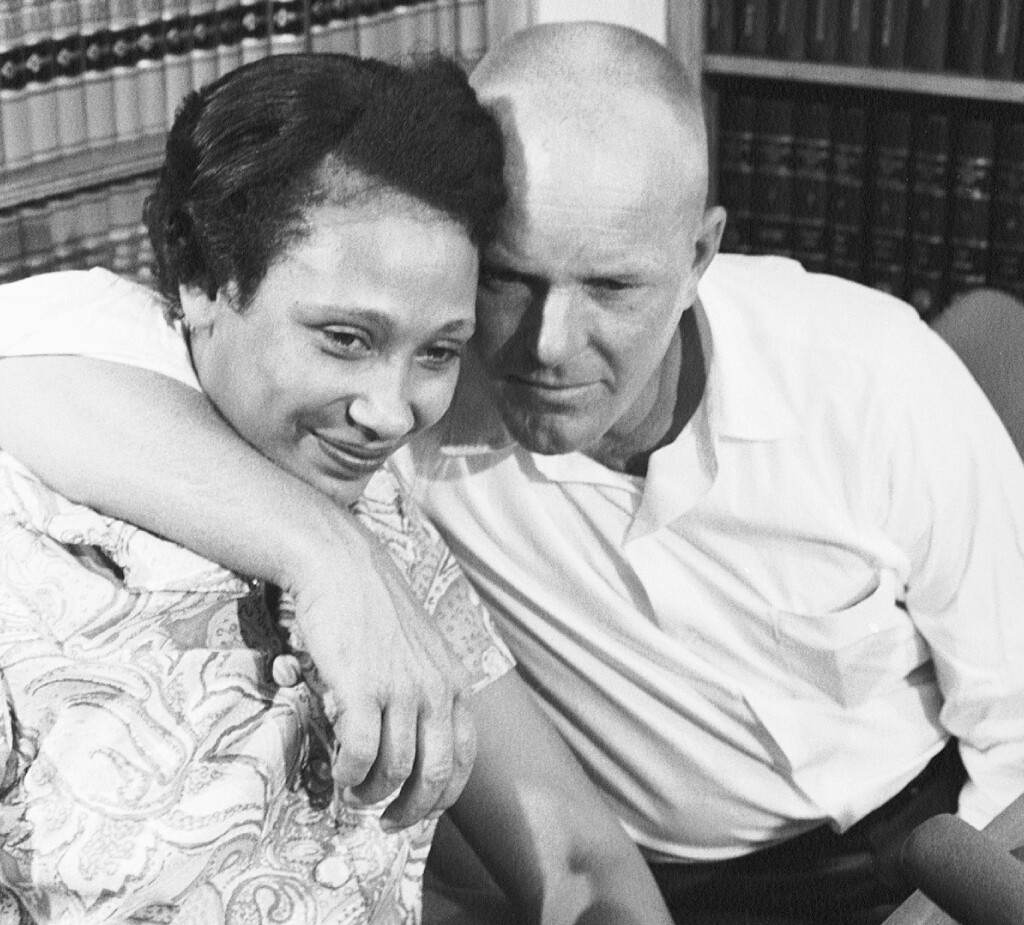
Though it is now rather commonplace, at one point in history forty-one out of the fifty American states prohibited miscegenation—the romantic, sexual, or marital relationships between people of different races. In 1958, for example, Mildred and Richard Loving, an African American woman and a white man, married and settled in their native state of Virginia. In July of that year, they were arrested for violating the state’s “Act to Preserve Racial Purity” and convicted. The judge sentenced them to a year in prison but suspended the sentence on the condition that the couple leave the state. The Lovings moved to Washington, DC, where in 1967 the Supreme Court overturned all such laws, ruling that the state of Virginia had denied the Lovings their constitutional rights. While the Loving decision technically cleared the way for interracial marriages nationwide, states were slow to change their laws. It wasn’t until 2000 that the state of Alabama finally overturned the last antimiscegenation statute left in the nation.
Just because it’s legal doesn’t always make it easy. People who date interracially may still face stigma and discrimination at a social and personal level. They may have to deal with in-group pressures from family, peers, and others to date (and especially marry) someone of their own race. Partnering with someone outside one’s group may be perceived as being disloyal and can elicit strong sanctions from other members. Stereotypes about members of different racial and ethnic groups are also slow to disappear. People may hold on to racist and sexist notions about the attributes (or deficits) of men and women from different ethnic backgrounds and their suitability as romantic partners. We see these tensions played out in popular culture, in films, on TV, and in our own everyday lives. But real change is happening.
More information
The woman is resting against the man, who has his arm around her.
Mildred and Richard Loving Their marriage was illegal in 1958.
As diversity has rapidly increased in the United States, so has the number of interracial marriages. Young adults have more relationships with more people from diverse backgrounds, and they are more favorable to forming a romantic partnership with someone from another racial or ethnic group. Spurred in part by a rise in immigration to the United States, interracial marriage has increased steadily, from just 0.4 percent of all married people in 1960 to 11 percent in 2019; the share climbs to 19 percent among newlyweds, who have had perhaps the most diverse dating pool of any generation (Parker and Barroso 2021). These figures do not yet reflect same-sex partners or unmarried cohabiters, groups that would certainly add to the trend.
The prevalence of interracial marriage varies by demographic group and at the intersections of race, gender, age, and education. Although the data point to a marked rise in interracial marriage across all the major ethnic and racial groups in the United States, intermarriage is most common among Asians (29 percent of newlyweds) and Hispanics (27 percent), followed by African Americans (18 percent) and whites (11 percent). The data are somewhat complex. For instance, if we also consider the variable of gender, Asian women marry outside their race far more often than Asian men do, whereas African American women marry far less often outside their race than African American men do. Finally, interracial marriage is somewhat more common among those who are college educated (Livingston and Brown 2017).
Since the time of the Loving case, society’s attitudes about mixed-race relationships have radically changed, becoming much more positive. In a recent survey, 39 percent of Americans said that marrying someone of a different race was good for society. More Millennials say this is a good trend than do Gen Xers or Baby Boomers (Livingston and Brown 2017). The decline in disapproval rates over time is even more dramatic: The number of non-Black adults who said they would be opposed to a close relative marrying a Black person declined from a high of 63 percent in 1990 to a low of 14 percent in 2017. Disapproval for interracial marriage to Hispanics or Asians is just 9 percent, and for whites it is 4 percent.
More information
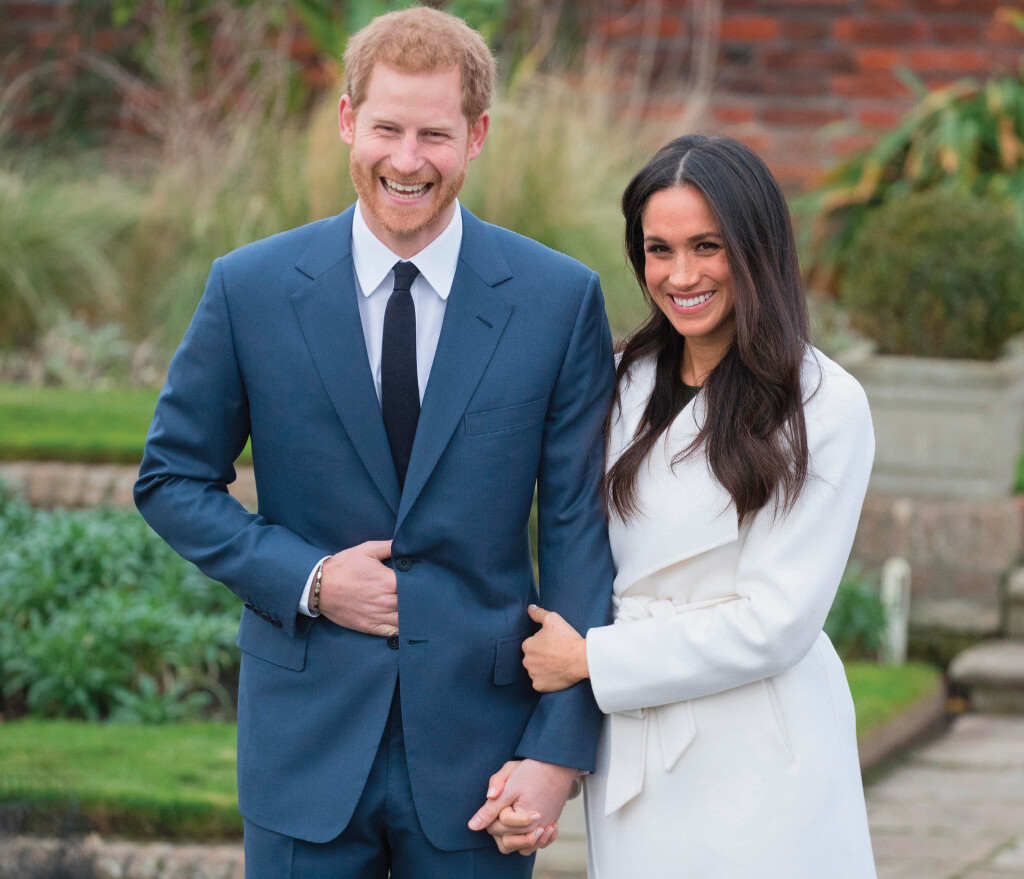
The man’s right hand is half-tucked in the folds of his suit jacket, while his left hand is clasping the woman’s right hand. Meghan Markle is leaning into Prince Harry and holding onto his left arm with her right hand.
The Royal Couple Prince Harry and Meghan Markle’s interracial marriage made history. The couple has spoken candidly about dealing with racism, and ultimately decided to step away from royal life in what was dubbed “Megxit.”
Stigma, prejudice, and restrictive racial stereotypes, as well as entrenched negative beliefs on the part of some people, all remain persistent challenges to creating a more widely accepting, multicultural, and multiracial society. Nonetheless, the rise in interracial marriage is an indication of significant social change. One researcher said that this trend “reflects an important shift toward blurring a long-held color line in the United States” (Frey 2014a).
Kathryn Edin (Edin and Kefalas 2005) has argued that low-income women of all ethnicities see marriage as having few benefits. They feel that the men they are likely to encounter as possible husbands will not offer the advantages (financial stability, respectability, trust) that make the rewards of marriage worth the risks. This doesn’t mean, of course, that most low-income women don’t love their male companions; it only means that they believe a legal bond would not substantially improve their lot in life.
Mass incarceration has had a profound impact on American families, particularly Black families. A Black child is six times as likely as a white child to have a parent who is currently in prison or spent time in prison (Morsy and Rothstein 2016). Incarcerated men are less likely to marry and, if they do marry, more likely to divorce than men who have not been incarcerated. Incarcerated fathers are also less involved with their families even after they are released from prison, and mothers with incarcerated partners are more likely to experience depression. As for the children of incarcerated parents, they are more likely than their counterparts to experience an array of negative outcomes, including behavioral and mental health problems (Lee and Wildeman 2021). As sociologist Hedwig Lee explains, “Taken together, family incarceration may send generational ripples that impact the health of the entire family” (Savat 2021).
Health
Health is an area in which we find widespread disparities among racial and ethnic groups. Whites have typically fared better in health matters than minorities, although this is not always the case. Recent findings reveal a complicated picture of the nation’s health when intersections among race, class, and gender are taken into account.
One way of measuring health is to look at life expectancy and mortality rates. White male children born in 2019 can expect to live to be around 76 years old, while white females can expect to live to 81. African American males’ life expectancy is 71 years, and African American females’ is 78. Notably, Hispanics have the highest life expectancy, higher even than whites: 79 years for Hispanic men and 84 for Hispanic women (National Center for Health Statistics 2023). Other important indicators of health are infant and maternal mortality: Black mothers die from pregnancy complications at a rate of over three times that of other mothers (Creanga et al. 2012), and infant mortality for Black babies is more than double that of white babies (Villarosa 2018).
These variables are part of a robust case that can be made for the negative effects of racism on the health of racial and ethnic minorities in the United States. Public health researcher Arline Geronimus (2006, 2023) coined the term “weathering” to describe the ways that exposure to racism erodes one’s health: Americans of color experience higher levels of chronic disease and lower life expectancies than more advantaged white Americans. Racial and ethnic minorities are also often disproportionately exposed to other factors that affect life span, such as dangers in the workplace, toxins in the environment, and violence.
Although Covid-19 has been called the “great equalizer,” people of color were disproportionately affected by the virus, experiencing higher infection and death rates than non-Hispanic whites (Centers for Disease Control and Prevention 2021d). These racial disparities can be traced to a number of factors, many of which intersect with class in key ways: People of color are more likely to work as essential and frontline workers and to live in crowded housing, increasing their risk of exposure to Covid-19. Inequality in access to health care, as well as discrimination in the health care system, also contributed to these disparities (Covid Tracking Project 2021).
An ongoing issue for Americans is access to health insurance and medical services. Many Americans rely on insurance benefits provided through their employer if they have a job with such benefits; if not, they must buy individual insurance policies in order to meet their medical needs, and many Americans cannot afford even basic health care coverage. Although the passage of the Affordable Care Act reduced uninsured rates, particularly among racial and ethnic minorities, disparities remain: Among the nonelderly population, 19 percent of Hispanics and 11 percent of Black people lack health insurance, compared to just 7 percent of whites and 6 percent of Asians (Artiga, Hill, and Damico 2022).
Education
Getting an education is extremely important in American society. Not only does it translate to greater success in the workforce, but it also confers social status and cultural capital that can prove valuable in other arenas. One of America’s cultural myths is that everyone has equal access to education, the key to a secure, well-paying job. However, by looking at those who actually receive degrees, we can see that the playing field is not level. The high school graduation rate is 93 percent for Asians, 89 percent for whites, 82 percent for Hispanics, and just 80 percent for Black Americans (National Center for Education Statistics 2023e). The reasons for dropping out of high school are complex, but the highest rates are associated with those from economically disadvantaged and non-English-speaking backgrounds. Hispanics have the highest high school dropout rate of all racial groups, at 8 percent, a rate nearly twice that of white students.
Victor Rios (2017) spent five years in schools and community centers documenting what happens to Latino youth in what has been called the school-to-prison pipeline. Rios traces a pattern in which some Latino youth experience negative encounters with teachers and other school authorities who misunderstand the students’ cultural cues and background. This can cause those students to be labeled as “bad,” “deviant,” or “at risk,” further stigmatizing them within the school system. There may be greater scrutiny and punishment of Latino youth, sometimes leading to suspension or expulsion from school. This process serves to criminalize Latino youth, sending them on a path away from education and mainstream society. At the same time, these youths are also surveilled by police in their communities, where they may experience similarly negative interactions and consequences.
In higher education, there are similar disparities of achievement. Whereas 59 percent of Asians and 42 percent of whites over age twenty-five have a bachelor’s degree or higher, the same is true of 28 percent of African Americans and 21 percent of Hispanics (Figure 8.2). Thus, Asian and white Americans enjoy more success overall in the U.S. educational system than African Americans and Hispanics do. The reasons for the disparity are again complex, involving both economic and cultural factors. As noted in Chapter 7, students from lower-income families are less likely to go on to college, and ethnic minority families tend to have lower household incomes than white households.
FIGURE 8.2Americans over Age Twenty-Five with Bachelor’s Degrees by Race/Ethnicity, 2022
SOURCE: U.S. Census Bureau 2023a.
Claude Steele (2010) has identified something called “stereotype threat,” a social-psychological mechanism at play among minority college students that hinders their academic performance. Steele discovered that negative racial stereotypes may adversely affect African American students when they are in highly demanding situations in which they might risk confirming those stereotypes. In competitive, high-stakes academic conditions (such as test taking), stereotype threat can cause sufficient anxiety in those students to effectively harm their abilities. In less stressful situations, when no negative stereotypes are invoked, these students perform as well as peers of other races. Steele suggests that stereotype threat may help explain some of the achievement gap between racial groups. Jennifer Lee and Min Zhou (2015) have identified an inverse phenomenon that they call “stereotype promise.” Because there are positive stereotypes associated with the academic performance of Asian Americans, those students may reap benefits in similarly stressful situations when they might confirm such stereotypes.
Work and Income
Persons of color carry the burden of some of society’s most difficult jobs. In 2022, 33 percent of all home health aides and 40 percent of all postal clerks were Black, while Hispanics were more likely to be employed in construction (51 percent of all construction workers) and as maids and housecleaners (51 percent of total) (U.S. Bureau of Labor Statistics 2023b). Except for nursing, these jobs are more likely to be semiskilled or unskilled. Thus, people of color, who are less likely to achieve high levels of education, are more likely to swell the bottom rungs of the job market. Interestingly, some lower-level jobs have shifted from African Americans to Hispanics over time. For instance, in 1983, African Americans accounted for 42 percent and Hispanics for 12 percent of all private household cleaners; by 2022, Black people accounted for only 16 percent. A similar shift may be seen with other low-wage jobs. This means that persons of color increasingly compete with one another for such jobs.
In part due to the segregation of people of color in low-wage occupations, we see enduring income gaps between white workers and Black and Hispanic workers. In 2021, the median household income was $101,418 for Asians, $77,999 for whites, $57,981 for Hispanics, and $48,297 for African Americans (Semega and Kollar 2022). In other words, the median incomes of Black and Hispanic households are just 62 percent and 74 percent, respectively, of that of white households. Black and Hispanic Americans are also more likely to live in poverty: In 2021, 8 percent of whites lived below the poverty line, compared with 20 percent of African Americans and 17 percent of Hispanics (Creamer et al. 2022). These numbers make it easy to see how race and class intersect to influence life outcomes.
Racial discrimination contributes to the problems minorities face in the U.S. labor market. One study looked at the impact of racially identifiable names on one’s chances of receiving job callbacks from employers (Bertrand and Mullainathan 2004). Researchers submitted résumés in response to help-wanted ads in Boston and Chicago. To manipulate the perception of race, each résumé was assigned either a stereotypically white name such as Emily or Greg or a Black-sounding name such as Lakisha or Jamal. The study results showed marked discrimination. Résumés with white-sounding names garnered a 50 percent higher callback rate than identical résumés with Black-sounding names. When the researchers listed additional qualifications, the higher-quality résumé elicited 30 percent more callbacks for the white applicants but a far smaller increase for Black applicants. Discrimination occurred regardless of the job occupation or industry.
ON THE JOB
Diversity Programs: Do They Work?
Many workplaces—academic, government, and corporate—are experimenting with different programs in an effort to increase the diversity of their workforces. A quick look at the numbers and it is clear why these programs are necessary: At the start of 2023, there were only six African American CEOs and fifty-three female CEOs of Fortune 500 companies, representing 1 percent and 10 percent of CEOs, respectively. With companies like Bank of America settling huge race-discrimination lawsuits in recent years, the stakes are high, but what do we know about these different initiatives and their ability to truly increase diversity?
Sociologists Frank Dobbin and Alexandra Kalev (2016) analyzed three decades of data from more than 800 U.S. firms, and interviewed hundreds of managers and executives, to learn what works—and what doesn’t—when it comes to diversity programs. First, Dobbin and Kalev found that top-down approaches to diversity, including diversity training programs as well as tools like hiring tests and performance ratings, are generally not effective. They found that the positive effects of diversity training typically faded after just a few days and that some companies experienced adverse effects. Part of the problem, they found, is that companies often make these training programs mandatory, evoking anger and resistance from participants. Companies saw much better results when they made the training voluntary. Companies that instituted voluntary diversity training programs saw increases of 9 to 13 percent in women and in Black, Hispanic, and Asian men in management positions after five years (Dobbin and Kalev 2016).
But the most effective diversity programs, Dobbin and Kalev found, are not the ones that come from above but rather those that engage managers in solving the problem, increase managers’ contact with female and minority workers, and promote social accountability. These programs include mentoring and college recruitment programs. For example, five years after implementing a college recruitment program targeting women, companies saw their share of white, Black, Hispanic, and Asian women in management increase by an average of 10 percent. Diversity task forces and diversity managers were also found to be successful, namely by increasing social accountability. When managers knew their hiring decisions were going to be reviewed by a diversity manager, they were more likely to consider all qualified applicants (Dobbin and Kalev 2016). A growing number of organizations, from the Veterans Administration to Fortune 500 companies and community colleges, have established new internal offices or centers whose sole directive is infusing diversity, equity, and cultural competency into the workplace culture, policies, and environment.
Of course, there may be some backlash to such organizational changes. A recent study found that high-status groups such as white men interpret pro-diversity messages as unfair and as threatening to their status position. The experiment found that when an organization mentioned being pro-diversity, white male applicants were more likely to express concerns over discrimination and overall performed less well than white men applying to a company that didn’t mention diversity (Dover, Major, and Kaiser 2016). There may be those individuals who argue that promoting workplace diversity is neither necessary nor a worthwhile use of resources. Everyone has an equal chance of making it to the top, they say. The debate over whether historically disadvantaged groups should receive any kind of special attention has been with us for decades and will continue for as long as inequality persists in our society.
In the wake of the murder of George Floyd in May 2020 and the Black Lives Matter protests that followed, many organizations redoubled their efforts and began implementing antiracist training alongside diversity training. But this was not without controversy. President Trump instituted a short-lived ban on any such training in federal agencies, citing it as “divisive” and “un-American.” Still, the demand for antiracism training has continued to grow. Just think about it this way: If you were the head of an organization, wouldn’t you want to make sure that you were doing everything you could to create a diverse, inclusive, and equitable workplace? And that you weren’t overlooking the skills and talents of potential employees for baseless reasons like their gender, race, or sexual orientation?
More information
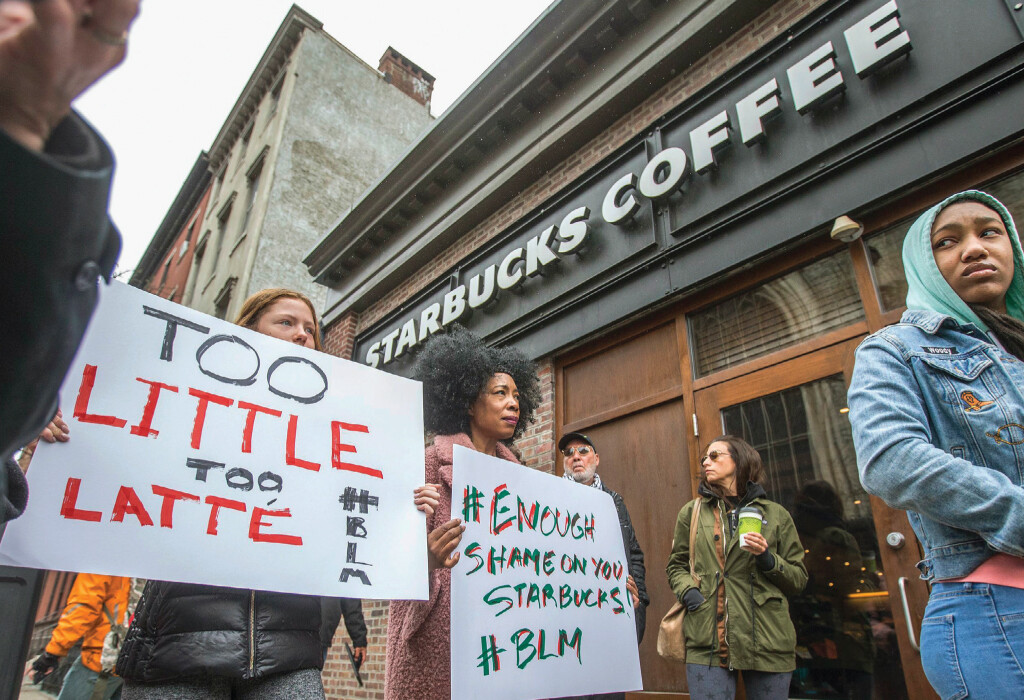
One poster says, “Too Little too Latté. Hashtag BLM.” The other poster has the following message, “Hashtag Enough. Shame on you, Starbucks. Hashtag BLM.”
Diversity Training After a Philadelphia Starbucks employee called the police on two Black men merely for sitting in the coffee shop, the company closed all U.S. stores for a day of diversity training.
Criminal Justice
Although the majority of the U.S. population is white—about 60 percent, as opposed to about 13 percent Black and 19 percent Hispanic—we don’t find these same proportions in the prison population. Of all prisoners in 2021, 32 percent were Black, while 31 percent were white and 24 percent were Hispanic (Carson 2022). In fact, Black men are imprisoned at a rate that is five and half times that of white men. Why are larger proportions of Black and Hispanic Americans in prison?
One explanation is the practice of racial profiling in policing, which we discussed in the chapter opener. Data on pedestrian and motor vehicle stops show that Black and Hispanic Americans are 127 percent more likely than whites to be stopped and 43 percent more likely to be frisked. Despite this unequal policing, Black and Hispanic Americans are 42 percent and 32 percent less likely to be in possession of a weapon or drugs than are whites (American Civil Liberties Union 2008). While not justified statistically, these higher stop and search rates increase the likelihood that Black and Hispanic drivers and pedestrians will be placed into contact with the criminal justice system. Other factors to consider are higher unemployment rates among minority groups, as well as higher dropout rates; in other words, a lack of both education and job opportunities may contribute to higher incarceration rates.
Some laws that don’t seem race based still create racially differentiated outcomes. For example, federal law until 2010 handed out far tougher sentences to crack cocaine users (who were more likely to be Black) than to users of powder cocaine (who were more likely to be white or Hispanic). If you possessed a small amount of crack cocaine, say 5 grams (for personal use), you’d get the same mandatory ten-year sentence that you would receive if you possessed a huge amount of powder cocaine, like 500 grams (enough for hundreds of uses). This disparity was rooted in the misperception of crack as a far more dangerous or damaging substance, when in fact it is actually quite similar to powder cocaine.
During the 1980s and 1990s crack cocaine use soared, in part because of its lower price point. Black communities suffered disproportionately from what was called the “crack epidemic.” In 2010, 79 percent of the federally sentenced crack offenders were Black, despite research indicating that two-thirds of crack users were white or Hispanic. The Fair Sentencing Act of 2010 reduced the sentencing disparity from a ratio of 100:1 to 18:1. While this judicial reform was a step toward greater fairness, it still means that sentencing for crack cocaine is eighteen times harsher than for powder cocaine. Another issue is that the law does not apply retroactively to those offenders who were already sentenced before its passage. Furthermore, the Fair Sentencing Act applies only to federal offenders, leaving a much larger number of nonviolent drug offenders to face far stiffer penalties at the state and local levels.
TABLE 8.2Federal Cocaine Offenders by Race/Ethnicity, 2012
Powder
Crack
All Drug Types
Race/Ethnicity
Percent
Percent
Percent
White
12.6
4.2
21.8
Black
32.3
88.1
38.8
Hispanic
54.2
7.1
37.2
Asian
0.5
0.3
1.5
SOURCE: Bureau of Justice Statistics 2015a.
African Americans are also more likely to be victims of homicide: In 2021, 53 percent of murder victims nationwide were Black, although Black people represented only 13 percent of the population (Federal Bureau of Investigation 2023b). This high rate of victimization does not have one simple cause, rather it involves the interplay of many variables, including higher rates of poverty, which can lead to other contributing factors such as unsafe living conditions, volatile interpersonal relationships, and increased contact with police.
Intersectionality
As you might have already concluded, race and ethnicity do not shape our life chances in isolation from other social statuses and aspects of identity. Instead, race and ethnicity are frequently enmeshed with social class, gender, sexuality, and more. Sociologist Shannon Malone Gonzalez (2022) demonstrates this in her interview study of Black mothers and the advice they give to their children about the risks of interacting with law enforcement officers. In the chapter opener, we learned that when Black parents have “the talk” with their kids, it’s not just about sex; it’s also about preparing their children, specifically Black boys, for encounters with the police. But Black girls are also at risk when it comes to interactions with the police, and these risks—such as the risk of sexual violence—are gender specific. Through 30 in-depth interviews, Malone Gonzalez found that perceptions about such risks, and attempts to mitigate them, are based in class as well as in race and gender. In other words, Black mothers give different versions of the talk to daughters than they do to sons, and middle-class Black moms give different versions of the talk than do working-class Black moms. Race intersects with gender and class to shape how parents and children respond to the prospects of police profiling and violence.
Middle-class Black mothers tend to focus on “respectability norms” in their version of the talk, urging their daughters to dress, look, and act like “ladies.” In this case, the girls themselves are largely responsible for the outcomes of their interactions with the police—that if, in the words of one mom, they stay “in the right spaces, the right places, and with the right people” (p. 32), they can prevent officers from sexually harassing or assaulting them. In contrast, working-class Black mothers tended to adopt a “predatory” narrative in their version of the talk, assuming that police officers will attempt sexual abuse no matter what their child wears, where she is, or with whom she hangs out. If their daughters are pulled over, these moms urge them to do so only in a well-lit, populated area, to get names and badge numbers, and to call someone on speakerphone to serve as a “witness” should the encounter devolve into something abusive. Malone Gonzalez’s research shows the importance of an intersectional approach to the social world, recognizing how race, gender, and class combine to shape our lived experiences.
More information
They are Devi, played by Maitreyi Ramakrishnan; Fabiola, played by Lee Rodriguez; and Eleanor, played by Ramona Young. A classmate has approached them, and the girls are looking up at him.
More information
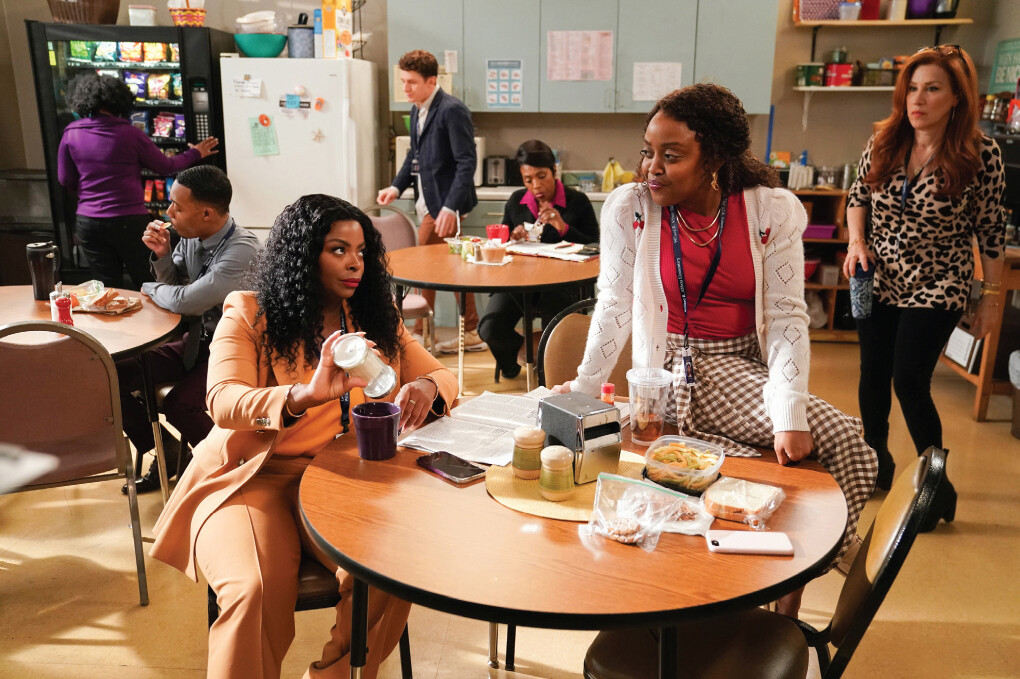
They are Janine (played by Quinta Brunson) and Ava (played by Janelle James). Janine sits on the table while Ava looks up at her disapprovingly and pours sugar into her coffee. Other coworkers eat their lunches at other tables in the background.
Diversity on TVNever Have I Ever (left) and Abbott Elementary (right) are two shows with predominantly nonwhite casts. Despite the success of these shows, minorities still remain underrepresented, particularly behind the camera as writers and directors.
DATA WORKSHOP
Analyzing Media and Pop Culture
Does TV Reflect the Realities of Race?
Maybe you’ve noticed a change recently in the TV landscape. In the past several years, we’ve seen an increase in the number of TV shows that include diverse casts from a range of different racial and ethnic backgrounds. Shows like Abbott Elementary, Never Have I Ever, and Reservation Dogs revolve around main characters who are Black, South Asian, and Indigenous. And they’re not alone. It wasn’t so long ago that TV was largely populated by white characters, with only the occasional minority sidekick. Today it is much easier to find shows that feature multiracial casts and in which race is a central theme.
In the 2020–2021 season, almost 40 percent of lead roles in scripted cable TV shows were held by minority actors; this is almost proportional to the number of minorities (43 percent) in the population overall (Hunt and Ramón 2022). While such gains are encouraging, they don’t tell the whole story: White men still dominate across all the highest-level positions in TV, including CEOs and show creators. Notably, these are the people with the most power to nurture talent and decide which programs to fund and promote.
One reason we may be seeing more minorities on TV is simply a matter of the bottom line: America’s increasingly diverse audiences prefer more diverse TV content. Additionally, as more minorities move into positions of power in the creative process, more TV shows are now taking on race in incisive, courageous, and nuanced ways. Audiences are seeing a broader range of character portrayals, as well as situations and settings that more closely reflect the lived experiences of minorities. Seeing oneself represented in the media is critically important to feeling included in a multicultural society. Greater representation can also serve to challenge stereotypes and break down preconceived ideas about the members of minority groups. But that’s not to say that TV is completely realistic when it comes to race. We are only getting a selective slice of the real world when we watch TV, and often that content can still be narrow, superficial, exaggerated, or just plain unrealistic.
For this Data Workshop, you’ll be watching TV and analyzing how it reflects the realities of race and ethnicity in contemporary society. Choose a TV series (drama, comedy, or reality show) that takes place in current times and includes minority characters. You might consider those already mentioned or one of the following:
Atlanta
Brooklyn Nine-Nine
The Chair
Dear White People
Empire
The Good Place
The Gordita Chronicles
Grey’s Anatomy
Grown-ish
Insecure
Jane the Virgin
Kim’s Convenience
Kung Fu
Nora from Queens
On My Block
One Day at a Time
Orange Is the New Black
Power
Queen Sugar
Ramy
Sex Education
Superstore
You will be using existing sources as a research method and doing a content analysis of one episode of the TV series you chose. Refer to Chapter 2 for a review of this research method. Watch a recent episode of your chosen series in its entirety. You will want to record the program or look for an episode that you can stream so that you can review certain scenes, interactions, or bits of dialogue several times. Take notes as you watch, paying special attention to the episode’s content as it relates to race and ethnicity. Your notes can be informal but should be specific and detailed. Your notes will serve as the data set you’ll be analyzing.
Consider your response to the following prompts or add your own questions for analysis:
Look up your series on IMDb or Wikipedia to learn more about its creators. Who is in control of production, direction, or writing, and how might that affect the show’s content?
Is race an explicit theme of the show, and if so, how is it addressed? Or are matters of race more implicit or in the background?
How many minority characters are featured in the episode? What proportion of the total cast do they represent?
In what ways are minority characters portrayed? (You may choose to focus on one or two characters.) Do the characters uphold certain racial or ethnic stereotypes or challenge them?
Describe instances in which characters display aspects of situational or symbolic ethnicity.
How does the race or ethnicity of characters intersect with other social statuses or identities such as class, gender, or sexuality?
To what extent do you think the show reflects the “real world”? Use the information in the “Race, Ethnicity, and Life Chances” section for reference.
In what ways might the show help maintain or perpetuate prejudice and discrimination? In what ways might the show help counteract it?
What kind of an impact did the episode have on you as a viewer? How might it shape the perceptions of other audience members with regard to race or ethnicity?
There are two options for completing this Data Workshop:
PREP-PAIR-SHARE
Bring your informal notes to class and be ready to discuss your preliminary analysis of the show. Form a small group with one or more classmates, and take turns talking about your responses to the prompts. Discuss your own findings, and listen to how others in the group analyzed their shows. What kinds of similarities or differences did you find in your respective analyses? Were there any common themes that emerged across everyone’s chosen shows?
DO-IT-YOURSELF
Take notes while you watch an episode of your chosen TV show. Write a three- to four-page paper discussing your content analysis and responses to the prompts provided. Make sure to incorporate and explain the relevant sociological concepts about race and ethnicity in your discussion. Attach your informal notes as an appendix to your paper.