Just 15% of Americans Smoke
Seventy-four Percent of the World Smiled Yesterday
Forty-one Percent of Children Worldwide Experience Moderate Food Insecurity
Most Students Don’t Know When News Is Fake
A claim is an argument someone is trying to make. Internet bloggers might make claims based on personal experience or observation (“The media coverage of congressional candidates has been sexist”). Politicians might make claims based on rhetoric (“I am the candidate of change!”). Literature scholars make claims based on textual evidence (“Based on my reading of the text, I argue that the novel Frankenstein reflects a fear of technology”). In this textbook, we focus on claims made by researchers and journalists. Researchers make claims about theories based on data. Journalists make claims when they report on studies they read in empirical journals. Recall from Chapters 1 and 2 that psychologists use systematic observations, or data, to test and refine theories and claims. A psychologist might claim, based on data they have collected, that a certain percentage of teens attempted suicide last year, or that people who exercise earn more money, or that pretending to be a superhero helps kids stay on task.
Notice the different wording in the headlines in Table 3.3. In particular, the first statement merely gives a percentage of teens who texted while driving; this and the others in the first row are frequency claims. The claims in the middle are association claims: For example, one of them suggests that two variables, speech delays and mobile devices, go together, but it does not claim that speech delays cause screen time or that screen time causes speech delays. The claims in the last section of the table, however, are causal claims. For example, the verb help indicates that pretending to be Batman actually causes children to be more persistent. The kind of claim a psychological scientist makes must be backed up by the right kind of study. How can you identify the types of claims researchers make, and how can you evaluate whether their studies can support each type of claim? If you conduct research yourself, how will you know what kind of study will support the type of claim you wish to make?
Examples of Each Type of Claim
|
Claim type |
Sample headlines |
|
Frequency claims |
Thirty-nine Percent of Teens Admit to Texting While Driving In the U.S., 71% Support Transgender People Serving in the Military Screen Time for Kids Under 2 More Than Doubles, Study Finds Most Students Don’t Know When News Is Fake |
|
Association claims |
Speech Delays Could Be Linked to Mobile Devices Girls More Likely to Be Compulsive Texters Suffering a Concussion Could Triple the Risk of Suicide Countries with More Butter Have Happier Citizens |
|
Causal claims |
Mothers’ Friendships Are Good for Babies’ Brains Family Meals Curb Eating Disorders To Appear More Intimidating, Just Tilt Your Head Down Pretending to Be Batman Helps Kids Stay on Task |
Just 15% of Americans Smoke
Seventy-four Percent of the World Smiled Yesterday
Forty-one Percent of Children Worldwide Experience Moderate Food Insecurity
Most Students Don’t Know When News Is Fake
Frequency claims describe a particular rate or degree of a single variable. In the last example above, “most” refers to a proportion of students (presumably higher than 50%) who could not identify fake news. In the first example, “15%” is the proportion of American adults who smoke. These headlines claim how frequent or common something is. Claims that mention the percentage of a variable, the number of people who engage in some activity, or a certain group’s level on a variable can all be called frequency claims.
Frequency claims are easily identified because they focus on only one variable—such as level of food insecurity, rate of smiling, or amount of texting. In addition, in studies that support frequency claims, the variables are always measured, not manipulated. For example, the researchers measured children’s food insecurity by using a questionnaire or an interview and reported the results.
Some reports give a list of single-variable results, all of which count as frequency claims. Take, for example, the recent report from Gallup stating that 74% of the world smiled yesterday (Gallup.com, 2019). The same report also found that 49% of people said they learned something interesting yesterday. These are two separate frequency claims—they each measured a single variable one at a time. The researchers were not trying to show an association between these single variables, and the report did not claim that the people who learned something interesting were more likely to smile. It simply stated that a certain percentage of the world’s people smiled and a certain percentage learned something interesting.
Study Links Coffee Consumption to Lower Depression in Women
New Study Links Exercise to Higher Pay
Another Study Points to Connection Between 13 Reasons Why and Increased Youth Suicide
A Late Dinner Is Not Linked to Childhood Obesity, Study Shows
These headlines are all examples of association claims. An association claim argues that one level of a variable is likely to be associated with a particular level of another variable. Variables that are associated are sometimes said to correlate, or covary, meaning that when one variable changes, the other variable tends to change, too. More simply, they may be said to be related.
❯❯
For more on correlation patterns, see Chapter 8.
Notice that there are two variables in each example above. In the first, the variables are amount of coffee consumption and level of depression: Higher coffee consumption is associated with lower levels of depression (and therefore lower coffee consumption goes with higher levels of depression). In the second example, the variables are the amount of exercise and the income level: More frequent exercise goes with higher levels of income.
An association claim states a relationship between at least two variables. To support an association claim, the researcher usually measures the two variables and determines whether they’re associated. This type of study, in which the variables are measured and the relationship between them is tested, is called a correlational study. Therefore, when you read an association claim, you will usually find a correlational study supporting it.
The headline “New study links exercise to higher pay” is an association in which high goes with high and low goes with low; it’s called a positive association, or positive correlation. Stated another way, high rates of exercise go with higher levels of pay, and low rates of exercise go with lower levels of pay.
One way to represent an association is to use a scatterplot, a graph in which one variable is plotted on the y-axis and the other variable is plotted on the x-axis. Each dot represents one participant in the study, measured on the two variables. Figure 3.3 shows what scatterplots of the associations in three of the example headlines would look like. (Data are fabricated for illustration purposes, and numbers are arbitrary units.) Notice that the dots in Figure 3.3A form a cloud of points, as opposed to a straight line. If you drew a straight line through the center of the cloud of points, however, the line would incline upward; in other words, the mathematical slope of the line would be positive.
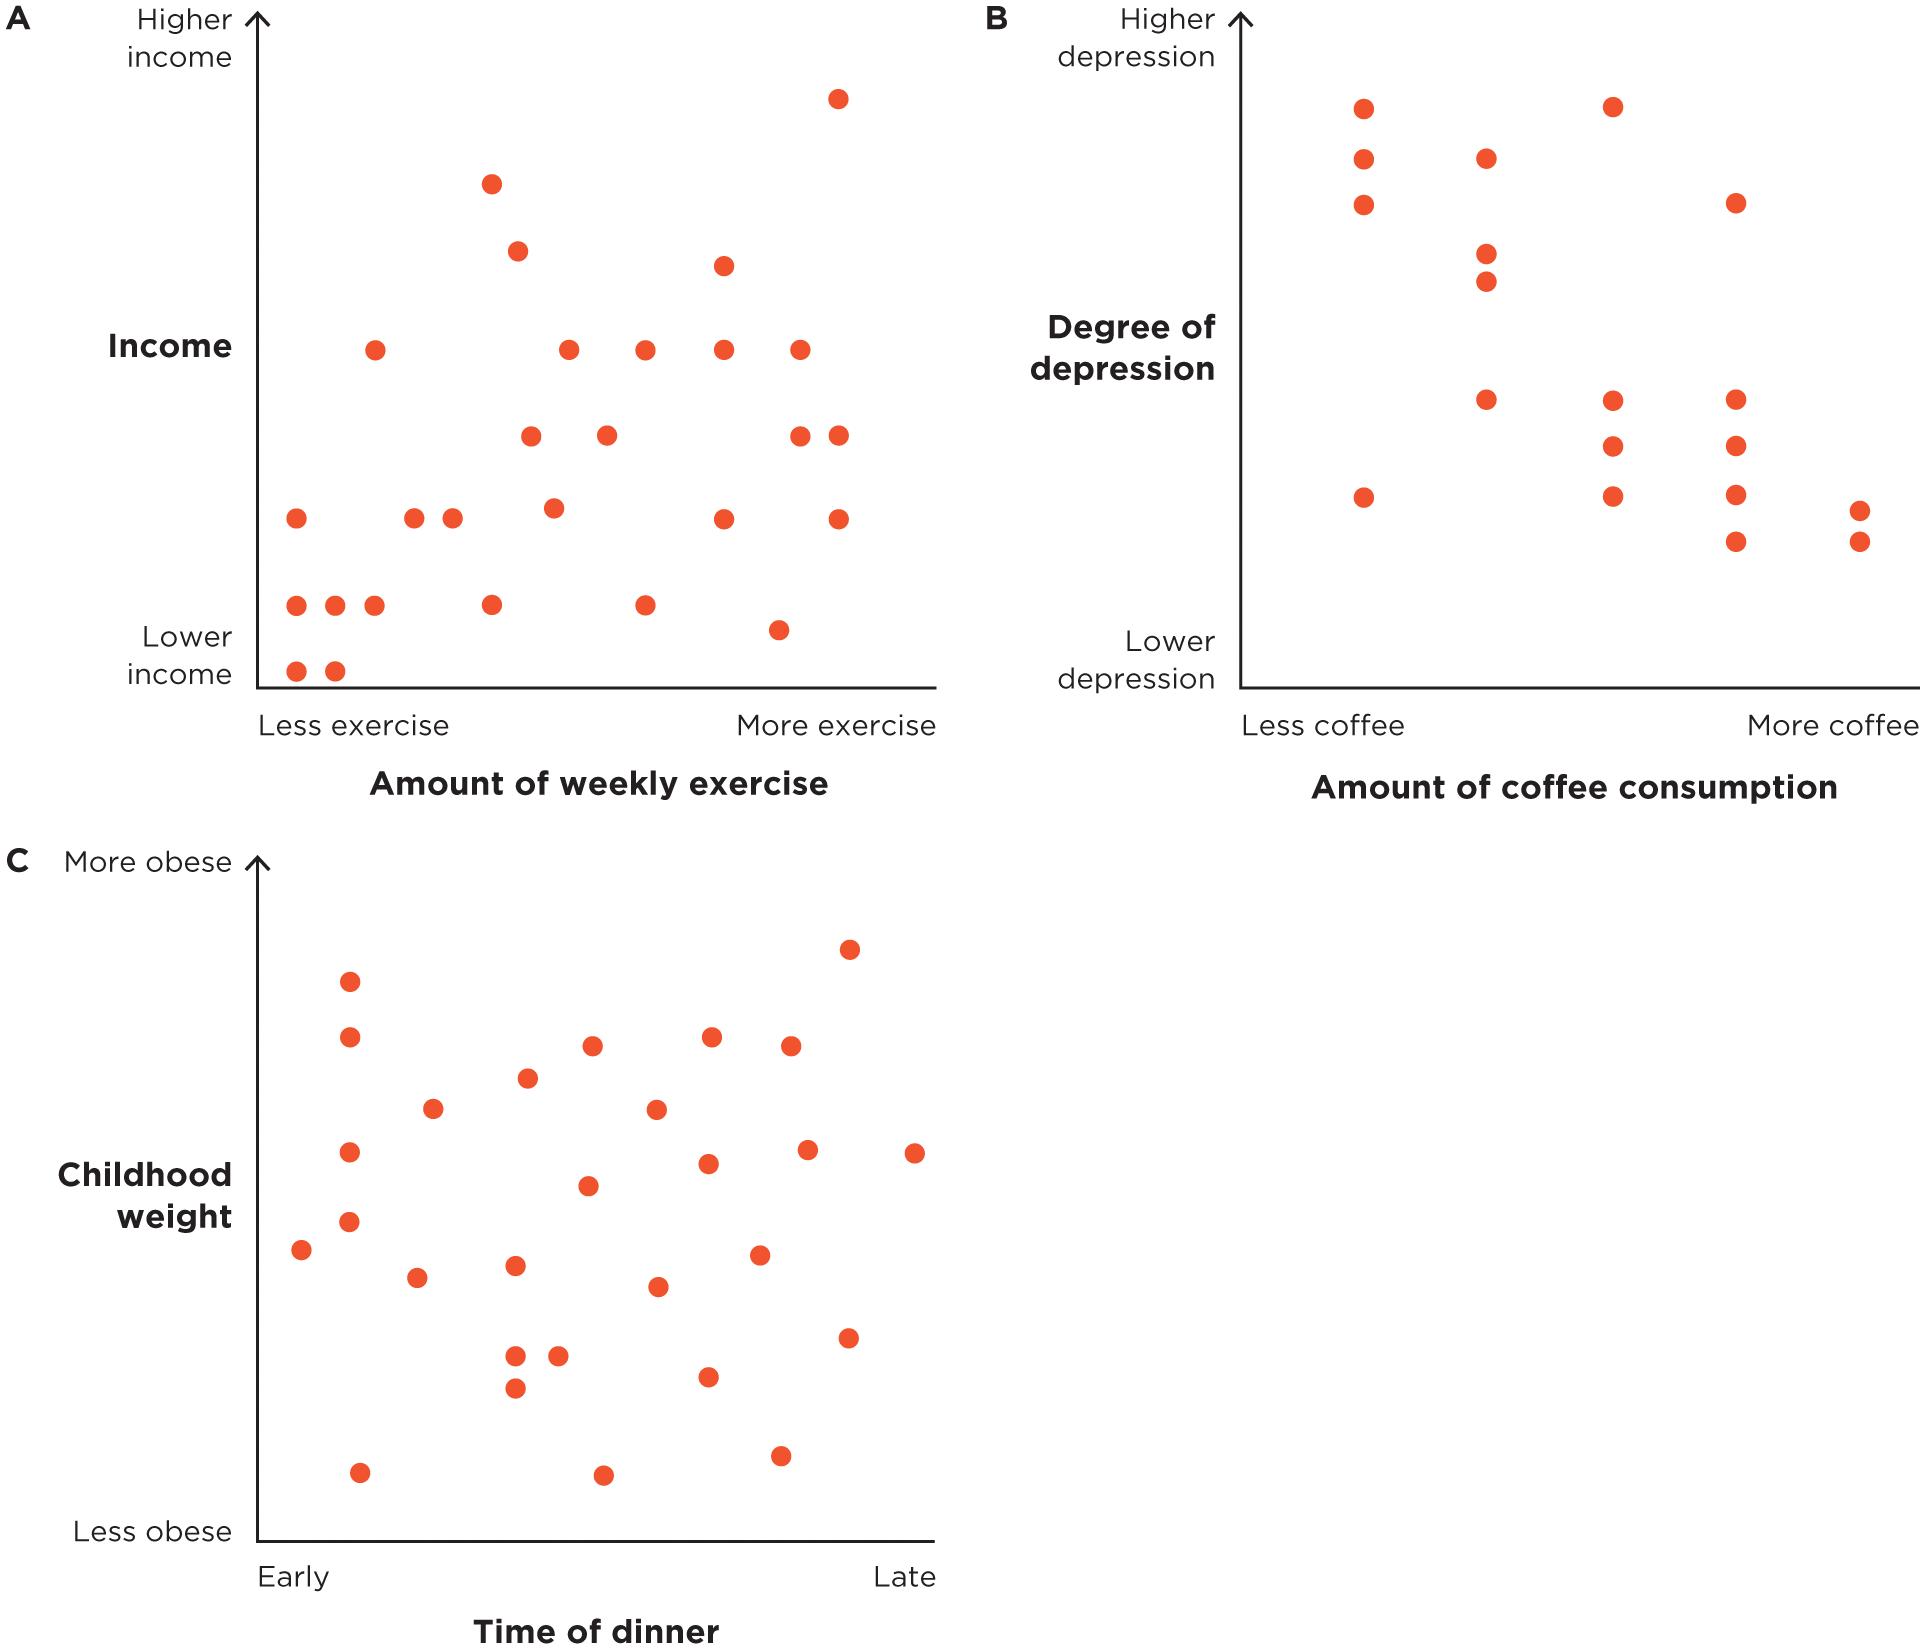
Figure 3.3
Scatterplots showing three types of associations.
(A) Positive association: “New study links exercise to higher pay.” (B) Negative association: “Study links coffee consumption to lower depression in women.” (C) Zero association: “A late dinner is not linked to childhood obesity, study shows.”
The study behind the claim “Coffee drinking linked to less depression in women” obtained a negative association. In a negative association (or negative correlation), high goes with low and low goes with high. In other words, high rates of coffee go with less depression, and low rates of coffee go with more depression.
A scatterplot representing this association would look something like the one in Figure 3.3B. Each dot represents a person who has been measured on two variables. However, in this example, a line drawn through the cloud of points would slope downward; it would have a negative slope.
In this example, the reverse of the association—that people who drink less coffee are the most depressed—is another way to phrase this negative association. Keep in mind that the word negative refers only to the slope; it does not mean the association is somehow bad. To avoid this kind of confusion, some people prefer the term inverse association.
The study behind the headline “A late dinner is not linked to childhood obesity, study shows” is an example of a zero association, or no association between the variables (zero correlation). In a scatterplot, both early and late levels of dinnertime are associated with all levels of obesity (Figure 3.3C). This cloud of points has no slope—or more specifically, a line drawn through it would be nearly horizontal, and a horizontal line has a slope of zero.
Some association claims are useful because they help us make predictions. How much pay does this group of people get? How much coffee does that person drink? With a positive or negative association, if we know the level of one variable, we can more accurately guess, or predict, the level of the other variable. Note that the word predict, as used here, does not necessarily mean predicting into the future. It means predicting in a mathematical sense—using the association to make our estimates more accurate.
To return to the headlines, according to the positive association described in the first example, if we know how much exercise a person gets, we can predict their salary. According to the negative association in the second example, if we know a woman drinks a lot of coffee, we can predict her level of depression. Are these predictions going to be perfect? No—they will usually be off by a certain margin. The stronger the relationship between the two variables, the more accurate our prediction will be. The weaker the relationship between the two variables, the less accurate our prediction will be. But if two variables are even somewhat correlated, it helps us make better predictions than if we didn’t know about this association.
Both positive and negative associations can help us make predictions, but zero associations cannot. If we wanted to predict whether or not a child will be obese, we could not do so just by knowing what time they eat dinner because these two variables are not correlated. With a zero correlation, we cannot predict the level of one variable from the level of the other.
Pretending to Be Batman Helps Kids Stay on Task
To Appear More Intimidating, Just Tilt Your Head Down, Study Suggests
Unbelievable News? Read It Again and You Might Think It’s True
Family Meals Curb Teen Eating Disorders
Whereas an association claim merely notes a relationship between two variables, a causal claim goes even further, arguing that one of the variables is responsible for changing the other. Note that each of the causal claims above has two variables, just like association claims: pretending to be Batman and staying on task, intimidating (versus nonthreatening) appearance and head tilt, family meals and eating disorders.
In addition, like association claims, the causal claims above suggest that the two variables in question covary: Reading a story more than once goes with being more likely to believe that story. Eating family meals goes with lower rates of eating disorders. Kids who pretend to be Batman persist longer (than children who don’t), and tilting your head down goes with appearing intimidating. You might also see a causal claim based on a zero association that reports a lack of cause. For example, you might read that vaccines do not cause autism or that being in daycare does not cause behavior problems.
Causal claims, however, go beyond a simple association between the two variables. They use language suggesting that one variable causes the other—verbs such as cause, enhance, affect, decrease, and change. In contrast, association claims use verbs such as link, associate, correlate, predict, tie to, and be at risk for. In Table 3.4, notice the difference between these types of verbs and verb phrases. Causal verbs tend to be more exciting. They are active and forceful, suggesting that one variable comes first in time and acts on the other variable. It’s not surprising, then, that journalists may be tempted to describe family dinners as curbing eating disorders, for example, because it makes a better story than family meals just being associated with eating disorders.
Verb Phrases That Distinguish Association and Causal Claims
|
Association claim verbs |
Causal claim verbs |
|
|
is linked to |
causes |
promotes |
|
is at higher risk for |
affects |
reduces |
|
is associated with |
may curb |
prevents |
|
is correlated with |
exacerbates |
distracts |
|
prefers |
changes |
fights |
|
is more/less likely to |
may lead to |
worsens |
|
may predict |
makes |
increases |
|
is tied to |
sometimes makes |
trims |
|
goes with |
hurts |
adds |
Here’s another important point: A causal claim may contain tentative language—could, may, seem, suggest, sometimes, potentially. If a headline read “Music lessons may enhance IQ,” it would be more tentative, but would still be still considered a causal claim. The verb enhance makes it a causal claim, regardless of any softening or qualifying language.
Advice is also a causal claim; it implies that if you do X, then Y will happen. For example: “Best way to deal with jerks? Give them the cold shoulder.” “Boost your salary by hitting the gym.”
Causal claims are a step above association claims. Because they make a stronger statement, we need to hold them to higher standards. To move from the simple language of association to the language of causality, a study has to satisfy three criteria. First, it must establish that the two variables (the causal variable and the outcome variable) are correlated; the relationship cannot be zero. Second, it must show that the causal variable came first and the outcome variable came later. Third, it must establish that no other explanations exist for the relationship. Therefore, when we encounter a causal claim, we must be sure the study can support it. Later in this chapter, you will learn that only one type of study, an experiment, enables researchers to support a causal claim because it meets all three criteria.
Besides the types of claims mentioned above, you may also encounter stories in the popular media that are not based on research, even if they are related to psychology. For instance:
The Forgotten Mothers and Babies of Zika
A Woman Living with Chronic Pain Describes How It Makes Her Seem “Uninterested”
Guys Reveal How They Found Their Therapists
These kinds of headlines, while interesting, are not frequency, association, or causal claims, in which a writer summarizes the results of a poll, survey, or other research study. Anecdotes and interviews are about people’s personal experiences. Such headlines describe a person’s experience with a health problem, raise awareness of rare diseases, or share mental health resources. But they don’t say anything about the frequency of a problem or how it might be solved using research-based evidence.

1. See pp. 61–62 and 65–66. 2. The verbs matter; see pp. 65–66 and Table 3.4. 3. See pp. 65–66. 4. See p. 65.