Learning Goal
Explain correlational methods and two reasons they cannot necessarily show that one factor causes changes in the other factor.
Learning Goal
Explain correlational methods and two reasons they cannot necessarily show that one factor causes changes in the other factor.
Suppose you have conducted your study to describe what students believe is the best study technique. Now assume you want to take this research a step farther. Recall that you could do this by investigating the question What is the relationship between how much time students spend using certain study methods and their later exam scores? (See Figure 1.18, blue box.) To examine a naturally occurring relationship between two factors without attempting to alter them, researchers use correlational methods. We describe correlational methods here. You can also learn more about the data obtained from these methods, including the various types of correlations, in Appendix A.
In correlational methods (Figure 1.23), you measure two or more naturally occurring variables and then determine the strength of the relationship between them. You can use various methods to collect the data, including observational and self-report methods. If there is a relationship, then knowing one variable can help you predict what might happen with the other variable. For example, research has shown a relationship between the amount of time people spend on social networking sites, such as Facebook, and experiencing feelings of depression (Yoon et al., 2019). In this case, because people who spend more time on Facebook tend to have more feelings of depression, these two variables are correlated. In other words, people who tend to score higher on one variable (spending time on Facebook) also tend to score higher on the other variable (feeling more depressed). The variables would also be correlated if the values decrease in one variable as the values increase in the other variable—for example, if people who spend more time with others are less likely to experience feelings of depression. A correlation simply tells you whether two variables are related. (See Appendix A, Figure A.4, for graphs of various correlations.)
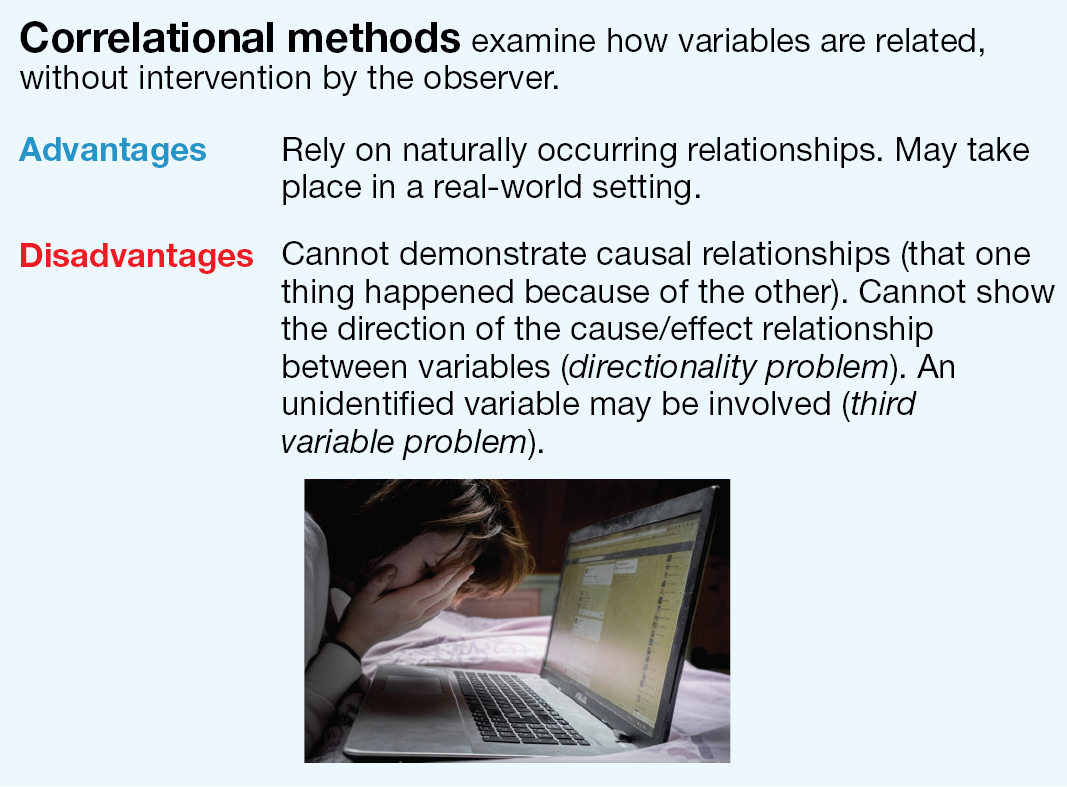
A text at the top reads, Correlational methods examine how variables are related, without intervention by the observer. Advantages - Rely on naturally occurring relationships. May take place in a real-world setting. Disadvantages - Cannot demonstrate causal relationships (that one thing happened because of the other). Cannot show the direction of the cause and effect relationship between variables (directionality problem). An unidentified variable may be involved (third variable problem). An image below shows a woman sitting in front of a laptop and covering her face with her hands in confusion.
FIGURE 1.23 Correlational Methods
Correlational methods can show whether two or more variables are related to each other. For example, a correlation seems to exist between spending more time on Facebook and feeling more depressed. A correlational study can reveal the existence of a relationship between the two factors, but it cannot show the cause of this relationship.
Let’s return to your research study and investigate it with correlational methods. Recall that your goal is to answer the question Is there a relationship between how much time students spend using certain study methods and their performance on a later exam? You could do correlational research by using self-report data on how much time students spend using their preferred study method and then recording how well the students perform on a later exam on the material. These data will reveal whether the time that students spend using their preferred study technique, such as repeatedly reading the textbook or repeatedly practicing by answering questions on the material, is related to how well they did on the exam.
For example, you might find no relationship between how much time students spend repeatedly reading material and their later exam scores. This finding would reveal a lack of a correlation between those two factors. (See Appendix A, Figure A.4c, for a graph showing no correlation.) By contrast, you may find that when students spend more time repeatedly practicing with the material, they achieve higher exam scores later on. In this case there will be a correlation between repeated practice and exam performance. (See Appendix A, Figure A.4a, for a graph showing this correlation.) Based on the outcomes, you may predict that using a certain study technique, such as taking practice tests, will be associated with higher exam scores.
LEARNING TIP Problems Determining Causality in Correlational Methods
The directionality problem and the third variable problem are the two main reasons that correlational methods prevent researchers from being able to state that changes in one variable cause changes in another. Failure to consider these problems may lead to inaccurate conclusions. Here is a way to visualize these problems in correlational research that looked at relationships between time spent on Facebook and feelings of depression (Yoon et al., 2019).
The Directionality Problem
Time spent using Facebook (A) is correlated with feelings of depression (B).
However, it is not known which factor drives the other factor. (A ⟷ B)
or
The Third Variable Problem
Time spent using Facebook (A) is correlated with feelings of depression (B).
However, a third factor (C) may drive this relationship.
and
Correlation Is Not Causality It is so tempting to say that this research reveals that “repeated practice causes higher exam grades.” But the data from your correlational research do not show that using a certain study technique causes a certain level of performance on an exam. Why not? Two main problems prevent researchers from specifying a cause-and-effect relationship between factors, called causality, from studies that use correlational methods. The Learning Tip above summarizes both of these problems.
The first problem is that the direction of the relationship between variables is not known. The source of this ambiguity is the directionality problem. For example, correlational research shows that a relationship exists between the variables of the amount of time spent on Facebook and feelings of depression (Yoon et al., 2019), but what is the direction of the relationship? Does using Facebook cause feelings of depression? Or does feeling depressed cause people to spend more time using Facebook? As the Learning Tip shows, either one could be a cause and either one could be an effect. Because of the directionality problem, correlational methods can never tell you what causes a particular outcome.
The second drawback of correlational methods is the third variable problem. The Learning Tip explains why this problem prevents us from understanding what causes an outcome in the correlational research on Facebook and depression (Yoon et al., 2019). We know there is a relationship between the time spent on Facebook and feelings of depression. But what if a third variable—that is, a hidden factor—causes both greater use of Facebook and greater feelings of depression? For example, people who are insecure may feel anxious and have low opinions of themselves. You can easily imagine that such people may use Facebook more (for example, to compare their lives against the lives of others), and they may also experience more feelings of depression. In fact, researchers suggested that making more social comparisons may have been a factor (a third variable) in their findings. Why? People who made more social comparisons on Facebook that made them feel poorly about themselves also experienced greater feelings of depression. However, this is merely a suggestion that the researchers made. Their correlational study cannot and did not reveal causality. Instead, future research must directly investigate this theory.

The titles are as follows: Eating Pizza Cuts Cancer Risk; Diet of Fish Can Prevent Teen Violence; Does Your Neighborhood Cause Schizophrenia?; Housework Cuts Breast Cancer Risk.
FIGURE 1.24 The News Often Wrongly Reports Correlations as Causal Claims
When news outlets present results from correlational studies, the headlines and articles often wrongly suggest that one factor causes the other. In such cases, think critically and remember that just because two events are related to each other, you cannot know whether one causes the other.
Correlational research is everywhere in your life. Have you ever seen news headlines like those in Figure 1.24, which seem to make incredible claims? These headlines are “incredible” precisely because they are not credible. Unfortunately, many media reports of correlational studies wrongly suggest or state that one variable causes another. Failure to consider the directionality and third variable problems may lead people to wrong conclusions about relationships. If you use the three steps in critical thinking you learned in study unit 1.3 (see the Learning Tip on p. 11), you can avoid making such mistakes.
These sample news headlines may make it seem that you should simply disregard the results of correlational studies. Do not give in to that temptation. Researchers who conduct correlational studies use statistical procedures to rule out potential third variable and directionality problems. Once they have shown that a relationship between two variables holds even when they take potential third variables into account, they can be more confident that the relationship is meaningful. In addition, correlational studies provide important information about the natural relationships between variables. That information allows you to make predictions that can be extremely important to you or other people in your life. For example, correlational research has shown a strong relationship between depression and suicide. For this reason, clinical psychologists often assess symptoms of depression to determine suicide risk. Clearly, the data obtained from correlational research can be lifesaving for someone you love.
IMPACT LEARNING PAUSE
Are You Monitoring?
Have you met the learning goals for the chapter? Try monitoring to check your progress, and use these self-regulated learning activities in every chapter.
In sum: To truly understand the results of psychological research, it is important to know the difference between correlation and causation. If you want to know whether one factor causes a particular outcome, the only research methods you should use are experimental methods, which we describe in the next study unit.
LEARNING GOAL CHECK: REVIEW & APPLY