Learning Goal
Explain the two types of variables and two types of groups that are necessary in experimental methods.
Learning Goal
Explain the two types of variables and two types of groups that are necessary in experimental methods.
When researchers use correlational methods, they can uncover whether a relationship exists between variables. Those data will let researchers predict how these variables are related in the future. However, researchers do not control the situation and so cannot conclude that changes in one variable cause changes in the other. If researchers want to determine whether causality exists between variables or to explain why a phenomenon occurs, then they must use experimental methods. Experimental methods are summarized in Figure 1.25, and you can learn more about the data from these methods in Appendix A. Importantly, only experimental methods reveal causality—for example, the answer to the research question Which study technique results in the best exam scores possible? (See Figure 1.18, green box.)
![]() Correlation and Causation
Correlation and Causation
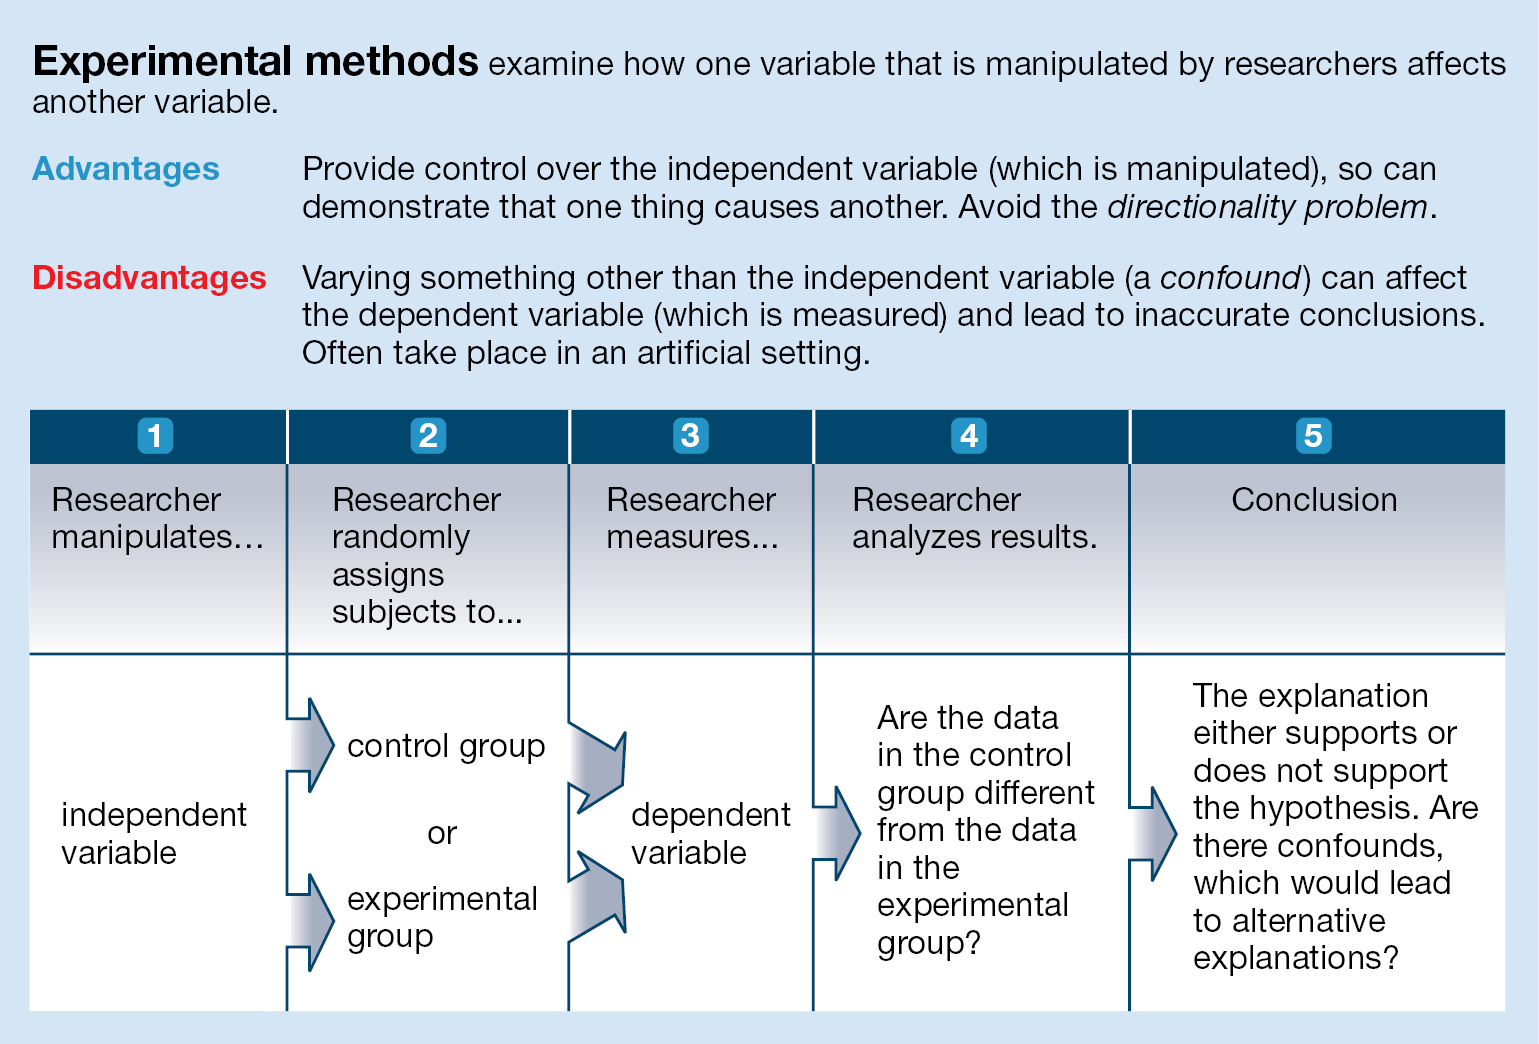
A text at the top reads, Experimental methods examine how one variable that is manipulated by researchers affects another variable. Advantages - Provide control over the independent variable (which is manipulated), so can demonstrate that one thing causes another. Avoid the directionality problem. Disadvantages - Varying something other than the independent variable (a confound) can affect the dependent variable (which is measured) and lead to inaccurate conclusions. Often take place in an artificial setting. Below this is a chart which explains the process in five boxes. Box 1 reads: Researcher manipulates the independent variable. Box 2 reads: Researcher randomly assigns subjects to a control group or experimental group. Box 3 reads: Researcher measures dependent variable. Box 4 reads: Researcher analyzes results. Are the data in the control group different from the data in the experimental group? Box 5 reads: Conclusion. The explanation either supports or does not support the hypothesis. Are there confounds, which would lead to alternative explanations?
FIGURE 1.25 Experimental Methods
Experimental methods provide information about causality between variables.
Variables in an Experiment To begin understanding experimental methods, let’s return once again to your research on whether specific study techniques directly affect learning and exam performance. Here you must use an experiment because an experiment allows you to control whether people are repeatedly reading the material or repeatedly practicing answering questions about the material before an exam on the material. Your hypothesis for this experiment might be the following statement: “Using repeated practice to study leads to better exam performance than does repeated reading.” How would you design an experiment to test this hypothesis?
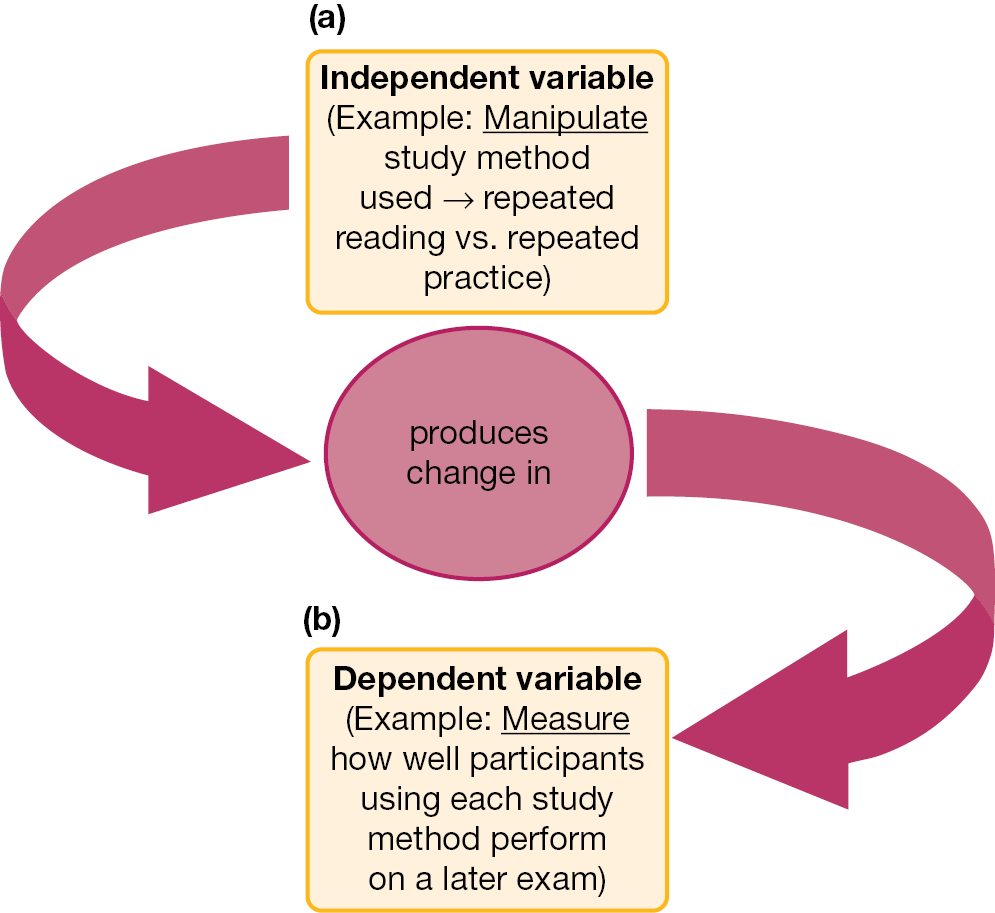
A flowchart depicting the relationship between independent and dependent variables. Box (a) is labeled Independent variable (Example: Manipulate study method used - repeated reading versus repeated practice), with an arrow leading to an oval labeled produces change in. Another arrow leads from the oval to box (b) labeled Dependent variable (Example: Measure how well participants using each study method perform on a later exam).
FIGURE 1.26 Independent and Dependent Variables in an Experiment
(a) The independent variable is manipulated and is under the experimenter’s control. In the example experiment, the independent variable is the study method used (repeated reading or repeated practice). (b) Changes in the independent variable may produce changes in the dependent variable, which is the outcome that is measured.
To perform an experiment that tests a hypothesis, the researcher manipulates the independent variable (Figure 1.26a on p. 38). In your experiment, the independent variable is the type of study technique used. You manipulate how your research participants use the two study techniques (for example, by rereading material twice versus taking two practice tests on the material). After manipulating the independent variable, you measure the effect of that variable on a second variable called the dependent variable (Figure 1.26b). In your experiment, the dependent variable is performance on an exam taken after performing one of the two types of studying. The Learning Tip on page 39 will help you remember the difference between independent variables and dependent variables.
Operational Definitions of Variables To ensure that your research is objective and systematic, you must define all of these variables as specifically as possible. In other words, you must create operational definitions of the variables. Operational definitions qualify (describe) and quantify (measure) variables so they can be understood objectively. For example, in the experiment you are conducting, how can you qualify what it means to study by rereading? That is, what does it mean to reread the text material in the study? How many times do participants reread the passage, and how much time will pass between each rereading? Is taking notes allowed? Is there some way to make sure the participants are paying attention and not falling asleep? In addition, how will you qualify what it means to study by using repeated practice? For example, how many practice questions are used? Are they multiple-choice questions or short-answer questions? How many times do participants practice? And how much time passes between each practice? Will the participants receive feedback on correctness or not? You must make all of these decisions before starting the research so you can be clear about how you are manipulating the independent variable.
Just as you need to create an operational definition of the independent variable, you also need to create an operational definition of the dependent variable. In your experiment, the dependent variable is exam performance. How will you qualify and/or quantify the nature of the exam and performance on it so you can judge whether the study technique affects it? For example, what types of questions are on the exam—multiple choice, short answer, or another type? How do you learn about the participants’ performance on the exam? Do you rely on people’s self-reports of how well they think they did? That would be a very subjective (personal) way to operationally define the dependent variable. A more objective option might be to measure the percentage of questions that participants got correct on the exam. In this case, the operational definition of exam performance is percentage correct. Often a single dependent variable can have many operational definitions. Thus, you could include an operational definition of students’ perceptions of the difficulty of the exam or their own success on it as another dependent variable to complement the operational definition of percentage correct.
As mentioned earlier, it is good scientific practice for researchers to preregister their hypotheses and methods, including the operational definitions of their variables, before they start the research. Doing so ensures that the experiment is designed to test the hypothesis originally proposed, and it prevents them from engaging in the bad practice of creating another hypothesis after the results are known. Preregistration also informs other researchers exactly how you measured your variables. When other researchers know your methods, they can use identical methods to gather data that attempt to replicate your results or extend them to new situations or diverse participants.
LEARNING TIP Understanding the Differences Between Dependent and Independent Variables
|
When you see |
Please think |
Meaning |
|
Independent variable |
In the control of the experimenter |
The experimenter manipulates what the participant sees, experiences, is exposed to, and so on. |
|
Dependent variable |
Depends on what the participant does |
The experimenter measures what the participant does. |
Groups in an Experiment You now know that your experiment will test the hypothesis that the dependent variable (exam performance, as measured by the percentage correct on the exam) is affected by the independent variable (two specific study methods are repeated rereading and taking practice tests). But how will you know if the scores seen in the dependent variable are really caused by your manipulation of the independent variable?
To determine whether causality exists between the independent and dependent variables, you must assign some participants in the experiment to a control group (Figure 1.27a). This group of participants receives a manipulation that you will compare against the treatment of interest. In this case, you will ask participants assigned to the control group to read a passage one time, then reread the passage two more times before taking the exam on it. This is the baseline. The participants in the experimental group experience the manipulation you are interested in, which is the treatment in the experiment (Figure 1.27b). In your experiment, because you have learned about research suggesting that repeated practice helps learning, you will ask the participants in the experimental group to read a passage one time and then take two practice tests on the material before taking an exam on it. You will then compare the effects of repeated reading in the control group with the effects of repeated practice in the experimental group.


FIGURE 1.27 Control and Experimental Groups in the Example Experiment
(a) The control group includes participants who experience a baseline manipulation that allows comparison with the experimental group. In the example experiment, the control group rereads material twice after an initial reading of it. (b) The experimental group includes participants who experience a manipulation of the treatment of interest. In this case, the experimental group takes two practice tests on the material after an initial reading of it.
In the experiment described so far, different people have been in the control and experimental groups. This type of experiment has a between-groups design because different groups receive different treatments. However, in some experiments, participants serve as their own control group. In a within-subject design, the same people receive all treatments but perhaps in different orders. For example, half of the participants would study one passage by rereading it twice and then taking an exam on the material. Then they would study a new passage by taking two practice tests before taking an exam on the material. Meanwhile, the other half of the participants experience the opposite order of treatments, first studying by taking two practice tests and then taking the exam, followed by rereading a passage twice and then taking the exam. This experimental design rules out any effects of the order of conditions because participants are likely to pay more attention to the first passage and to be more tired by the second passage. In both between-groups and within-subject designs the goal is to determine whether the different treatments experienced in the independent variables cause the differences in performance on the dependent variables.
Recall that using an experimental method allows the researcher to study causality between the two variables. Suppose the independent variable (study method) consistently influences the dependent variable (exam performance). The independent variable is then assumed to cause the change in the dependent variable. The experimenter always manipulates the independent variable and then measures the dependent variable. That is, manipulation of the independent variable (here, study method) comes before the dependent measure (here, exam performance) is recorded. In this way, the experimenter solves the directionality problem that occurs in a correlational study. In the next subsection, you will learn how experiments make it possible to rule out alternative explanations, such as third variables.
Control Is Necessary to Determine Causality Only experimental methods allow researchers to achieve the scientific goals of control and explanation. Indeed, a properly performed experiment depends on rigorous control. Here, control means the steps taken by the researcher to minimize the possibility that anything other than the independent variable will affect the experiment’s outcome. That is, when conducting an experiment, a researcher needs to ensure that the only thing that varies is the independent variable. That way, the researcher knows that the independent variable—and nothing else—has affected the dependent variable. Anything that affects a dependent variable and that may unintentionally vary between the study’s different experimental conditions is called a confound. A confound can be a potential third variable in your study.
Consider a confound in your experiment on study methods and exam performance. Imagine that the participants in the control group (who used the repeated reading study technique) all had a very complex passage to read and learn. Also imagine that the participants in the experimental group (who used the study technique of repeated practice) had a much simpler passage to read and learn. In this example, the participants’ exam performance might be confounded with the type of passage they had to read. If students in the experimental (repeated practice) group ended up performing better, it would be impossible to tell whether they did better because of their study technique or because they had a simpler passage to study. To eliminate this possible confound, researchers could ensure that both groups receive identical passages.
The more confounds and thus alternative explanations that can be eliminated, the more confident a researcher can be that the change in the independent variable is causing the change in the dependent variable. Control is the key to the experimental approach because it allows the researcher to rule out alternative explanations for the observed data. This is important for you to remember when you read reports of psychological research in the media. Thinking critically about the quality of the evidence presented (Step 2 in the Learning Tip on p. 11) includes being on the lookout for confounds that could be causing the results that are reported in the news.
A Random Sample Allows Generalization of Results At the start of research, experimenters need to consider the selection of participants. Psychologists typically want to know that their findings generalize to people other than just the participants who take part in the research. In other words, the results should apply to as many people as possible. After all, most researchers are not merely interested in what study technique works best for students taking Psychology 101 at one college in the United States. Rather, they are interested in what study technique works best for as many students as possible anywhere.
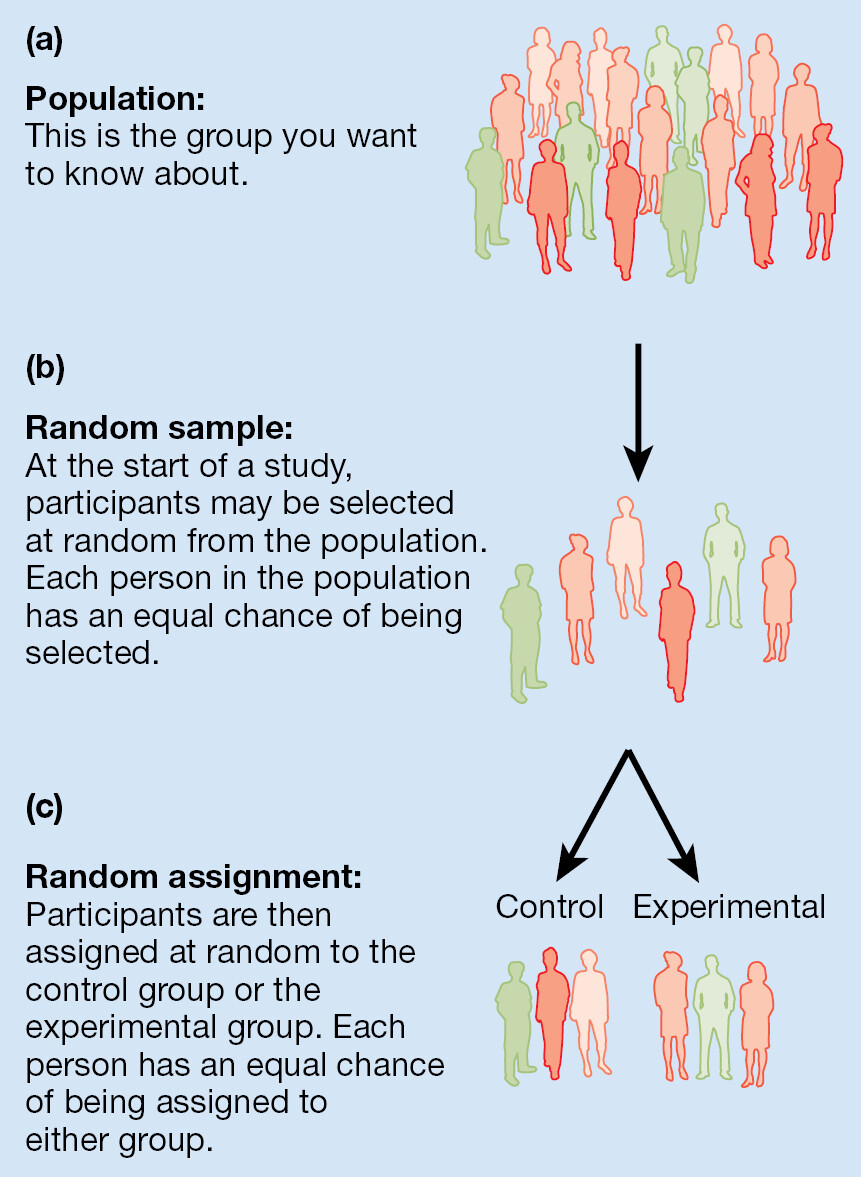
Three paragraphs (A,B,C) explaining random assignment and sampling with pictorial examples to the side of each paragraph. A states Population: This is the group you want to know about. To the right of A, there is a large group of people. B states Random sample: At the start of a study, participants may be selected at random from the population. Each person in the population has an equal chance of being selected. Next to B, there is a small group of people. C states Random assignment: Participants are then assigned at random to the control group or the experimental group. Each person has an equal chance of being assigned to either group. Next to C, a group of people split into two groups - a control group and an experimental group.
FIGURE 1.28 Population, Random Sample, and Random Assignment
In experiments, researchers identify a population of interest and take a random sample of those people to participate in the study. Researchers then use random assignment to place those participants in either the control group or the experimental group. What do we call the group of people that the researcher wants to know about but may or may not be included as participants in the experiment?
The general group you want to know about is your population (Figure 1.28a). For instance, you might want your results to generalize to college students, to people of certain age ranges or from certain cultural backgrounds, and so on. To learn about the whole population of interest, you study a subset, or a small number, of people from that population. Sampling is the process you use to select people from the population to participate in the study, and the subset of people chosen to participate in the research is called the sample. The best way to represent the whole population is to take a random sample (Figure 1.28b). This method gives each member of the population an equal chance of being chosen to participate in the research.
If you are trying to generalize your findings to the entire human population, then random sampling from all humans is, of course, likely to be impossible. Most often researchers use a sample consisting of people who are conveniently available for the study. This type of sample is called a convenience sample. Even if you wanted your results to generalize to all students in your country or in the world, you would probably still use a sample from your own college or university. However, you would try to collect a random sample from within this convenience group. Even though a sample from your own college might not look like all students in the country, it seems reasonable as a starting point for the research. However, it is important to recognize that the results may not generalize to other samples of people who are quite different, such as people from different cultures, other parts of the country, or other countries (Henrich et al., 2010). Remember what you learned about diversity and Step 5 in the scientific method: Conducting additional research to extend the findings to new situations and new populations of diverse participants increases confidence in the importance of the findings. Additional research is especially important if you use a convenience sample in your research.
Random Assignment Equates Groups Are the people in your experiment all the same? Of course not. There are many individual differences among participants. For this reason, one possible confound in experiments is that people in the control group and the experimental group may differ in important ways.
Many individual differences could affect the outcome of your experiment, such as how many years of higher education the participants have had, their strength as a student, and how well they read and understand English. Suppose that the participants in your control group (who study by repeatedly rereading) tended to have a higher grade point average (GPA) than the participants in the experimental group (who study by repeated practice). In this case, participants in the control group might score high grades on the exam just because they are better students than the participants in the experimental group. This outcome would have nothing to do with the manipulation of study technique, and it would make the research findings useless.
Researchers try to address this issue by using random assignment to place participants in the experimental and control groups (Figure 1.28c). Random assignment gives each potential research participant an equal chance of being assigned to the control or experimental group to make sure (as much as possible) that the groups do not differ. For example, to randomly assign participants, you might have them draw numbers from a hat to determine who is assigned to the control group (repeated reading) or the experimental group (repeated practice). Each group might include some people with a lower GPA and some people with a higher GPA. But these differences will tend to average out when participants are randomly assigned to either the control group or the experimental group. This averaging out happens because the groups will be equivalent on average in terms of participants’ academic abilities and with respect to other individual characteristics too. Using random assignment to balance out known and unknown factors helps to reduce confounds that could limit the researcher’s ability to say that a certain manipulation caused a certain outcome.
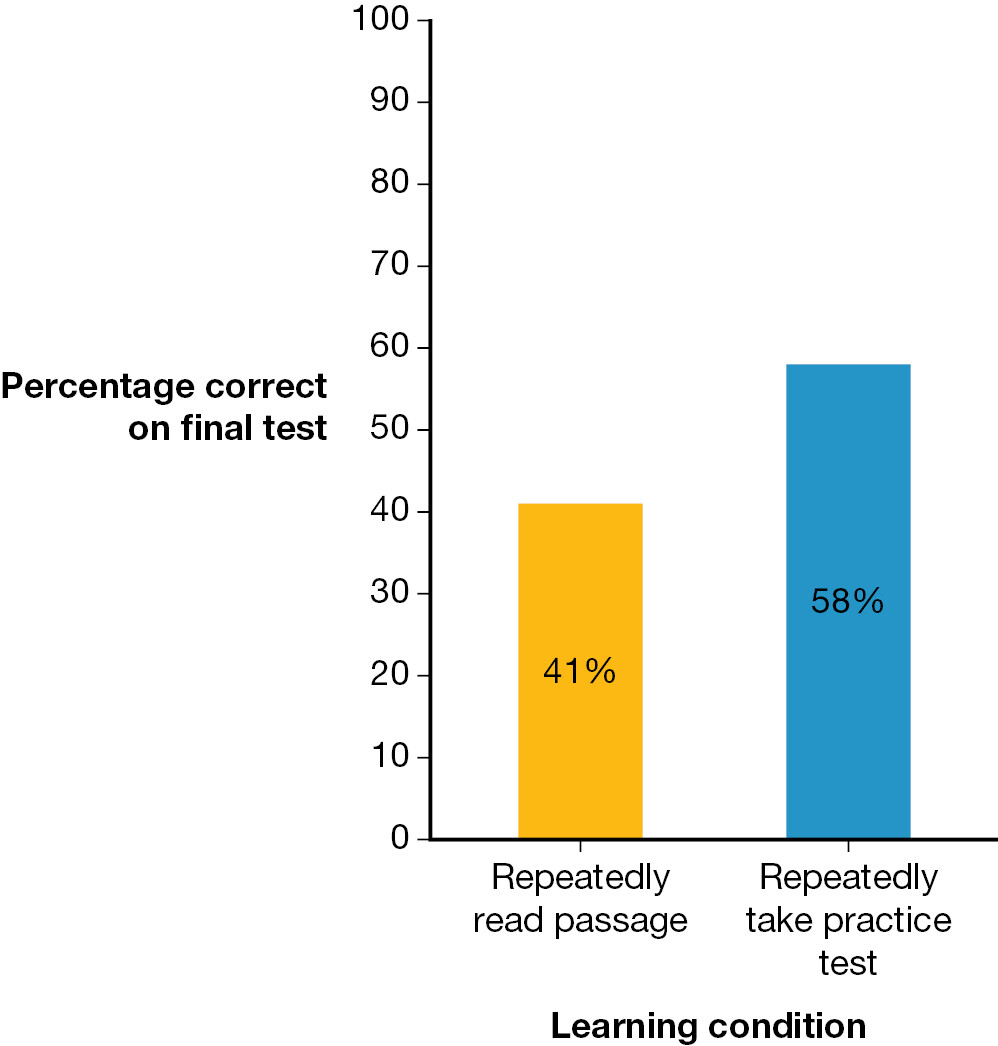
The vertical axis is labeled Percentage correct on final test, and ranges from 0 to 100 in increments of 10. The heights of the bars for the two learning conditions are as follows: Repeatedly read passage, 41 percent; Repeatedly take practice test, 58 percent.
FIGURE 1.29 Studying by Repeated Practice Improves Exam Scores More Than Repeated Reading of Material
Across many studies, research has found that using repeated practice (right bar), for example, by taking practice tests, leads to better learning and/or performance on later exams than does repeatedly reading material (left bar).
If you have followed the five steps in the scientific method as closely as possible in conducting your experimental research, then you are likely to obtain results that provide insight into how students can study effectively to learn information and get good grades. Appendix A describes in greater detail what experimental research might reveal about how using a specific study technique affects later exam performance. The most important point to make now is that a lot of recent research has focused on this topic, and the results are clear: As Figure 1.29 shows, using repeated practice (for example, by taking practice tests) leads to better outcomes than simply rereading material (Roediger & Butler, 2011). For this reason, study unit 1.2 pointed to repeated practice as one of the most powerful of the six IMPACT strategies that you can use in college. Remember that there are many opportunities for repeated practice in this textbook to help you learn the material, so be sure to answer the Learning Goal Checks, the questions in figures, and the Practice Test questions at the end of each chapter (see p. 45).
Now that you have finished the first chapter of this book, we hope that you are beginning to see how learning about psychology and psychology research can provide many insights into yourself and the people around you and how these insights will assist you in your personal, academic, and professional life. Perhaps now you are prepared to accept the big claim that we made at the start of this chapter: Introductory psychology will likely be the most useful course that you take.

IMPACT LEARNING PAUSE
Are You Improving?
Did the news headlines in Figure 1.24 “trick” you? Start improving critical thinking about research by adopting a growth mindset.
LEARNING GOAL CHECK: REVIEW & APPLY
To learn about how psychologists understand what the data from their research reveal, see Appendix A: How Do Psychologists Analyze Data from Research?