Describe the social composition of the American population and how it has changed over time
While American democracy aims to give the people a voice in government, the meaning of “we the people” has changed over time. Who are Americans? Throughout the nation’s history, politicians, religious leaders, prominent scholars, and ordinary citizens have puzzled and fought over the answer to this fundamental question.
Immigration and American Diversity
The U.S. population has grown from 3.9 million in 1790, the year of the first official census, to 333 million in 2022.14 At the same time, it has become more diverse on nearly every dimension imaginable.15 (See Who Are Americans?, p. 17.)
In 1790, when the nation consisted of 13 states along the Eastern Seaboard, 81 percent of Americans traced their roots to Europe, mostly Britain and elsewhere in northern Europe, and nearly 20 percent, the vast majority of whom were enslaved, were of African origin.16 Only 1.5 percent of the Black population were free. There were also an unknown number of Native peoples, the original inhabitants of the land, not counted by the census because the government didn’t consider them Americans. The first estimates of Native Americans and Latinos in the mid-1800s showed that each group made up less than 1 percent of the total population.17
Fast-forward to 1900. The country now stretched across the continent, and waves of immigrants, mainly from Europe, had boosted the population to 76 million. It still predominantly comprised people of European ancestry, but it now included many from southern and eastern as well as northwestern Europe; the Black population stood at 12 percent. Residents who traced their origin to Latin America or Asia each accounted for less than 1 percent of the population.18 The large number of new immigrants was reflected in the high proportion of foreign-born people in the population, which peaked at 14.7 percent in 1910.19
More information
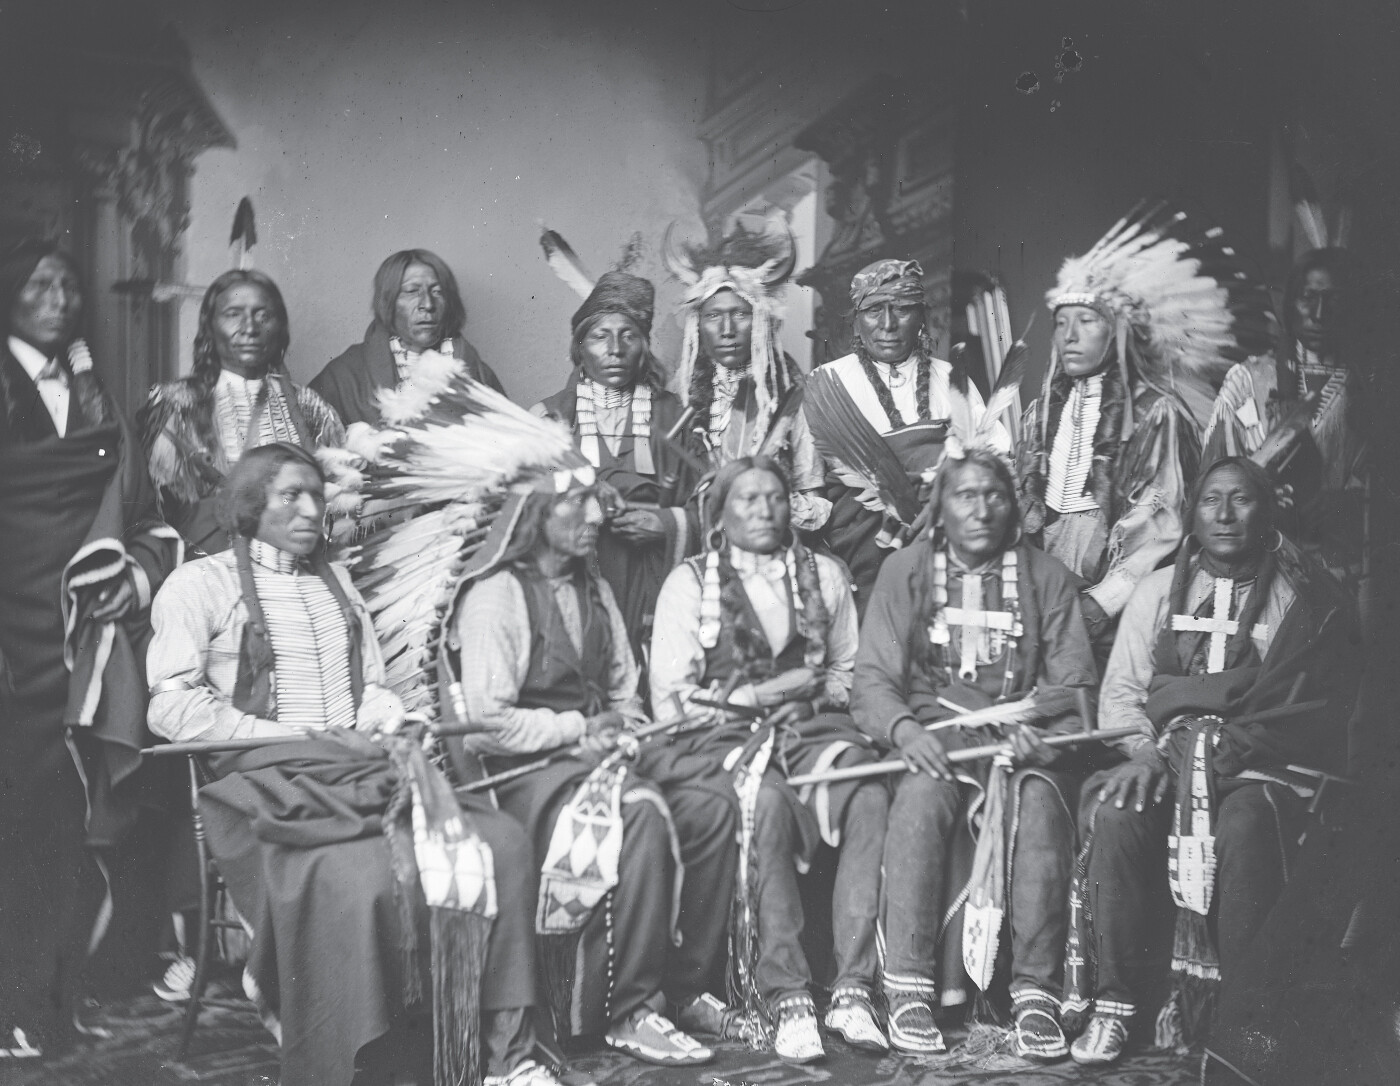
A portrait of Red Cloud and other Sioux Warriors, taken around 1870. The five in front are seated. The eight behind them are standing. Most are wearing elaborate traditional costumes. Two are wearing feathered war bonnets.
More information
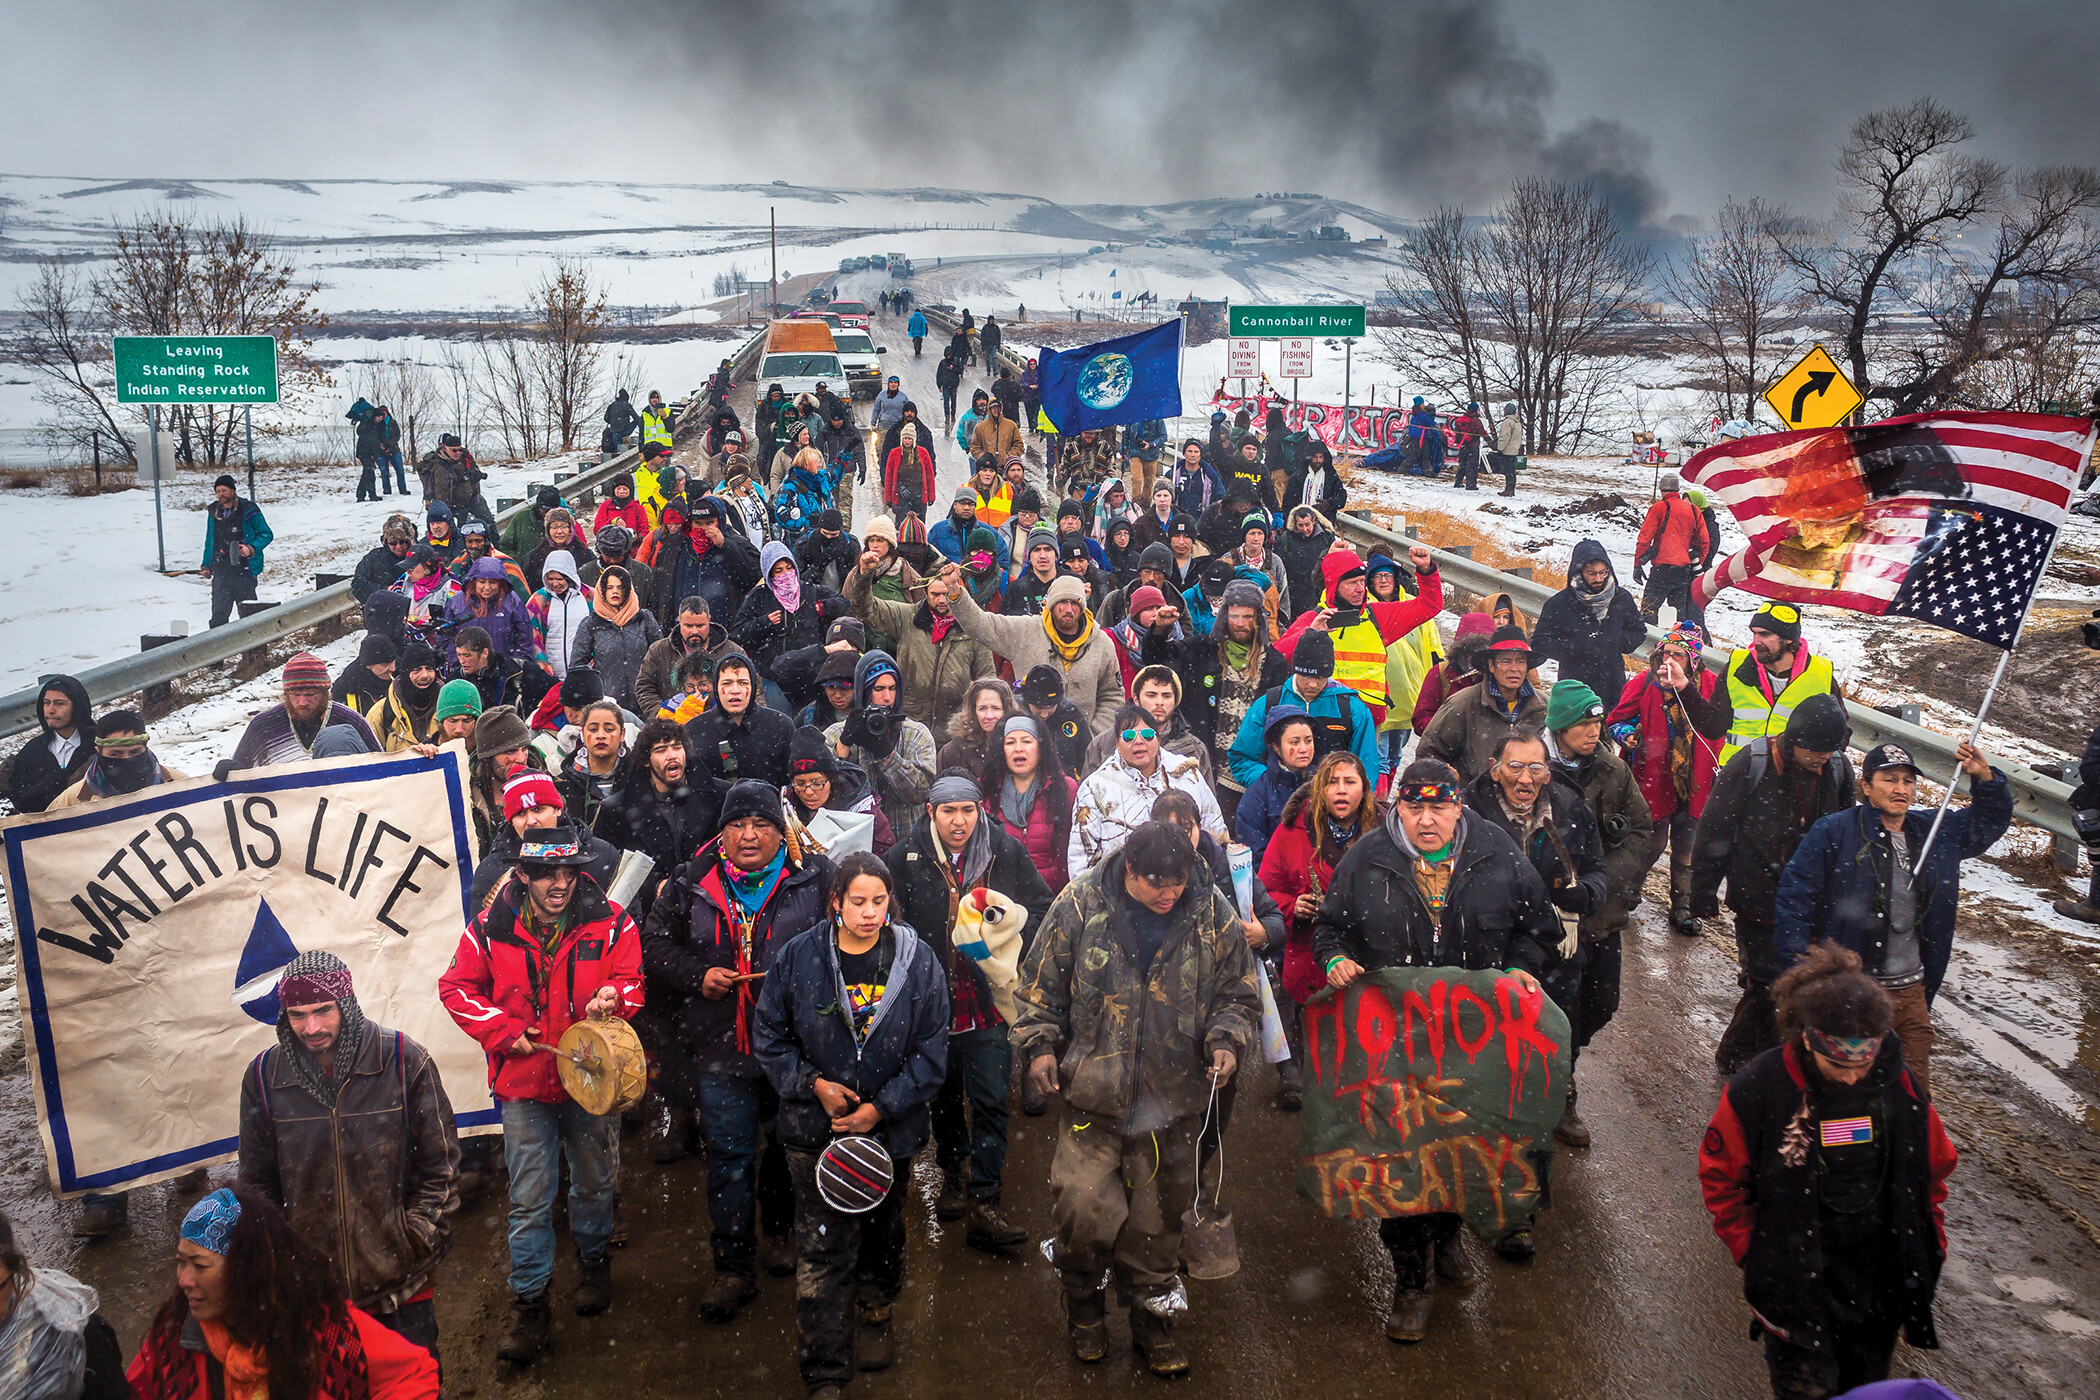
Native Americans and others who have joined them stand blocking a bridge over the Cannonball River in Southwestern North Dakota. There is snow on the ground, and everyone is bundled up against the cold. One person holds a sign that reads, Water Is Life. Another carries an American flag that is upside-down as a symbol of distress.
Native nations existed for thousands of years before the first European settlers arrived. By the time this photo of Red Cloud and other Sioux warriors was taken (left), around 1870, Native peoples made up about 1 percent of the American population. Today, many Native nations are considered sovereign nations and exist parallel to the United States government. The sovereign status of Native nations has sometimes led to fierce disagreement when the United States government does not fully engage them in decisions that impact their livelihood, such as the Dakota Access Pipeline protest seen here organized by the Standing Rock Sioux (right).
As immigrants from southern and eastern Europe crowded into the nation’s cities, anxiety mounted among those of British and other northwestern European ancestry, who feared losing their long-dominant position in American society and politics. Much like today, politicians and scholars argued heatedly about whether the country should welcome such large numbers of immigrants. Concerns ranged from whether the new immigrants’ political and social values were compatible with American democracy, to whether they would learn English, to what new diseases they might bring. Growing religious differences became a source of tension as well. The first European immigrants to the United States were overwhelmingly Protestant, many fleeing religious persecution. But the German and Irish Catholics who arrived in the mid-1800s began to shift the religious balance, which changed further in the early twentieth century as more Catholics from southern Europe and Jews from eastern Europe and Russia arrived. This new religious diversity challenged the Protestantism previously assumed in many aspects of American life.
After World War I, Congress responded to nativist fears about immigration with new laws that sharply limited how many people could enter the country each year. It also passed the Immigration Act of 1924, which used a national origins quota system, based on the nation’s population in 1890, before the wave of eastern and southern European immigrants arrived.20 Supporters of these measures hoped to restore an earlier America in which northern and western Europeans dominated. The new system set up a hierarchy of admissions: northern and western European countries received generous quotas for new immigrants, whereas eastern and southern European countries were granted very small quotas. And almost all immigrants from Asian and African countries were banned.21 By 1790 these guidelines had reduced the foreign-born population in the United States to an all-time low of 5 percent.
The use of ethnic and racial criteria to restrict the country’s population and to draw boundaries around “American” identity began long before the national origins quota system, however. Most people of African descent were not deemed citizens until 1868, when the Fourteenth Amendment to the Constitution granted citizenship to formerly enslaved people (see Chapter 2). Native Americans weren’t officially recognized as citizens until the Indian Citizenship Act of 1924, but this did not include suffrage. More broadly, efforts to limit nonwhite immigration and citizenship dated back to the Naturalization Act of 1790—a law stating that only free White people could become naturalized citizens, a ban not lifted until 1870. Even then, different restrictions applied to Asians: the Chinese Exclusion Act of 1882 outlawed the entry of Chinese laborers to the United States, a limit lifted only in 1943, when China became America’s ally during World War II. And after the Japanese attack on Pearl Harbor in 1941, virtually all Japanese Americans were denied their basic rights of citizenship and were incarcerated for the duration of the war.
WHO ARE AMERICANS?
An Increasingly Diverse Nation
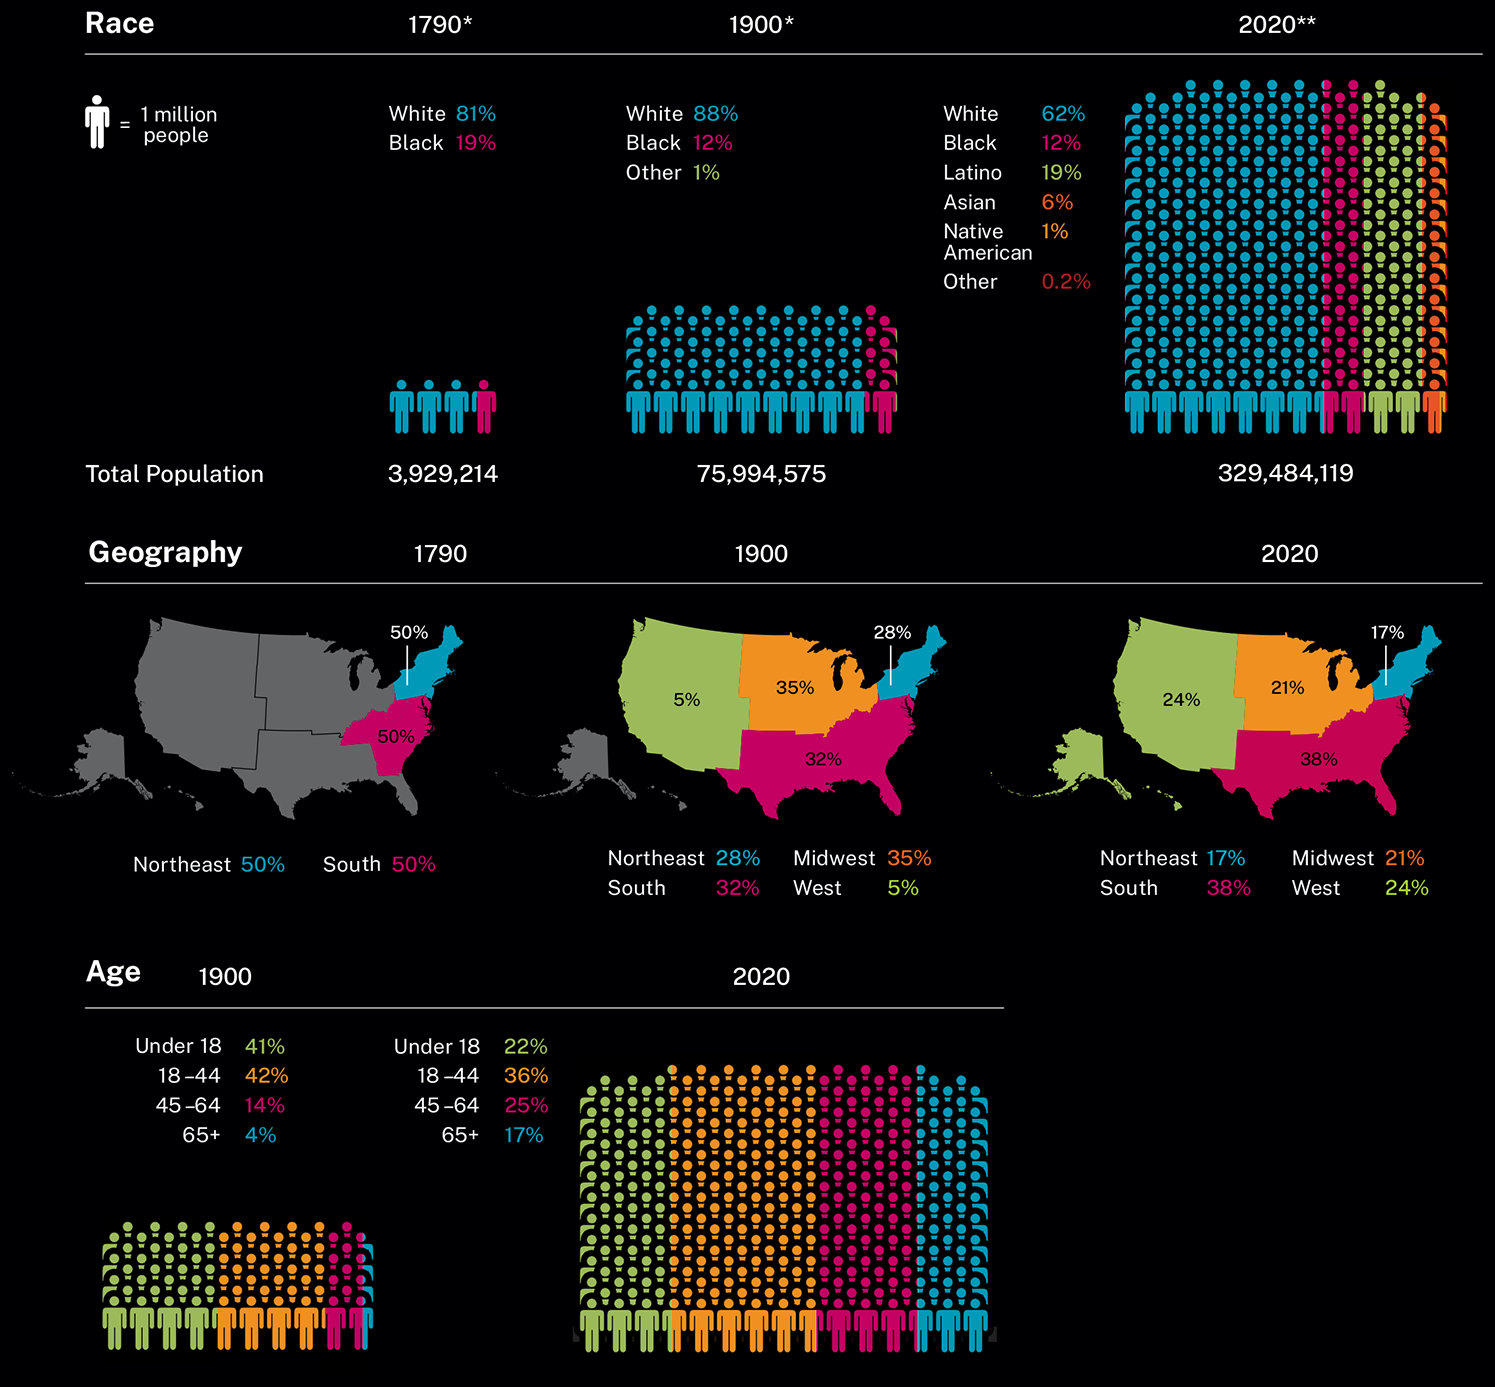
Since the Founding, the U.S. population has grown rapidly and people living in the United States have become increasingly diverse. Dramatic changes in population, demographics, and geography often drive changes in American government and politics.
More information
A graphic shows America growing from a population in 1790 of just under 4 million that is 81% white and 19% black, to a population of about 76 million in 1900 that is 88% white, 12% black, and 1% other, to a population in 2020 of almost 330 million that is 62% white, 12% black, 19% latino, 6% Asian, 1% Native American, and 0.2% other. Footnotes state that the 1790 census does not accurately reflect the population because it only counted Black people and White people. It did not include Native Americans or other groups. The 1900 census did not count Latino Americans. Numbers may not add up to 100 percent due to rounding.
A map shows that in 1790 half the U S population was in the northeast, including Pennsylvania, and the other half was in an area south of the Ohio River and extending as far south as Georgia. A second map shows that in 1900, the Northeast accounted for 28% of the U S population, the South including Texas accounted for 32%, northern states from the Dakotas to Ohio accounted for 35%, and the remaining western states accounted for only 5%. A third map shows that in 2020, the Northeast accounted for 17% of the U S population, the South accounted for 38%, northern states from the Dakotas to Ohio accounted for 21%, and the remaining western states accounted for 24%.
A graphic gives age breakdowns for 1900 and 2020. In 1900, the population was 41% under 18, 42% aged 18 to 44, 14% 45 to 64, and 4% 65 or older. In 2020, the population was 22% under 18, 36% aged 18 to 44, 25% 45 to 64, and 17% 65 or older.
* The 1790 census does not accurately reflect the population because it only counted Black people and White people. It did not include Native Americans or other groups. The 1900 census did not count Latino Americans.
** Numbers may not add up to 100 percent due to rounding.
SOURCE: U.S. Census Bureau, American Community surveys, data.census.gov (accessed 1/6/21).
FOR CRITICAL ANALYSIS
The most recent census estimates show that the population of the South and the West continued to grow more rapidly than the Northeast and the Midwest. What are some of the political implications of this trend?
Today, Americans over age 38 outnumber Americans under 38, and older adults are more likely to participate in the political process. What do you think this means for the kinds of issues and policies considered by the government?
More information
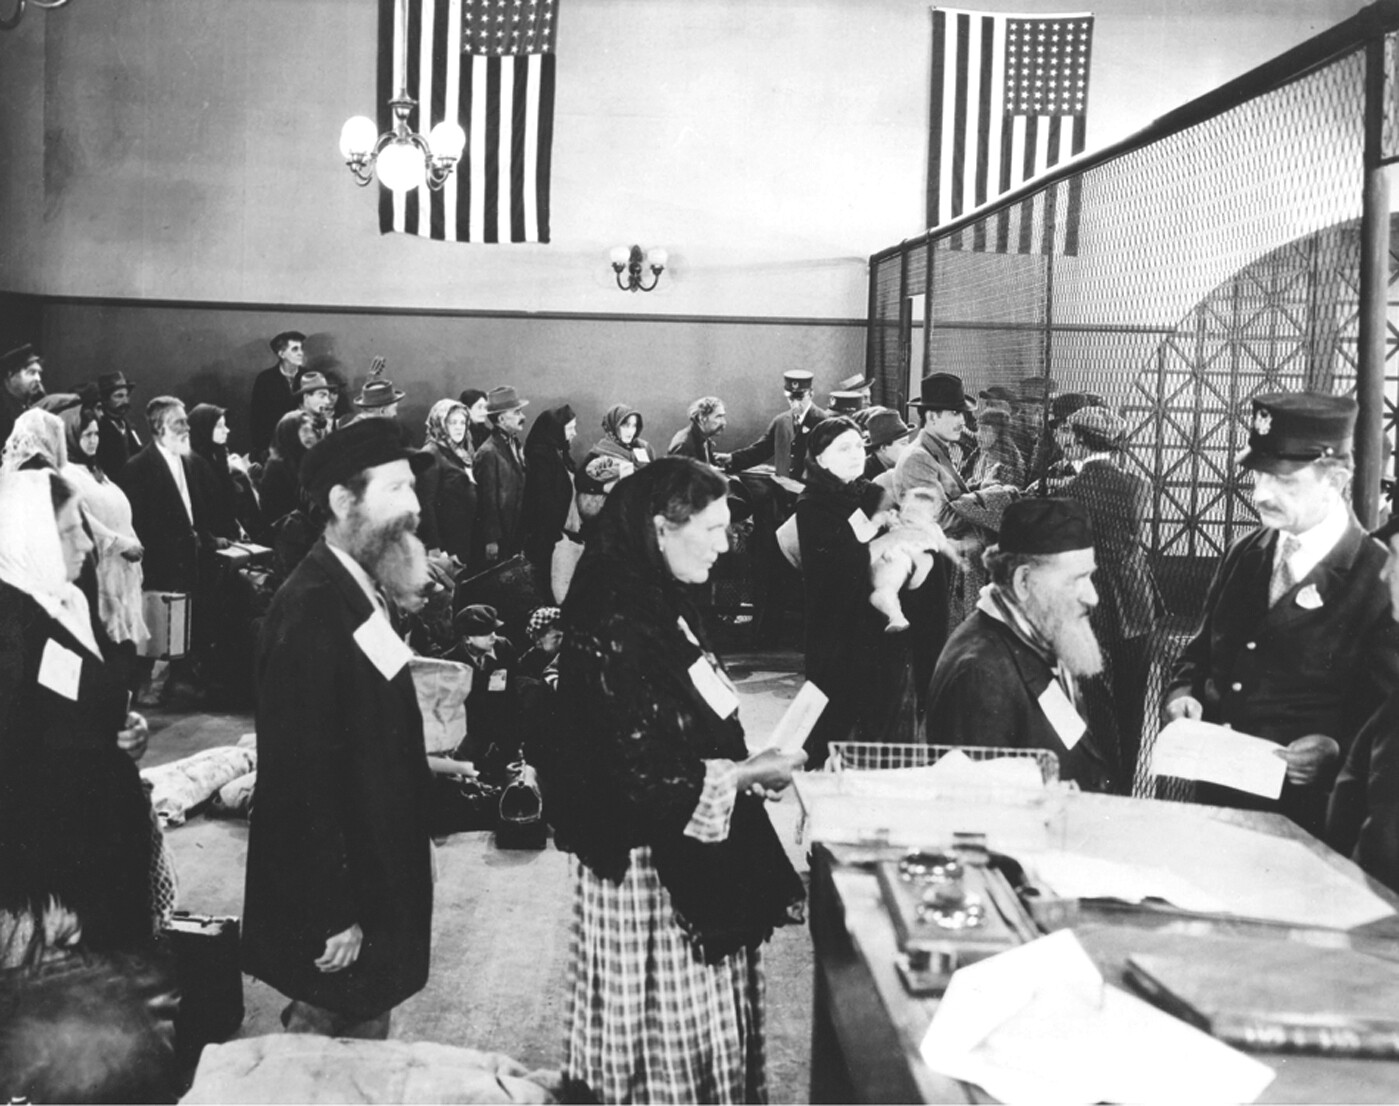
Lines of immigrants being processed in an immigration center during the 1900’s. In the line in the foreground, the two men have beards and wear dark, broad-brimmed hats. The two women wear head scarves.
More information
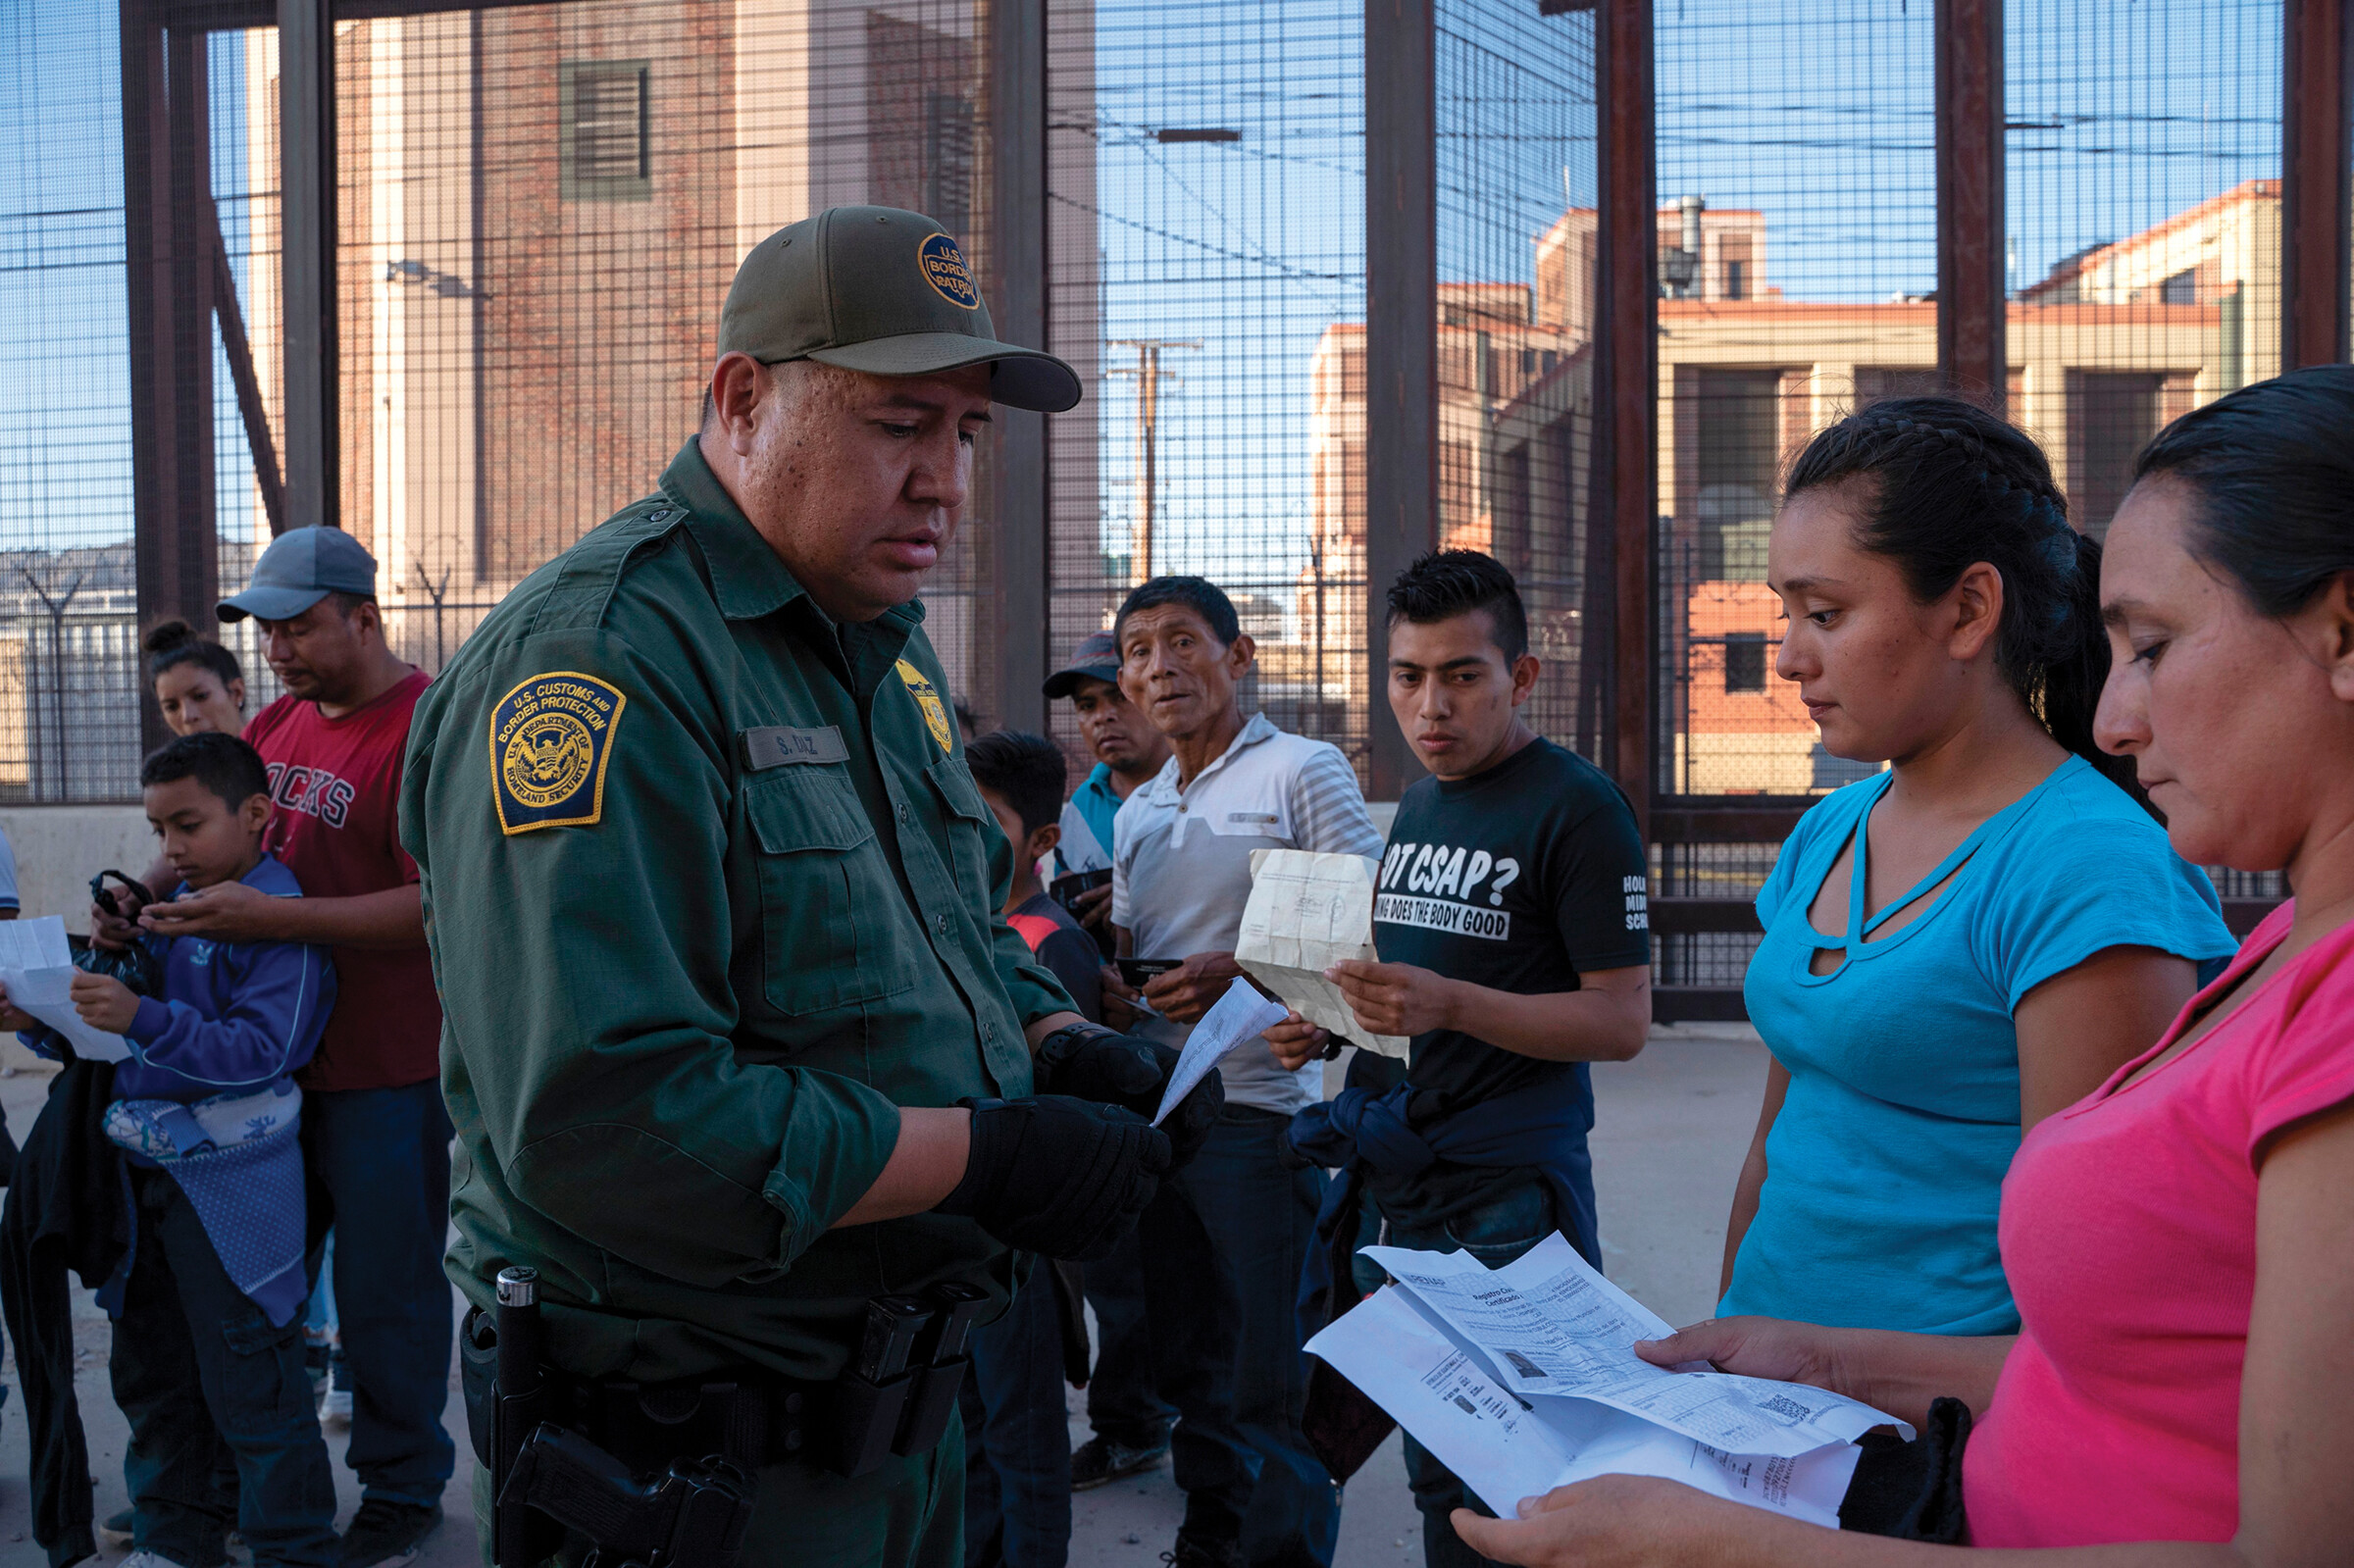
An immigration officer verifying the documents of a group of people. A very high fence looms in the background.
In the 1900s many immigrants entered the United States through New York’s Ellis Island, where they were checked for disease before being admitted. Today, individuals hoping to immigrate to the United States often apply for a visa at the U.S. consulate in their home country before traveling to the United States, where the U.S. Customs and Border Protection checks their identity and legal status.
With laws about citizenship linked to “Whiteness,” questions arose about how to classify people of Latino origin. In 1930, for example, the census counted people of Mexican origin as nonwhite, but a decade later it reversed this decision—after protests by those affected and by the Mexican government. Then, in 1960, the census classified immigrants from Latin America as White. Only after a lengthy campaign by Latino activists and business leaders did the census adopt a “Hispanic” classification category in 1970, noting also that people identifying as Hispanic could be of any race.22 (The census uses the term Hispanic, but we will generally use the term Latino to refer to people of Spanish or Latin American descent.)
As this history suggests, debates have raged for more than two centuries about who can come to the United States, who can become a citizen, and who should be counted by the census and how.
Twenty-First-Century Americans
Race and Ethnicity
Recent immigration patterns have profoundly shaped the nation’s current racial and ethnic profile. The primary cause was Congress’s decision in 1965 to lift the tight restrictions of the 1920s, allowing expanded immigration from Asia and Latin America (see Figure 1.1). Census figures for 2020 show that Latinos (who can be of any race) constitute 18.7 percent of the total population, and Asians make up 6 percent. The Black, or African American, population is 12.4 percent of the total, while the non-Hispanic White population accounts for 61.6 percent. More than 33 million Americans, about 1 in 10, now identify as being of “two or more races,” a category that was added in 2000.23 Notably, in 2019, for the first time, more than half of Americans under age 16 identified as a member of a racial or ethnic minority group. The United States is continuing to diversify and is projected to become a majority-minority country by 2050.
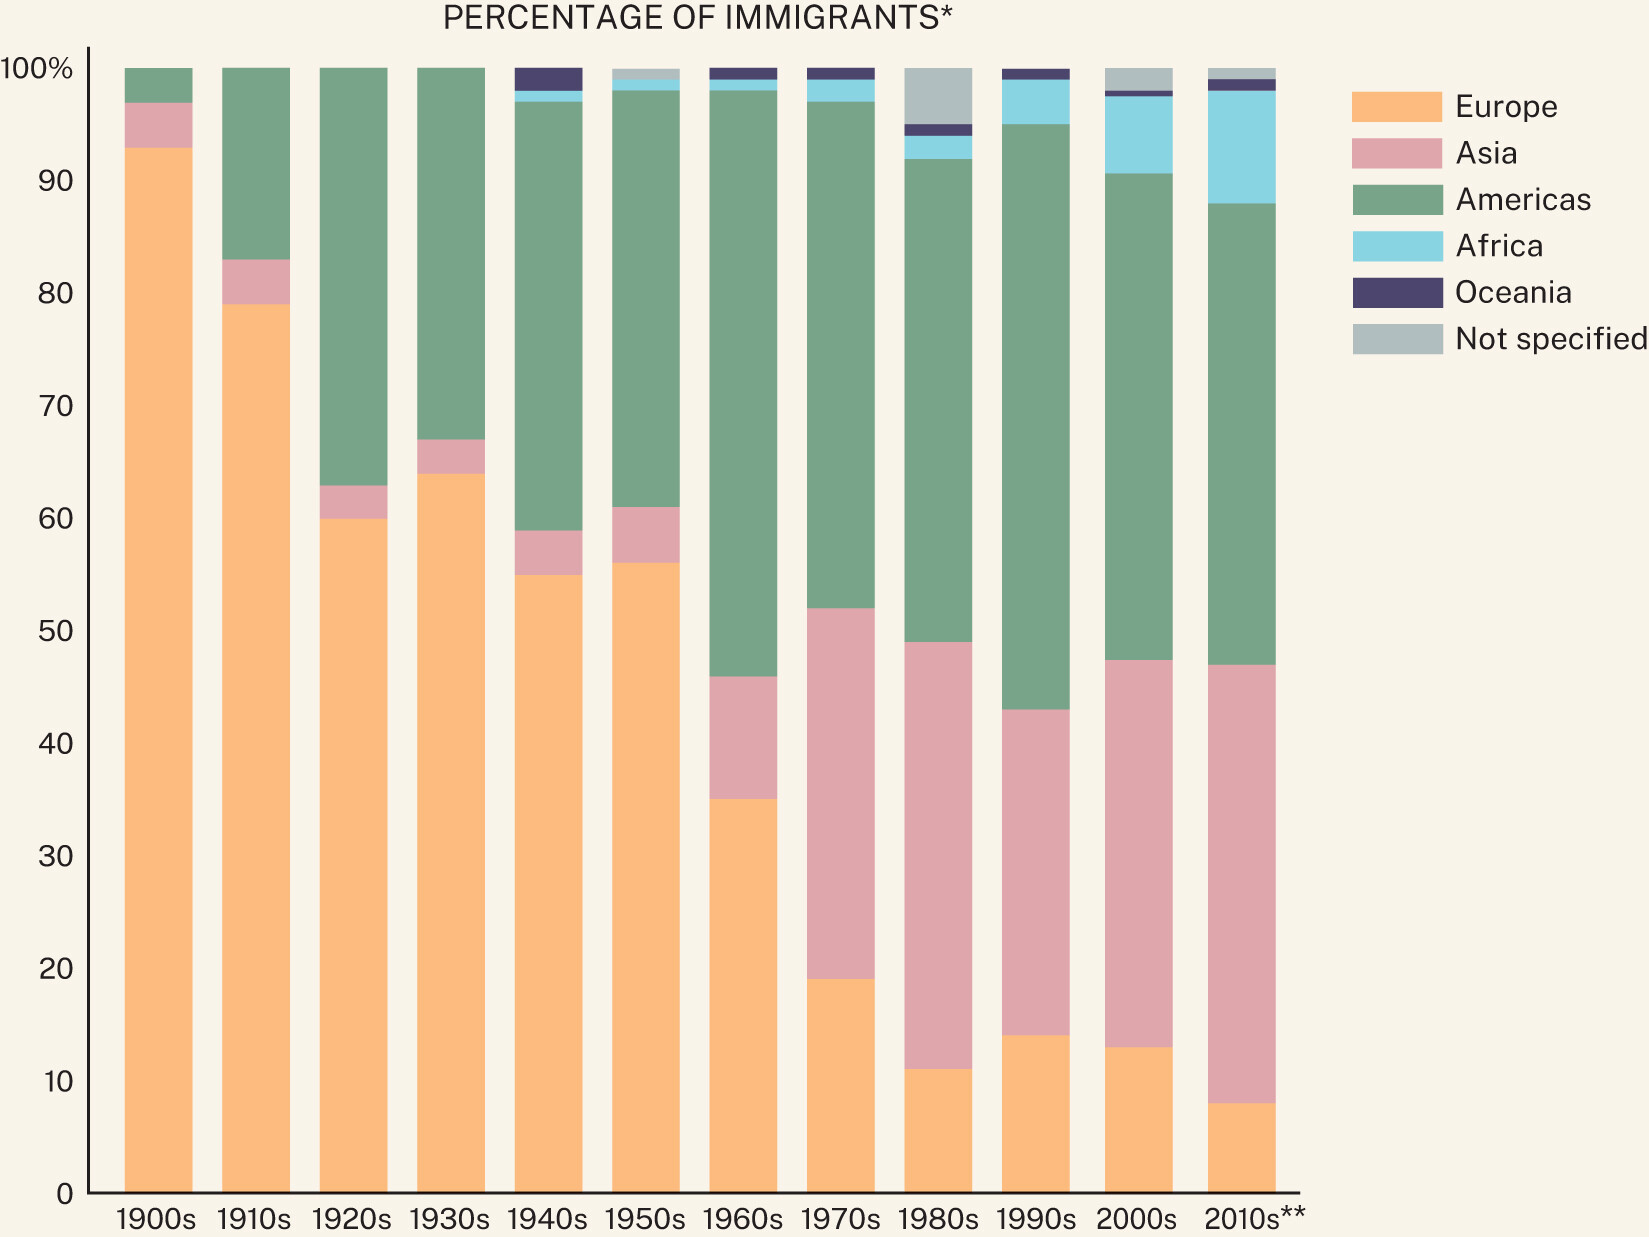
FIGURE 1.1Immigration by Continent of Origin
Where did most immigrants come from at the start of the twentieth century? How does that compare with immigration in the twenty-first century?
More information
A graphic showing Immigration by Continent of Origin for every decade after 1900. A series of vertical bars shows that in the first decade of the 20th century, well over 90% of immigrants were from Europe. The percentage from the Americas grew steadily from then on, however, and in the 1960s, slightly more than half of immigrants were from the Americas. At that point, immigration from Asia began to grow, as well, and Africa also started to become a significant contributor to overall immigration. In the 2010s, about 40% of immigrants were from the Americas, another 40% from Asia, roughly 10% from Africa and also Oceana, and less than 10% from Europe. Information for the 2010s is up through 2018.
*Less than 1 percent not shown.
**Through 2018.
NOTE: Figure shows those who have obtained “lawful permanent resident status” by continent of origin.
SOURCE: Department of Homeland Security, www.dhs.gov (accessed 1/19/20).
Large-scale immigration means that many more residents now are foreign-born. In 2020, 13.2 percent of the population were born outside the United States, a figure comparable to that in 1900.24 About half came from Latin America and the Caribbean—almost 1 in 10 from the Caribbean, just over one-third from Central America (including Mexico), and 1 in 15 from South America.25 Those born in Asia made up 31.3 percent of foreign-born residents.26 In sharp contrast to the immigration patterns of a century earlier, just 10.9 percent came from Europe.27
Estimates are that 12 million immigrants live in the country without legal authorization—the majority from Mexico and Central America.28 This unauthorized population has become a flashpoint for controversy as states and cities have passed a variety of conflicting laws regarding these immigrants’ access to public services. Several decades ago, some states tried to exclude undocumented immigrants from public services such as education and emergency medical care, but in 1982 the Supreme Court ensured access to K–12 education in its Plyler v. Doe ruling, and Congress guaranteed access to emergency medical care in a 1986 law.29 Today, undocumented immigrants remain ineligible for most federal public benefits, but some states allow them to obtain driver’s licenses or in-state tuition at public colleges and universities.30
Religion
New patterns of immigration have combined with differences in birth rates and other social changes to alter the balance of Americans’ religious affiliations. By 2021, only 35 percent of Americans identified as Protestant, 22 percent as Catholic, 10 percent as Christian (nonspecific), 2 percent Jewish, 1 percent Mormon, and 6 percent “Other” (this includes Muslims, who constitute nearly 1 percent of the population). Moreover, a growing number identify with no organized religion: 21 percent of the population in 2021. 31These changes suggest an important shift in American religious identity. Although many Americans think of the United States as a “Judeo-Christian” nation—and indeed it was 95 percent Protestant, Catholic, or Jewish as recently as 50 years ago—by 2021 this number had fallen to 69 percent of the adult population. 32The freedom to practice one religion, to change religions, or to practice no religion at all was considered a key value in the writing of the Constitution and was inscribed in the First Amendment.
FOR CRITICAL ANALYSIS
What trend in America’s changing population do you think has had the biggest influence on the nation’s politics over time? Increasing racial and ethnic diversity? Aging? Changing religious affiliation? Increasing urbanization? Increased economic inequality? Why? Which trend do you think has had the most influence recently? Why?
Age
As the population has grown and diversified, the country’s age profile has shifted with it. In 1900 only 4 percent of the population was over age 65. As life expectancy increased, so did the number of older Americans: by 2020, 16 percent of the population was over 65. During the same period, the percentage of children under age 18 fell, from 44 percent in 1900 to 22.4 percent in 2020.33 However, the population of racial and ethnic groups is younger than the American population overall: 32 percent of the Latino population and 26 percent of the Black population are under 18, compared to 19 percent of the White population. As a group, Americans are still younger than the populations of many other industrialized countries. The share of the population age 65 and over is 21 percent in the European Union and 28 percent in Japan.34 But an aging population poses challenges. As the elderly population in the United States grows relative to those of working age, the funding of “safety-net” programs such as Social Security becomes more difficult.
Geography
Over the nation’s history, Americans have mostly moved from rural areas and small towns to large cities and suburbs. Before 1920 less than half the population lived in urban areas; today over 80 percent does.35 As a result, the national political system created when the population was still largely rural underrepresents urban Americans. Providing each state with two senators, for example, overrepresents sparsely populated rural states and underrepresents those with large urban populations (see Chapter 2).
The population has also shifted regionally. During the past 50 years especially, many Americans have left the Northeast and Midwest and moved to the South and Southwest, with congressional seats being reapportioned to reflect the population shift.
Socioeconomic Status
For much of U.S. history, most Americans were relatively poor working people, many of them farmers. A new, extremely wealthy elite emerged in the late 1800s, a period called “the Gilded Age.” By 1928 nearly one-quarter of total annual national income went to the top 1 percent of earners; the top 10 percent took home 46 percent of the total. In the mid-twentieth century, the distribution of income and wealth shifted away from the top. A large, predominantly White middle class grew after New Deal programs helped counteract the Great Depression of the 1930s, and it grew further with the postwar economic boom of the 1950s and ’60s.
The Civil Rights Act of 1964 outlawing legal segregation, and President Lyndon B. Johnson’s War on Poverty programs in the 1960s, were instrumental in providing greater workplace opportunities for people from various racial and ethnic groups. During this time, median Black household income rose by 53 percent and the proportion of Black people below the poverty line dropped from 55 percent in 1960 to 27 percent in 1968. Overall, the income disparity between those at the bottom and those at the top continued to shrink as well: the share of national income going to the top 1 percent dropped sharply, to just 9 percent by 1976.
Since then, however, economic inequality has again widened in what some call a “new Gilded Age.”36 Rising economic inequality is connected to a number of factors, including deindustrialization, globalization, slow growth in wages for the lowest-wage workers, and technological change.37 The Great Recession between 2007 and 2009 further exacerbated economic inequality, as speculative lending ultimately caused home prices to crash and led to many families losing their homes through foreclosure.38 After a period of recovery, the Covid-19 pandemic contributed to a widening of long-standing economic divides. By 2021 the top 1 percent earned 27 percent of total household wealth. During that same time, the middle 60 percent of households saw their wealth drop to 26.6 percent—the lowest in three decades. In other words, the top 1 percent hold more wealth than America’s middle class.39 At the same time, there has been an increase of people who live below the poverty line, to 11.4 percent of the population (see Figure 1.2).40
But there are significant racial differences among levels of income and wealth. Wealth is defined as the difference between a household’s assets (what you own that contains economic value, like houses and stock) and debt. The term “racial wealth gap” refers to the disparity in assets of typical American households across racial and ethnic groups. According to recent data, the median White household had $188,200 in wealth, compared to just $36,100 for the median Latino household and $24,100 for the median Black household.41
Population and Politics
The changing contours of the American population have regularly raised challenging questions about politics and government. Population growth and shifts have spurred politically charged debates about how to apportion the population among congressional districts and how to draw those districts. These conflicts have significant implications for the balance of representation among different regions of the country and between urban and rural areas. Representation of other demographic and political groups may also be affected, as evidence shows that Americans are increasingly divided from one another geographically according to education, income, marriage rates, and party voting.42
In addition, immigration and the resulting cultural and religious changes spark passionate debate today, just as they did 100 years ago. (You can read about valuable debate tips in the How To feature on p. 24.) The different languages and customs that immigrants bring trigger fears among some that the United States is changing in ways that undermine traditional American values. The large number of unauthorized immigrants heightens these anxieties. Yet a changing population has been one of the constants of American history. Indeed, each generation has confronted the many political challenges associated with answering the question anew, “Who are Americans?”
FIGURE 1.2 Wealth in the United States
While the wealth of most Americans has risen only slightly since 1989, the wealth of the richest Americans (the top 10 percent) has increased dramatically. In 2022, the top 10 percent of Americans had more than double the total amount of combined wealth held by the middle 40 percent and bottom 50 percent of Americans. Does the growing economic gap between the richest groups and most other Americans conflict with the political value of equality?
SOURCE: Federal Reserve, “Distribution of Household Wealth in the U.S. since 1989,” www.federalreserve.gov/releases/z1/dataviz/dfa/distribute/chart/ (accessed 9/22/22).
Endnotes
U.S. Census Bureau, Population Clock, www.census.gov/popclock/ (accessed 8/23/22).Return to reference 14
Nicholas Jones et al., “2020 Census Illuminates Racial and Ethnic Composition of the Country,” August 12, 2021, U.S. Census Bureau, www.census.gov/library/stories/2021/08/improved-race-ethnicity-measures-reveal-united-states-population-much-more-multiracial.html (accessed 4/10/22).Return to reference 15
Carter et al., Historical Statistics of the United States, Table Aa145-184, Population, by Sex and Race: 1790–1990, 23.Return to reference 16
Carter et al., Historical Statistics of the United States, Table Aa145-184, Population, by Sex and Race: 1790–1990, 23; Table Aa2189-2215, Hispanic Population Estimates.Return to reference 17
Campbell J. Gibson and Emily Lennon, “Historical Census Statistics on the Foreign-Born Population of the United States: 1850–1990,” February 1999, www.census.gov/library/working-papers/1999/demo/POP-twps0029.html (accessed 4/10/22).Return to reference 18
Carter et al., Historical Statistics of the United States, Table Aa22-35, Selected Population Characteristics.Return to reference 19
Michael B. Katz and Mark J. Stern, One Nation Divisible: What America Was and What It Is Becoming (New York: Russell Sage Foundation, 2006), 16.Return to reference 20
Mae M. Ngai, Impossible Subjects: Illegal Aliens and the Making of Modern America (Princeton, NJ: Princeton University Press, 2014).Return to reference 21
Cristina Mora, Making Hispanics: How Activists, Bureaucrats, and Media Constructed a New American (Chicago: University of Chicago Press, 2014); Carter et al., Historical Statistics of the United States, Table Aa145-184, Population, by Sex and Race: 1790–1990, 23.Return to reference 22
U.S. Census Bureau, “2020 Census Illuminates Racial and Ethnic Composition of the Country,” www.census.gov/library/stories/2021/08/improved-race-ethnicity-measures-reveal-united-states-population-much-more-multiracial.html#:~:text=Asian%20Population,people%20(4.8%25)%20in%202010 (accessed 3/18/22); Lauren Davenport, Politics Beyond Black and White: Biracial Identity and Attitudes in America (New York: Cambridge University Press, 2018).Return to reference 23
U.S. Census Bureau, “2020 American Community Survey, 5-Year Estimates: Selected Characteristics of the Native and Foreign-Born Populations,” https://data.census.gov/cedsci/table?y=2020&d=ACS%205-Year%20Estimates%20Subject%20Tables&tid=ACSST5Y2020.S0501 (accessed 3/18/22).Return to reference 24
U.S. Census Bureau, “2020 American Community Survey, 5-Year Estimates: Selected Characteristics of the Foreign-Born Population by Region of Birth: Latin America,” https://data.census.gov/cedsci/table?y=2020&d=ACS%205-Year%20Estimates%20Subject%20Tables&tid=ACSST5Y2020.S0506 (accessed 3/18/22).Return to reference 25
U.S. Census Bureau, “2020 American Community Survey, 5-Year Estimates: Selected Characteristics of the Foreign-Born Population by Region of Birth: Asia,” https://data.census.gov/cedsci/table?y=2020&d=ACS%205-Year%20Estimates%20Subject%20Tables (accessed 3/18/22).Return to reference 26
U.S. Census Bureau, “2020 American Community Survey, 5-Year Estimates: Selected Characteristics of the Foreign-Born Population by Region of Birth: Europe,” https://data.census.gov/cedsci/table?y=2020&d=ACS%205-Year%20Estimates%20Subject%20Tables&tid=ACSST5Y2020.S0503 (accessed 4/10/22).Return to reference 27
Bryan Baker, “Estimates of the Illegal Alien Population Residing in the United States: January 2015,” Department of Homeland Security, December 2018, www.dhs.gov/sites/default/files/publications/18_1214_PLCY_pops-est-report.pdf (accessed 1/17/20).Return to reference 28
National Conference of State Legislatures, “Federal Benefit Eligibility for Unauthorized Immigrants,” February 24, 2014, www.ncsl.org/research/immigration/federal-benefits-to-unauthorized-immigrants.aspx (accessed 5/22/19); National Conference of State Legislatures, “Undocumented State Tuition: Overview,” March 14, 2019, www.ncsl.org/research/education/undocumented-student-tuition-overview.aspx (accessed 5/22/19).Return to reference 30
Gallup, “Religion,” https://news.gallup.com/poll/1690/religion.aspx (accessed 3/18/22).Return to reference 31
U.S. Census Bureau, “Demographic Trends in the 20th Century, Table 5: Population by Age and Sex for the United States: 1900 to 2000,” www.academia.edu/1935231/Demographic_trends_in_the_20th_century (accessed 3/18/22); U.S. Census Bureau, “2020 American Community Survey, 5-Year Estimates: Age and Sex,” https://data.census.gov/cedsci/table?y=2020&d=ACS%205-Year%20Estimates%20Subject%20Tables&tid=ACSST5Y2020.S0101 (accessed 3/19/22).Return to reference 33
World Bank, “Population Ages 65 and Above (% of Total),” http://data.worldbank.org/indicator/SP.POP.65UP.TO.ZS (accessed 3/19/22).Return to reference 34
U.S. Census Bureau, “Urban and Rural,” www.census.gov/programs-surveys/geography/guidance/geo-areas/urban-rural.html (accessed 1/25/22); Tim Henderson, “Shrinking Rural America Faces State Power Struggle,” Pew Charitable Trusts, August 10, 2021, www.pewtrusts.org/en/research-and-analysis/blogs/stateline/2021/08/10/shrinking-rural-america-faces-state-power-struggle (accessed 1/25/22).Return to reference 35
See, for example, David B. Grusky and Tamar Kricheli-Katz, eds., The New Gilded Age: The Critical Inequality Debates of Our Time (Stanford, CA: Stanford University Press, 2012).Return to reference 36
Juliana Menasce Horowitz, Ruth Igielnik, and Rakesh Kochhar, “Trends in Income and Wealth Inequality,” Pew Research Center, January 9, 2020, www.pewresearch.org/social-trends/2020/01/09/trends-in-income-and-wealth-inequality/ (accessed 9/22/21).Return to reference 37
Edward N. Wolff, “Household Wealth Trends in the United States, 1962–2016: Has Middle Class Wealth Recovered?” NBER, November 2017, www.nber.org/papers/w24085 (accessed 10/1/21).Return to reference 38
United States Federal Reserve, “Distribution of Household Wealth in the U.S. since 1989,” www.federalreserve.gov/releases/z1/dataviz/dfa/distribute/table/ (accessed 3/19/22); Alexandre Tanzi and Mike Dorning, “Top 1% of U.S. Earners Now Hold More Wealth Than All of the Middle Class,” Bloomberg Wealth, October 8, 2021, www.bloomberg.com/news/articles/2021-10-08/top-1-earners-hold-more-wealth-than-the-u-s-middle-class (accessed 3/19/22).Return to reference 39
U.S. Census Bureau, “Income and Poverty in the United States: 2020,” September 14, 2021, www.census.gov/library/publications/2021/demo/p60-273.html (accessed 3/19/22).Return to reference 40
Neil Bhutta et al., “Disparities in Wealth by Race and Ethnicity in the 2019 Survey of Consumer Finances,” September 20, 2020, Board of Governors of the Federal Reserve System, www.federalreserve.gov/econres/notes/feds-notes/disparities-in-wealth-by-race-and-ethnicity-in-the-2019-survey-of-consumer-finances-20200928.htm (accessed 10/1/21); Emily Moss et al., “Black-White Wealth Gap Left Black Households More Vulnerable,” December 8, 2020, The Brookings Institution, www.brookings.edu/blog/up-front/2020/12/08/the-black-white-wealth-gap-left-black-households-more-vulnerable/ (accessed 10/1/21); Heather Long and Andrew Van Dam, “The Black-White Economic Divide Is as Wide as It Was in 1968,” Washington Post, June 4, 2020, www.washingtonpost.com/business/2020/06/04/economic-divide-black-households/ (accessed 10/1/21).Return to reference 41
Jesse Sussell and James A. Thomson, “Are Changing Constituencies Driving Rising Polarization in the U.S. House of Representatives?” RAND Corporation Research Report RR-396-RC, 2015, www.rand.org/pubs/research_reports/RR896.html (accessed 1/15/18); Richard Florida, “How the 1 Percent Is Pulling America’s Cities and Regions Apart,” Bloomberg City Lab, April 3, 2019, www.bloomberg.com/news/articles/2019-04-03/mapping-america-s-growing-economic-inequality (accessed 9/20/21).Return to reference 42