7.4 Equilibrium and Reaction Rates, Thermodynamics and Kinetics
In the following discussion, be careful to keep in mind the distinction between the overall equilibrium between starting material and products, which is determined by the ΔG between them, and the rate of the reaction, which is determined by the height of the transition state separating them. We will take up equilibrium first and then move on to consider the transition state.
7.4a Equilibrium For a general chemical reaction at equilibrium,

the concentrations of the species on the two sides of the arrows are related to each other by an equilibrium constant, K:

or, more familiarly,
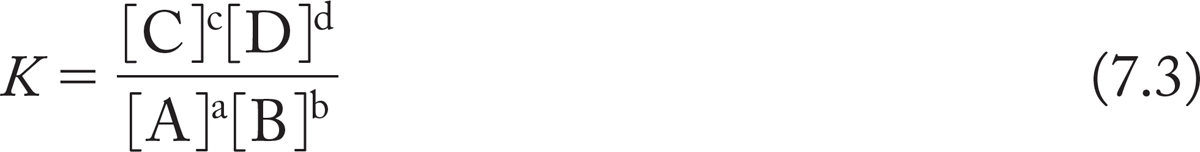
The lowercase superscripts are the coefficients in the balanced equation for the reaction [Eq. (7.1) in this case], and the uppercase letters enclosed in brackets represent the molar concentrations of the products and reactants at equilibrium. The concepts of starting materials and products are arbitrary ones, arising from practical considerations—we generally are interested in making the reaction run one way or the other, and by convention the desired reaction is written left to right. But it need not be; it is just as valid to look at the reaction in the other direction.
A reaction is a successful one if the compounds we seek, the products, are strongly favored at equilibrium. So we are very interested in what determines the magnitude of the equilibrium constant (K): the difference in the free energies (ΔG° = ΔH° −TΔS°; see later for a more detailed discussion) of the compounds involved in the reaction. The exact relationship between K and the relative free energies of the starting materials and products is shown in Equation (7.4):

or, if we want to use base 10 rather than natural logarithms,

In this equation, R is the gas constant, 1.986 × 10⁻³ kcal/deg·mol (or 8.31 × 10⁻³ kJ/deg·mol), T is the absolute temperature, and ΔG°, the Gibbs free energy change, is the difference in energy between starting materials and products in their standard states (Figs. 7.10 and 7.11).
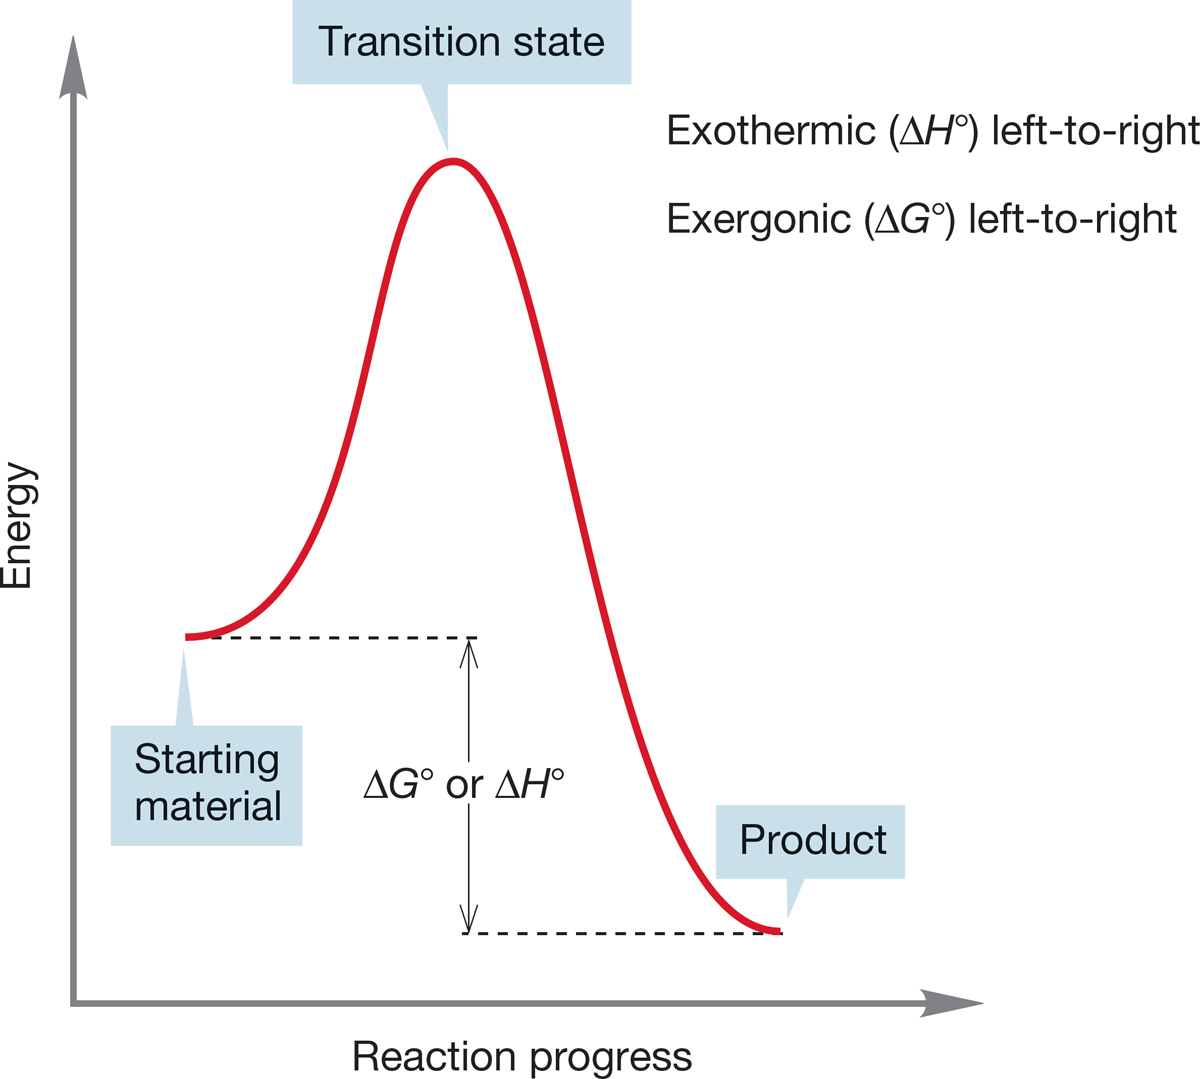
FIGURE 7.10 An exothermic (exergonic) reaction.
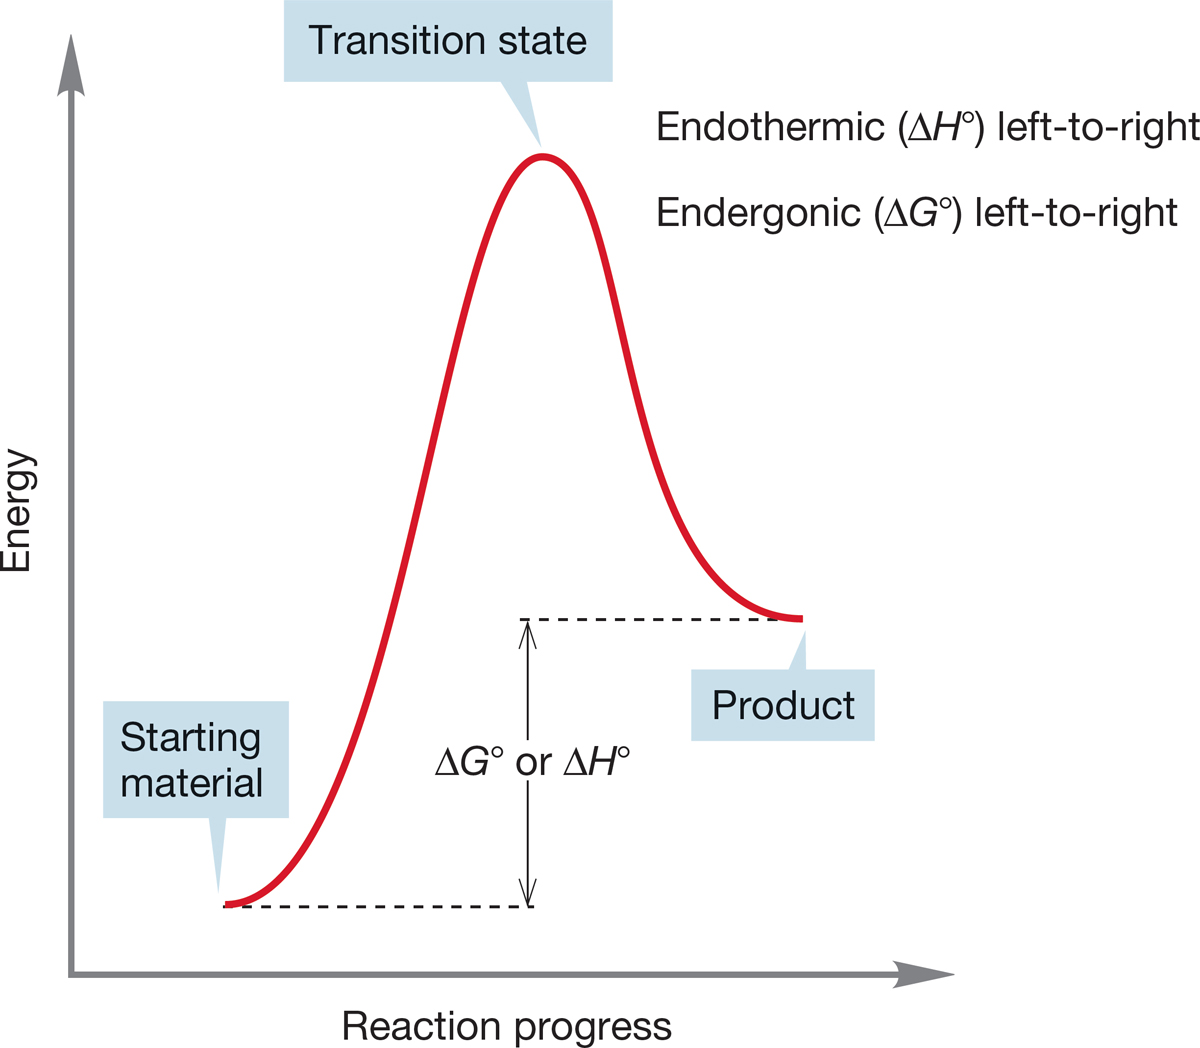
FIGURE 7.11 An endothermic (endergonic) reaction.
Up to now, we have more or less equated energy with H°, the enthalpy. The enthalpy change ΔH°, or the heat of reaction, is a measure of the bond energy changes in a reaction. The Gibbs free energy (ΔG°) is more complicated than this, as we will see in Section 7.4b, and includes not only ΔH° but entropy change (ΔS°) as well. The entropy of a reaction is a measure of the change in amount of order in starting materials and products. The higher the degree of ordering of reactants necessary, the greater are the energy requirements for the reaction. Conversely, an increase in disorder will require less energy for the reaction.
Figures 7.10 and 7.11 show an exothermic reaction (products more stable than starting materials) and an endothermic reaction (starting materials more stable than products).
The terms exothermic and endothermic really refer to the enthalpy change, ΔH°, which may or may not be in the same direction as the free energy change, ΔG°, which involves entropy, ΔS°, as well as enthalpy, ΔH°. If we really mean free energy, ΔG°, the proper terms are exergonic and endergonic.
For an exothermic reaction, the difference in enthalpy between products and starting materials is negative and the equilibrium constant (K) is >1. For an endothermic reaction (read the first reaction backward to produce an endothermic process), the enthalpy difference is positive and K is <1.
More stable products are favored at equilibrium. By how much? Note that the relationship between the difference in free energy between starting material and products (ΔG°) and the equilibrium constant K is logarithmic. We can rewrite Equations (7.4) and (7.5) to emphasize that point:

or, in base 10,

These equations show that a small difference in energy between starting materials and products results in a large excess of one over the other at equilibrium. Let’s do a few calculations to show this. First, let’s take a case in which products are more stable than starting materials by the seemingly tiny amount of 1 kcal/mol (~4.2 kJ/mol), ΔG° = −1 kcal/mol,2 so K = 101/(1.364) = 100.7331 = 5.4.
An equilibrium constant of 5.4 translates into 84.4% product at equilibrium. We would very often be quite happy to find a reaction that gives about 85% product, and a mere 1 kcal/mol suffices to ensure this. Conversely, if we are “fighting” an endothermic process of 1 kcal/mol, it is a futile fight indeed because equilibrium will settle out at 84.4% starting material. A little bit of energy goes a long way at equilibrium. Table 7.1 summarizes several similar calculations.
TABLE 7.1 The Relationship between ΔG° and K at 25°C
ΔG°, kcal/mol (kJ/mol) |
K |
Equilibrium Ratio |
−0.1 (−0.418) |
1.2 |
54.5/45.5 |
−0.5 (−2.09) |
2.3 |
69.7/30.3 |
−1 (−4.18) |
5.4 |
84.4/15.6 |
−2 (−8.36) |
29.3 |
96.7/3.3 |
−5 (−20.9) |
4631 |
99.98/0.02 |
−10 (−41.8) |
2.1 × 10⁷ |
99.999996/0.000004 |
PROBLEM 7.5 Calculate the energy difference (ΔG°) between starting material and products at 25°C given equilibrium constants (K) of 7 and 14.
In practice, we can often do something to drive a reaction in the direction we want. Le Châtelier’s principle3 states that a system at equilibrium responds to stress in such a way as to relieve that stress. This statement means that if we increase the concentration of one of the starting materials, an equilibrium process will be driven toward products. In Equations (7.1)–(7.3), if we increase [A]a, the quantity [C]c[D]d/[B]b must also increase to maintain K, and we will have more product. Similarly, if we can remove one product as it is formed, the equilibrium will be driven toward products. Perhaps either C or D is a solid that crystallizes out of solution or is a gas that can be driven off. As the concentration of this compound drops, the equilibrium will be disturbed and more C or D will be formed.
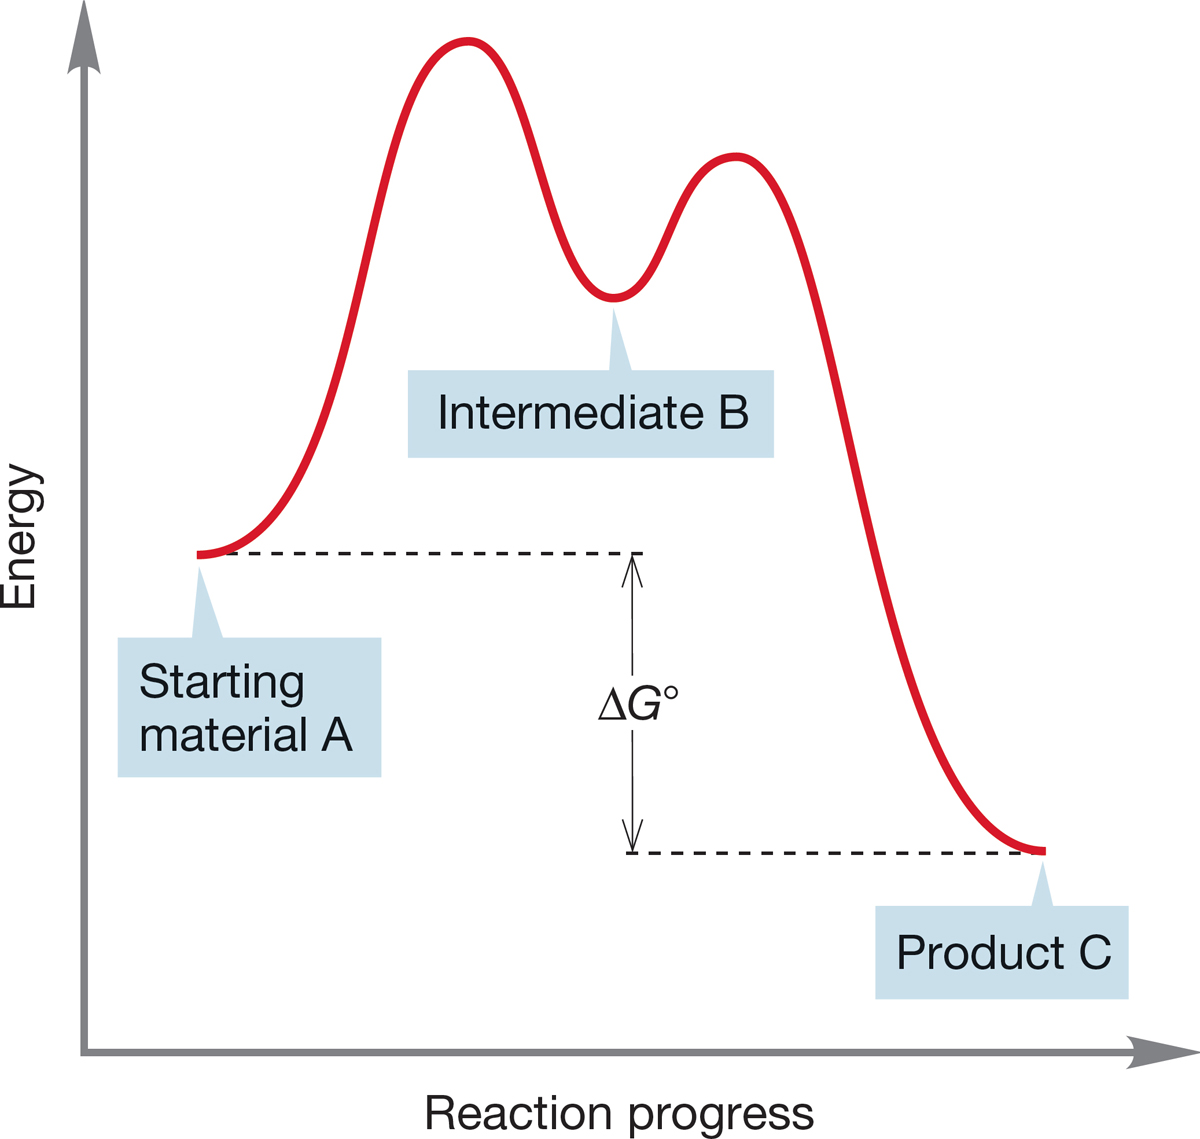
FIGURE 7.12 As long as equilibrium is reached between A and B, it does not matter that formation of B from A is endergonic; compound C will be the major product.
In a multistep reaction, it often does not matter that an early step involves an unfavorable equilibrium, as long as the overall reaction is exergonic. As long as all barriers can be traversed, the ratio of C and A is governed by the ΔG° between C and A. So, A→B may be endergonic, but, overall, A→C is exergonic (ΔG° < 0). Figure 7.12 shows such a process for the conversion of A into C via an intermediate B.
As long as some B is present in equilibrium with starting material A, the reaction will be successful. As the equilibrium A⇄B is established, B is converted into the much more stable final product C. As the small amount of B present in equilibrium with A is depleted, the A⇄B equilibrium is reestablished, and more B is formed from A. In the long run, A is largely converted into C, and as long as there is enough energy to reach the intermediate B, the final mixture of A and C depends on the ΔG° between these two compounds.
7.4b Entropy in Organic Reactions The parameter ΔG° is composed of enthalpy (ΔH°, the change in bond strengths in the reaction) and entropy (ΔS°, the change in freedom of motion in the reaction). The exact relationship is shown in Equation (7.6),

where T is the absolute temperature. We can make rather accurate estimates of the ΔH° term by knowing the bond dissociation energies for a variety of bonds. We know a few of these values already from our discussion of alkanes. Table 7.2 gives several more.
TABLE 7.2 Some Homolytic Bond Dissociation Energies
Bond |
BDE, kcal/mol (kJ/mol) |
Bond |
BDE, kcal/mol (kJ/mol) |
I―I |
36.1 (151) |
H―CH2CH3 |
101.1 (423) |
Br―Br |
46.1 (193) |
H―CH(CH3)2 |
98.6 (413) |
Cl―Cl |
59.0 (247) |
H―C(CH3)3 |
96.5 (404) |
F―F |
38.0 (159) |
I―CH3 |
57.6 (241) |
HO―OH |
51 (214) |
Br―CH3 |
72.1 (302) |
(CH3)3CO―OC(CH3)3 |
38 (159) |
Cl―CH3 |
83.7 (350) |
H―H |
104.2 (436) |
F―CH3 |
115 (482) |
H―I |
71.3 (299) |
HO―CH3 |
92.1 (386) |
H―Br |
87.5 (366) |
CH3O―CH3 |
83.2 (348) |
H―Cl |
103.2 (432) |
H2N―CH3 |
85.2 (357) |
H―F |
136.3 (571) |
H3C―CH3 |
90.1 (377) |
H―OH |
118.8 (497) |
H3C―CH2CH3 |
89.0 (373) |
H―OCH3 |
104.6 (438) |
H2C |
66 (276) |
H―NH2 |
107.6 (450) |
H2C |
174.1 (729) |
H―CH3 |
105.0 (440) |
HC H2C |
230.7 (966) 178.8 (749) |
 CH2 (π bond only)
 CH (total)
BDE, bond dissociation energy.
PROBLEM 7.6 Estimate the ΔH° for the following reactions:
(a) H―Br + CH3CH  CH2 → CH3CHBrCH3
(b) H―OH + CH3CH CH2 → CH3CHOHCH3
(c) H―F + CH3CH CH2 → CH3CHFCH3
(d) H―Cl + CH3CH CH2 → CH3CHClCH3
PROBLEM 7.7 The bond dissociation energies for the carbon–hydrogen bonds in Table 7.2 show a steady decline as the breaking carbon–hydrogen bond becomes more substituted. What can you infer from these data about the stability of the neutral species, R·, called “free radicals”?
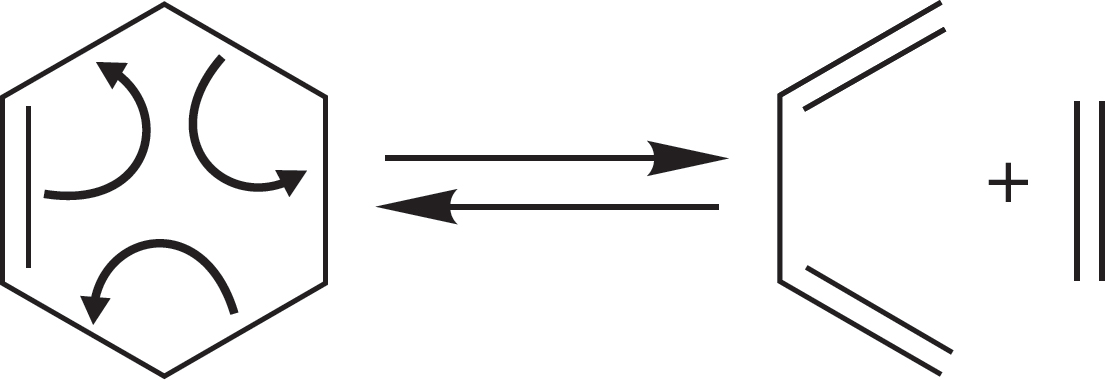
FIGURE 7.13 This reaction is a process in which one direction is favored by enthalpy and the other by entropy. Although ΔH° favors formation of cyclohexene, at very high temperature the formation of two compounds from one can drive this reaction to the right.
The entropy term (ΔS°) is related to freedom of movement. The more restricted or “ordered” the product(s) of a reaction, the more negative is the entropy change in the reaction. Because the negative of ΔS° is related to ΔG° [Eq. (7.6)], the more negative the entropy change, the higher is the free energy change (ΔG°) of the reaction. Note also that the entropy term is temperature dependent. Entropy becomes more important at high temperature. Imagine the reaction in Figure 7.13, in which strong carbon–carbon σ bonds are broken and weaker carbon–carbon π bonds are made (Table 7.2). The ΔH° term will surely favor the left-hand side. At the same time, one molecule is made into two other, smaller molecules, and this change will be favored by the entropy change, ΔS°. This reaction, in which entropy change favors the right-hand side, can be driven to the right by using a high temperature, at which the TΔS° term is large. An unfavorable reaction can even become favorable at high temperature, where the entropy term becomes more important in determining the value of ΔG°.
WORKED PROBLEM 7.8 Use ΔH° values from Table 7.2, as well as the value for the BDE of H3C―CH2CH CH2 → H3C ⋅⋅ CH2CH CH2 of 80 kcal/mol (335 kJ/mol), to estimate ΔH° for the reaction in Figure 7.13.
ANSWER Compare the bonds that are breaking with those that are being made. Two carbon–carbon single bonds are broken. As the problem says, each is worth 80 kcal/mol (335 kJ/mol). In addition, a π bond worth 66 kcal/mol (276 kJ/mol) is broken in the reaction. So, the bonds broken are worth a total of 226 kcal/mol (946 kJ/mol). Three π bonds are made, each worth 66 kcal/mol, for a total of 198 kcal/mol (829 kJ/mol). The left-to-right reaction is endothermic by about 28 kcal/mol (117 kJ/mol) because the bonds made are weaker than those broken.
2 × C―C = +160 kcal/mol (bonds broken)
C C (π) = +66 kcal/mol (bond broken)
3 × C C (π) = −198 kcal/mol (bonds made)
ΔH° = +28 kcal/mol
Summary
Now we know something of the factors that affect equilibrium. Enthalpy change, ΔH, is important. Basically, the side of the equilibrium with the stronger bonds is favored by enthalpy. Also important is the temperature-dependent entropy change term, ΔS. The two terms may act in concert or oppose each other. In the substitution reaction, the better nucleophile will “win” the competition and produce the compound we traditionally call “product.” Recognize, however, that this designation is arbitrary; one person’s product can be another’s starting material.
7.4c Rates of Chemical Reactions Just because a reaction is exothermic does not mean that it is a rapid reaction or even that it proceeds at all under normal conditions. First of all, an exothermic reaction can be endergonic if entropy plays an especially important role. Entropy does not raise its ugly head in this way often, but there is another, much more frequently encountered reason why an exergonic reaction might not be a fast reaction. As we have seen, energy barriers to chemical reactions occur. In principle, a very stable product can be separated from a much less stable starting material by a barrier high enough to stop all reaction (Fig. 7.14).
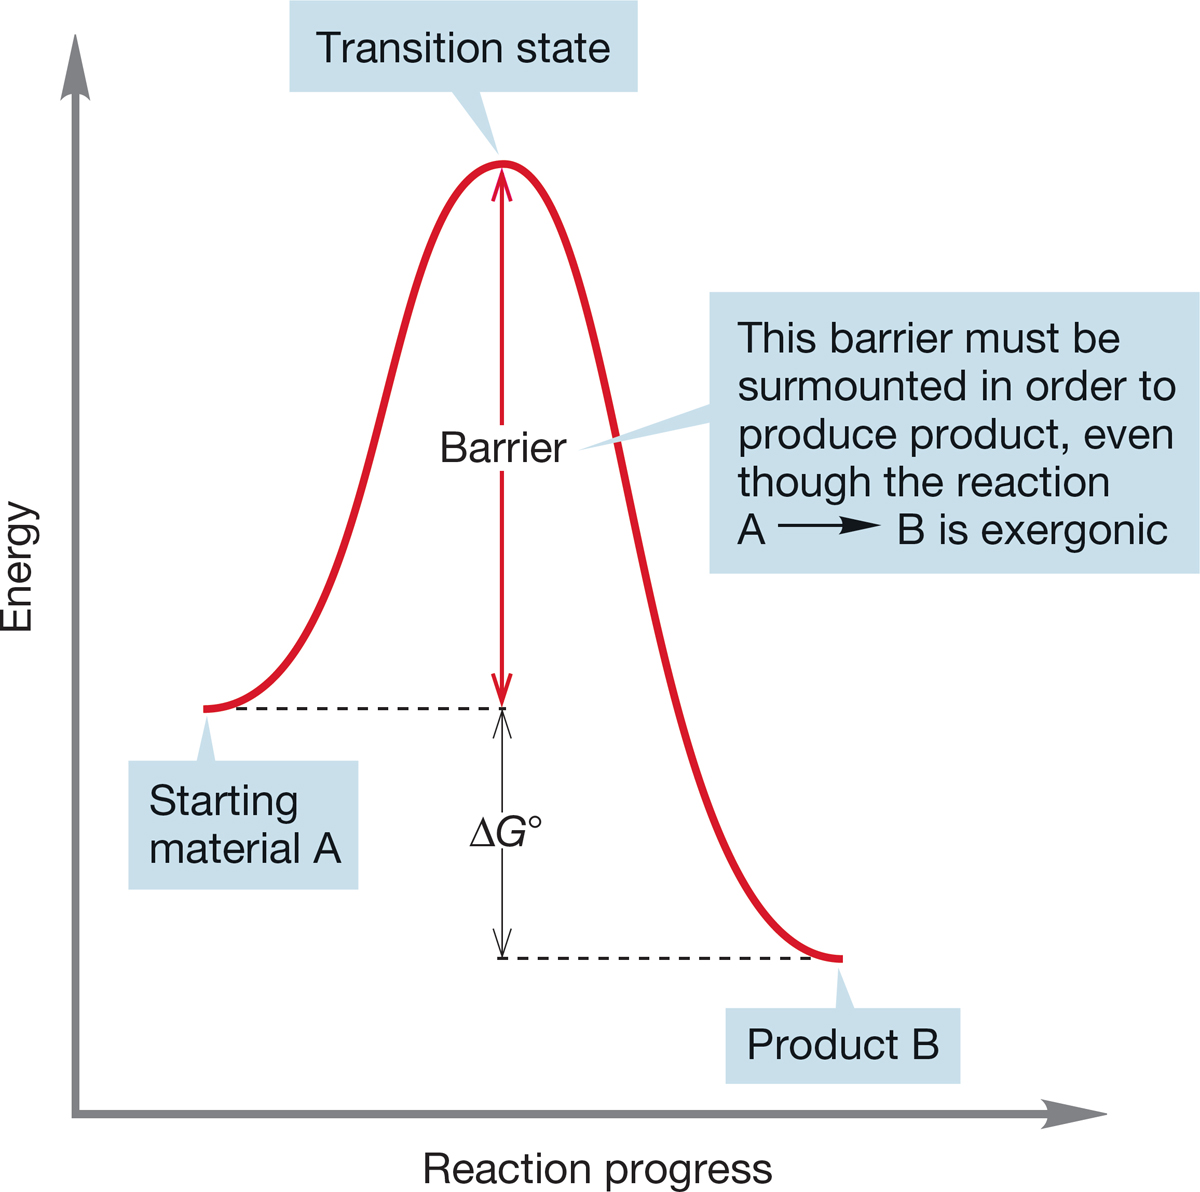
FIGURE 7.14 Rates of reactions are determined not by the ΔG° between starting material and product, but by the height of the energy barrier separating starting material from product. Some very unstable materials are protected by high barriers and thus can be isolated.
PROBLEM SOLVING
Whenever you see the word rate in a problem or when you see words such as faster that talk about rates, you are very likely to have to answer the question by drawing the transition state for the reaction. Remember that the rate of a reaction is determined by ΔG ‡, the energy difference between starting material and the transition state, and not by the energy difference between starting material and product. You need a pull-down menu that says, “Think about the transition state” when the word rate appears in a problem.
At a given temperature, collections of molecules exist in ranges of energies called Boltzmann distributions. In a Boltzmann distribution, the energies of most molecules cluster about an average value. As energy is provided to the molecules, usually through the application of heat, the average energy increases. Although there is always a small number of highly energetic molecules present (the high-energy tail of the Boltzmann distribution), in practice there may not be enough molecules of sufficient energy to make the reaction proceed at an observable rate if the barrier is high enough. The application of energy in the form of heat produces more molecules with sufficient energy to traverse the barrier (Fig. 7.15). A reaction rate approximately doubles for every increase in temperature of 10°C.
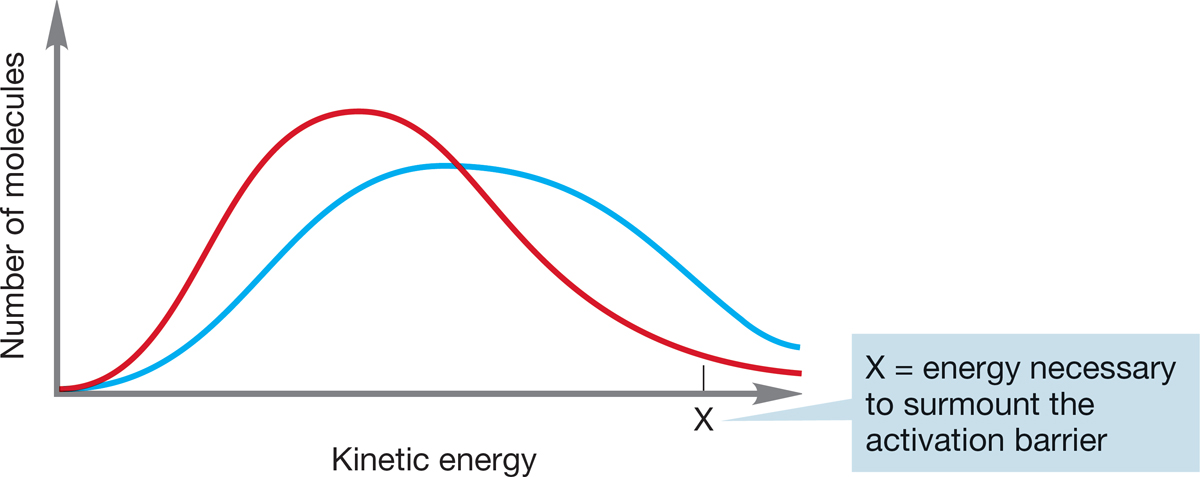
FIGURE 7.15 Boltzmann distributions of molecules at two temperatures. The blue line is the distribution at higher temperature, and the red line is the distribution at lower temperature.
Rates of chemical reactions also depend on the concentrations of reactants. The rates of most organic reactions depend either on the concentration of only a single reactant (SN1, Section 7.7) and thus are first-order reactions or on the concentrations of two species (SN2, Section 7.5) and are second-order reactions (Fig. 7.16). There are examples of higher-order reactions, but they are relatively rare.
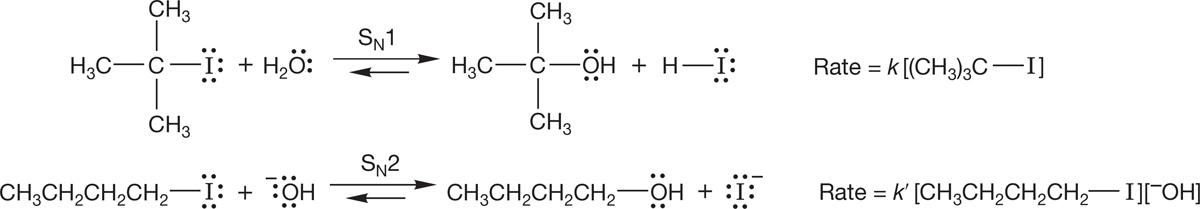
FIGURE 7.16 Rate laws for the SN1 and SN2 reactions. Note that k and k′ are different.
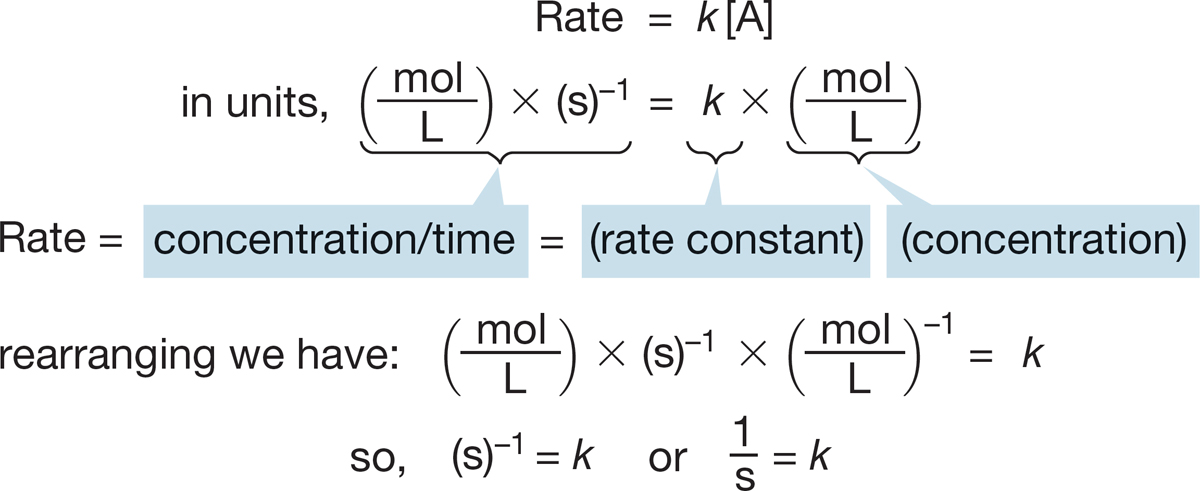
FIGURE 7.17 For a first-order reaction, the rate constant (k) has the units of time−1 = s−1.
7.4d Rate Constant In the rate laws mentioned so far, there has always been a proportionality constant, called the rate constant (k), which is a fundamental property of any given chemical reaction. A rate must have the units of concentration per unit time, often moles per liter per second. For a first-order process such as the SN1 reaction, the rate constant k must have the units of reciprocal seconds (s−1) (if we use the second as our time unit, Fig. 7.17).
For a second-order reaction, k must have units of reciprocal moles per liter per second [(mol/L)−1·s−1] (Fig. 7.18).
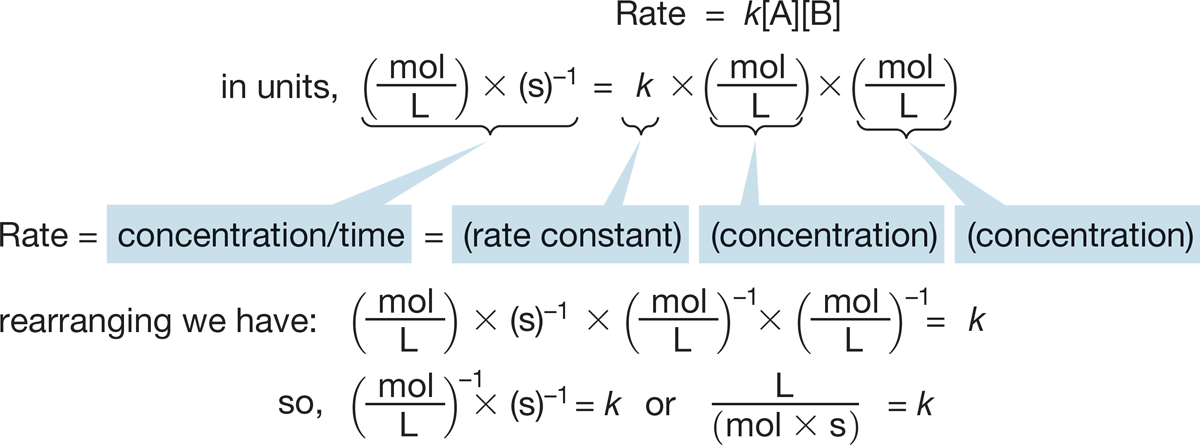
FIGURE 7.18 For a second-order reaction, the rate constant (k) has the units of (mol/L)−1 ∙ s−1.
We can determine the value of k by measuring how the reaction rate varies with the concentration(s) of the reactants.
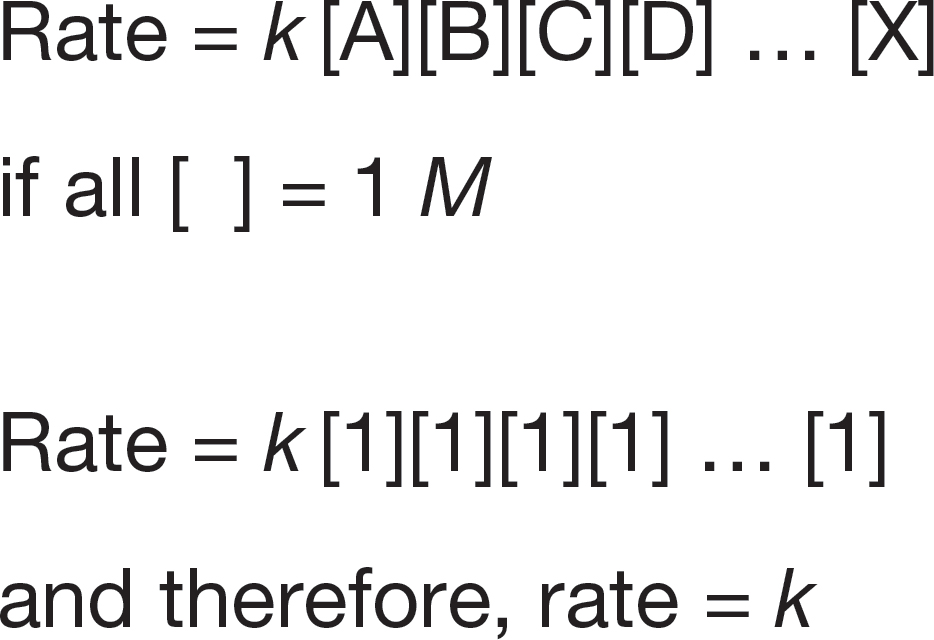
FIGURE 7.19 If the concentrations of the reactants are all 1 M, the rate constant and the rate are the same.
It is easy to confuse the rate of a reaction, which is simply how fast the concentrations of the reactants are changing, with the rate constant, which tells us how the rate will change as a function of reactant concentration. The rate of a reaction varies with concentration. This variation is easy to see by imagining the limiting case in which one reactant is used up. When its concentration goes to zero, the reaction rate must also be zero. In contrast, the rate constant is an intrinsic property of the reaction. It varies with temperature, pressure, and solvent but does not depend on the concentrations of reactants.
Only when the concentrations of all reactants are 1 M are the rate and the rate constant the same. The rate constant is thus a measure of the rate under standard conditions (Fig. 7.19).
CONVENTION ALERT
Activation Energy
7.4e Energy Barriers in Chemical Reactions: The Transition State and Activation Energy We have already mentioned that even exothermic reactions may be very slow―indeed, immeasurably slow. And it’s a good thing. Combustion is a very exothermic chemical reaction, and yet we and our surroundings exist more or less tranquilly in air without bursting into flame. Somehow we are protected by an energy barrier. For example, methane and oxygen do not react unless activation energy (p. 140) is supplied. If we are considering free energy, the activation energy is ΔG ‡; if we are speaking of enthalpy, the activation energy is ΔH ‡. The double dagger (‡) is always used when we are referring to activation parameters involving the energy of a transition state. A match will suffice to provide the energy in our methane plus oxygen example. This highly exothermic process (p. 95) then provides its own energy as very stable molecules are produced from less stable ones (Fig. 7.20).
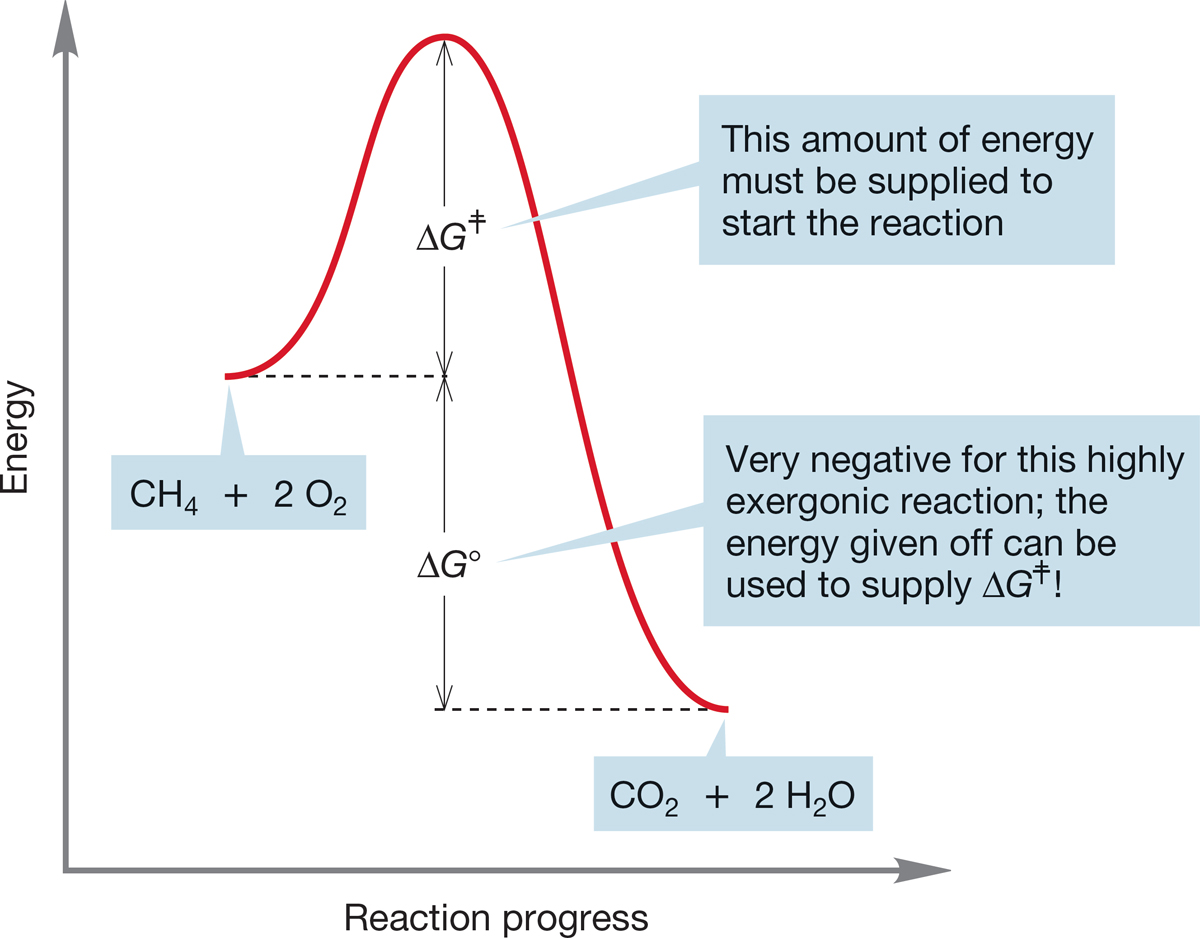
FIGURE 7.20 An exergonic reaction can provide the energy necessary to pass over an activation barrier. Once such a reaction is started, it continues until one reactant is used up.
PROBLEM 7.9 Show the formula, using ΔG° and ΔG ‡, that represents the activation energy for the reverse reaction in Figure 7.20; that is, the formation of methane and oxygen from carbon dioxide and water.
We are protected from spontaneous combustion in the same way we are protected from hungry bears and tigers during a visit to the zoo. At the zoo, the barrier is tangible and operates in a clear way to ensure our survival. Activation barriers are less visible but no less necessary for the continuance of our lives. In this important section, we will discuss these energy barriers to chemical reactions.
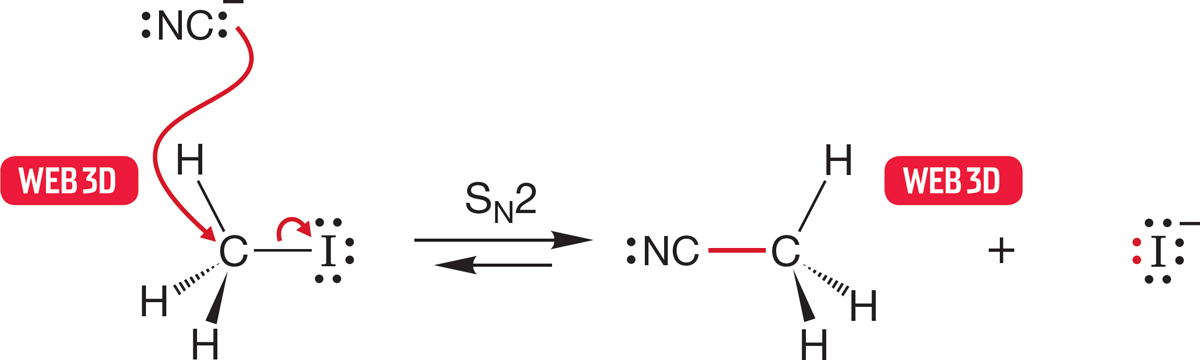
FIGURE 7.21 The transition state for the SN2 reaction has severe ordering requirements. Attack of the nucleophile must be from the rear for the reaction to succeed.
In the SN2 reaction, the bond from carbon to the leaving group must break, but this energy cost is partially offset by the formation of the bond from carbon to the entering nucleophile. We might imagine that there must be a substantial entropy cost in this reaction, as we must order the reactants in a special way for the reaction to proceed. The SN2 reaction can occur only if the nucleophile attacks from the rear of the departing leaving group, and this requirement demands a specific arrangement of the molecules and ions involved in the reaction (Fig. 7.21).
We can follow the course of both forward and reverse reactions in diagrams that plot energy versus reaction progress. We usually don’t specify reaction progress in detail because there are many possible measures of this quantity, and for this kind of qualitative discussion it doesn’t much matter which we pick. In the SN2 reaction, for example, we might choose to plot energy versus the length of the bond between carbon and the leaving group (which increases in the reaction) or the length of the bond between carbon and the nucleophile (which decreases through much of the process). The overall picture is the same.
If we have enough energy for molecules to reach the transition state and cross the barrier in reasonable numbers, the reaction will run at a reasonable rate, and the final mixture of starting materials and products will depend on the ΔG° between starting materials and products. Figure 7.22 shows a diagram for the exothermic formation of methyl cyanide (CH3CN) and potassium iodide (KI) from methyl iodide (CH3I) and potassium cyanide (KCN). The activation energy is the height of the transition state above the starting material. As there is enough energy to pass over the transition state in both directions, the ratio of product and starting material depends on ΔG°, the difference in free energy between starting material and product. The reaction shown in Figure 7.22 has a negative ΔG° and will be successful in producing product.
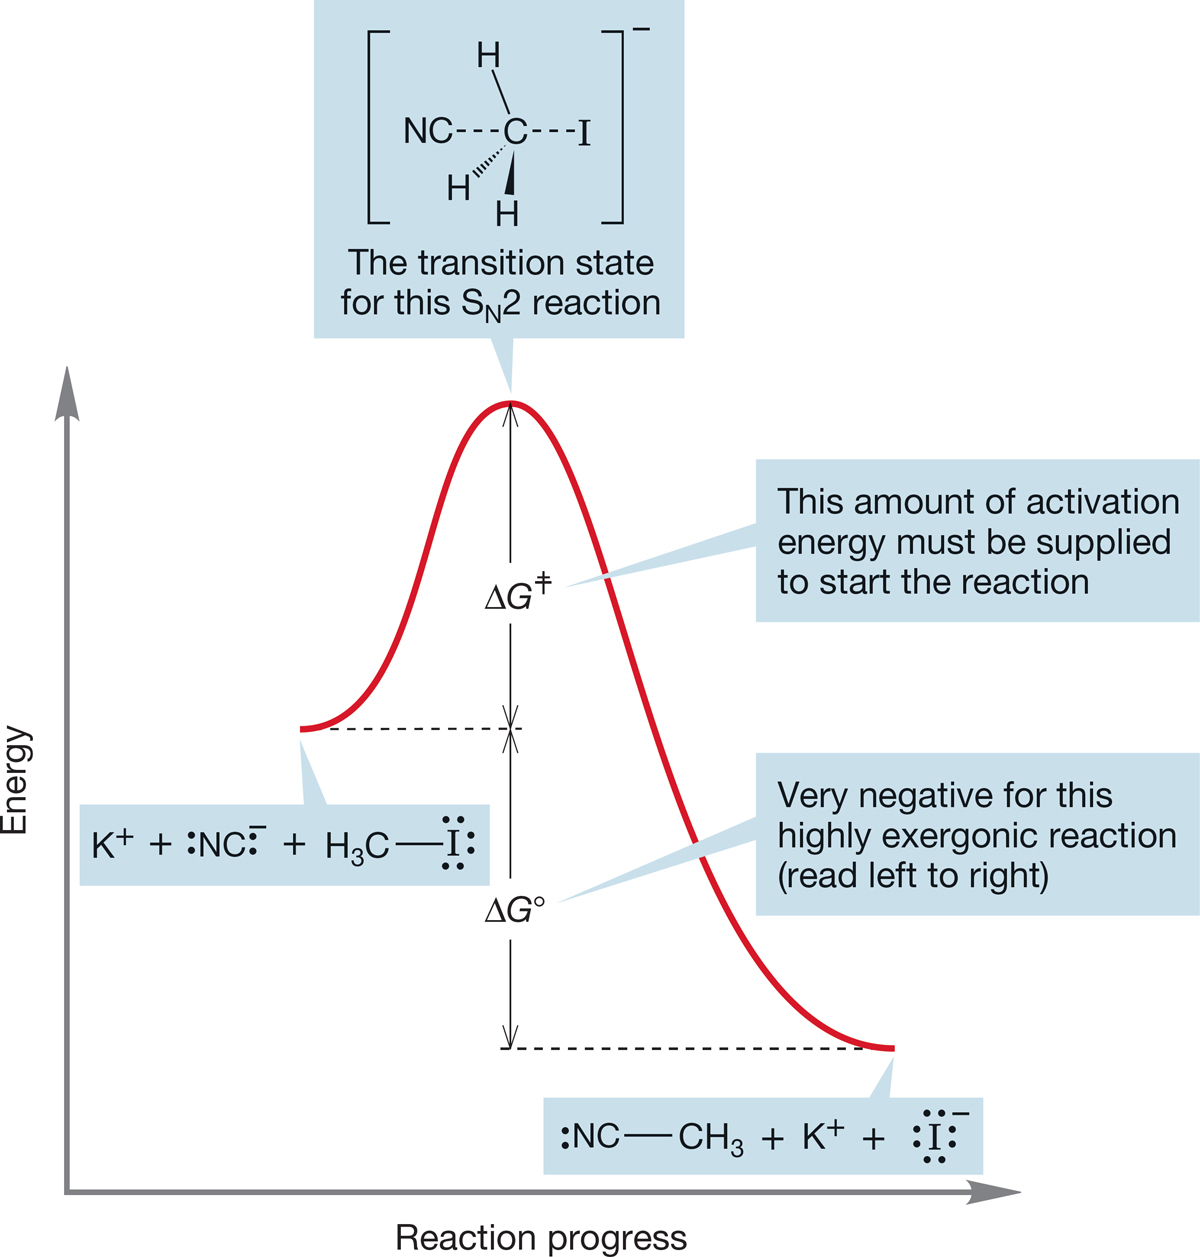
FIGURE 7.22 An energy diagram for the SN2 displacement of iodide by cyanide (and its reverse reaction, the much less favorable displacement of the strong nucleophile cyanide by iodide). The activation energy for the exergonic displacement of iodide is shown.
In Figure 7.23, this same reaction is considered from the reverse point of view: the endothermic formation of methyl iodide from methyl cyanide and iodide ion. The activation energy ΔG ‡ is much higher than for the forward reaction, and ΔG° is positive for the endergonic formation of methyl iodide. The transition state is exactly the same as that for the forward reaction. This reaction is not very successful. It not only requires overcoming a high activation energy but also is “fighting” an unfavorable equilibrium because ΔG° is positive.
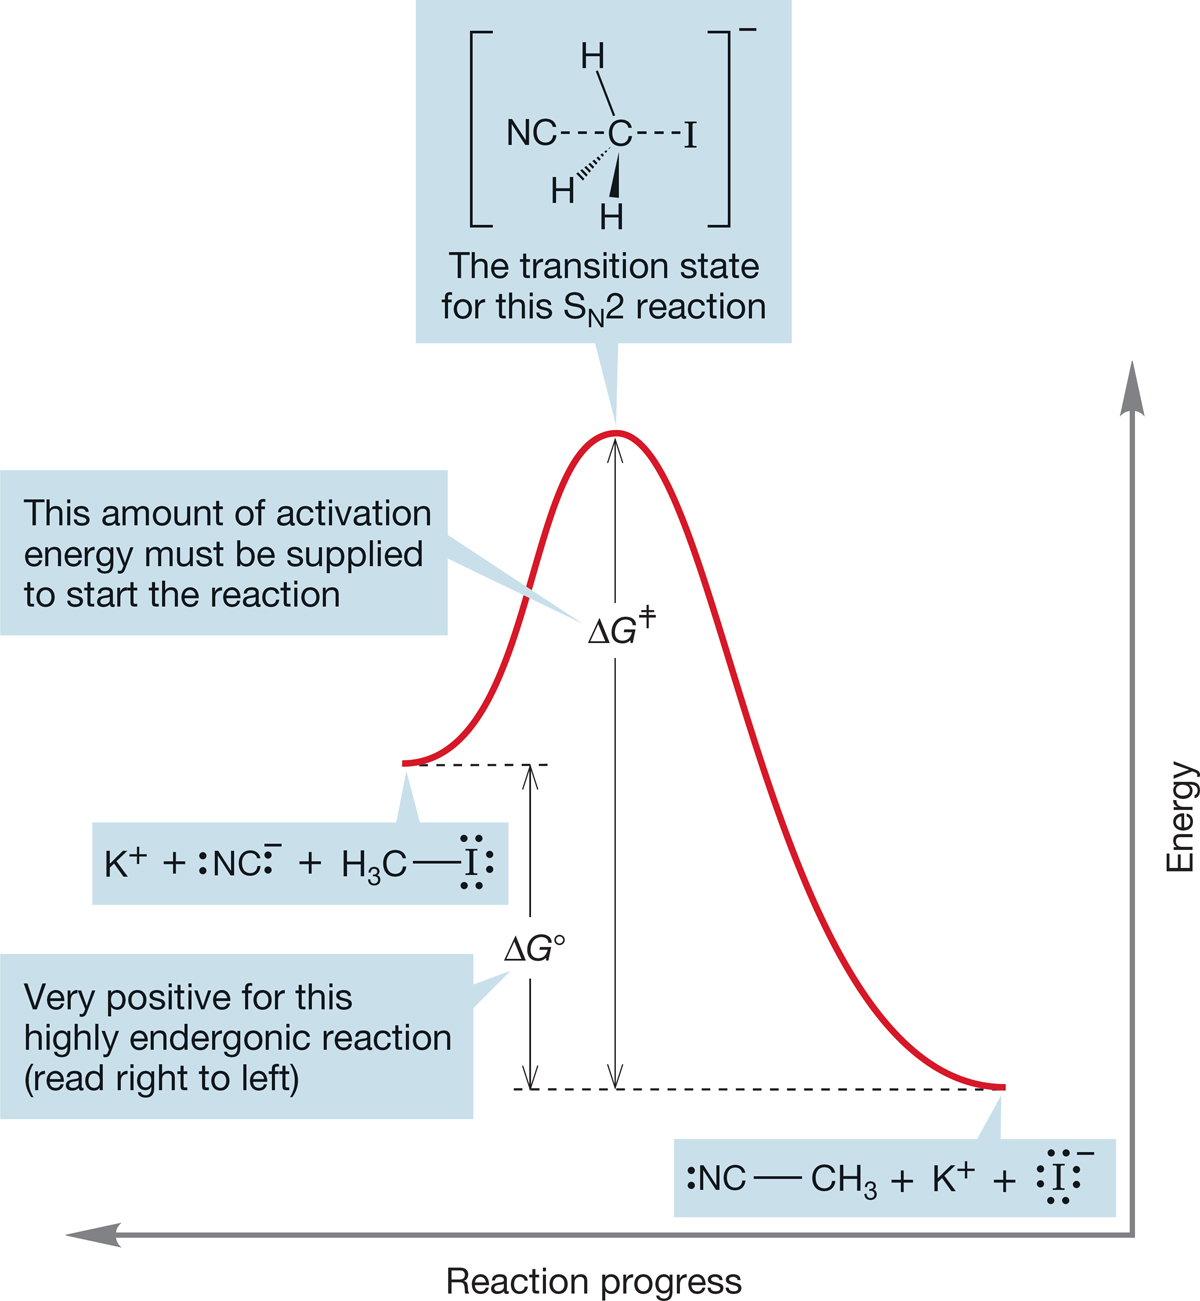
FIGURE 7.23 This energy diagram for the same reaction as shown in Figure 7.22 emphasizes the reversal. Here, the activation energy for displacement of cyanide by iodide is shown.
Of course, this separation of the two reactions is absolutely artificial—we are really describing a single equilibrium between methyl iodide and cyanide ion on one side and methyl cyanide and iodide ion on the other (Fig. 7.24).

FIGURE 7.24 The competition between cyanide and iodide for a Lewis acidic carbon.
The exergonic formation of methyl cyanide and the endergonic formation of methyl iodide are one and the same reaction. The reactions share exactly the same transition state; only the ease of reaching it is different (ΔG ‡forward < ΔG ‡reverse). The energy difference between the starting material and the product (ΔG°) is the difference between the two activation energies.
The rates of the forward and reverse reactions are determined by the magnitudes of the activation energies for the two halves of the reaction. They are intimately related to the equilibrium constant for the reaction K, determined by ΔG° [Eq. (7.7)].

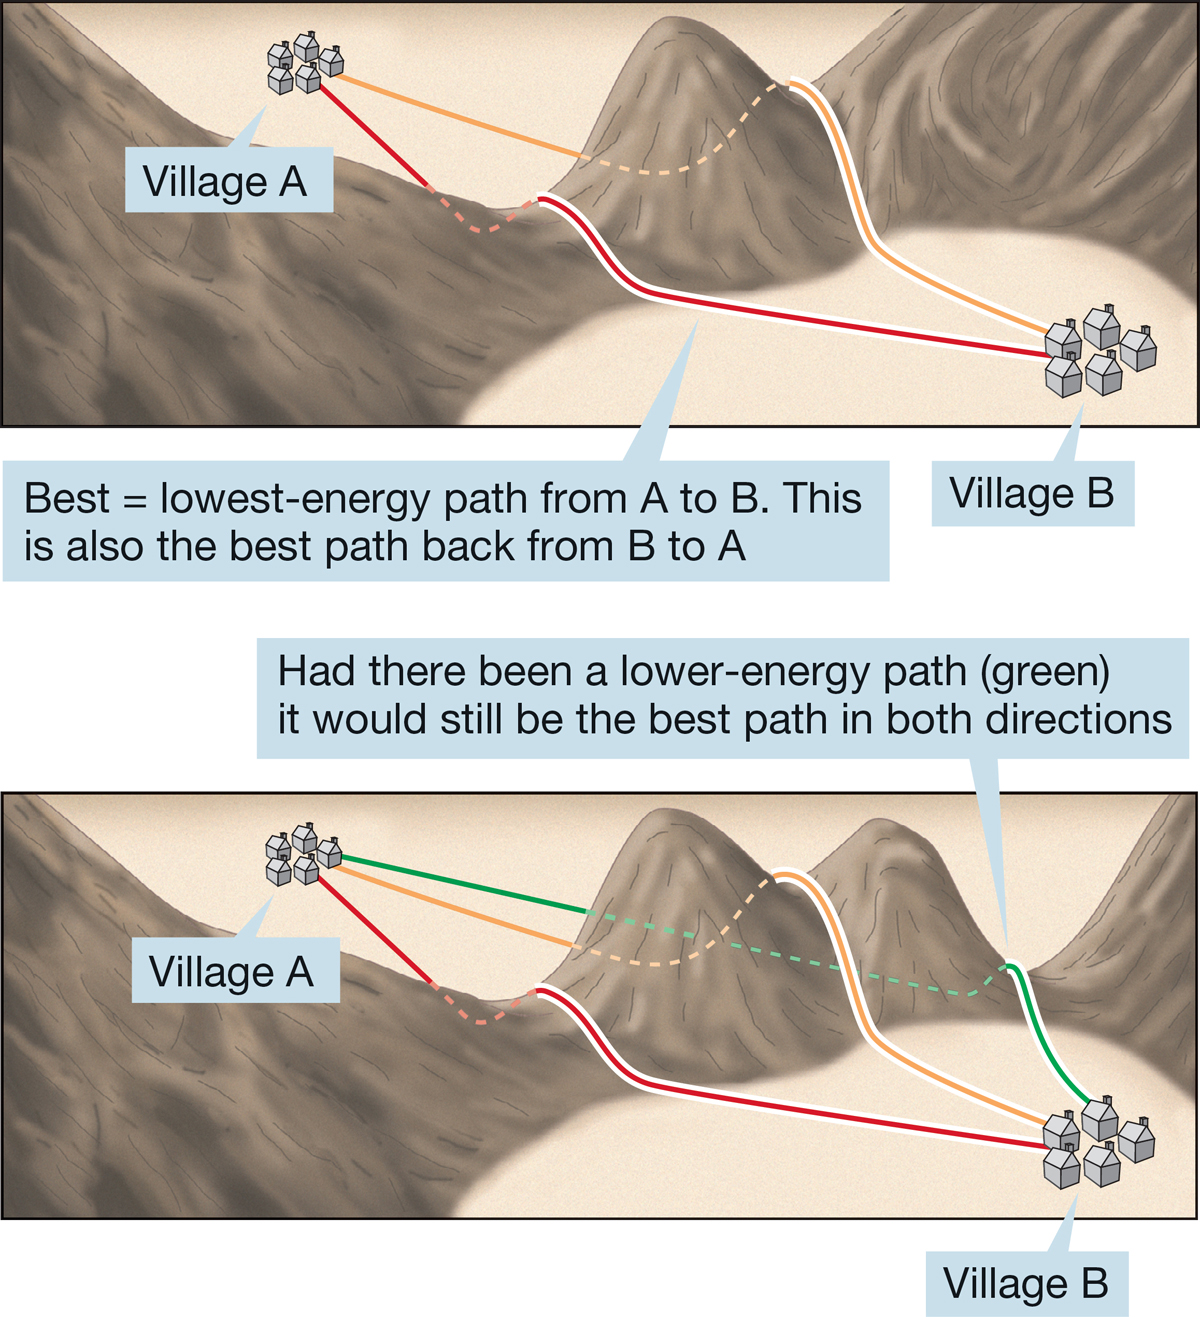
FIGURE 7.25 Molecules, unlike explorers, take the best (lowest-energy) path. You might take the red path from A to B and the orange path back, but a molecule wouldn’t.
The principle of microscopic reversibility says that if we know the mechanism of a forward reaction, we know the mechanism of the reverse reaction. One diagram suffices to tell all about both forward and reverse reactions. Figures 7.22 and 7.23 are in reality a single diagram describing both reactions, in this case one “forward” and exergonic, the other “reverse” and endergonic. There is no lower-energy route from methyl cyanide and iodide ion back to methyl iodide and cyanide ion. The lowest-energy path back is exactly the reverse of the path forward.
The classic analogy for this idea pictures the molecules as crossing a high mountain pass. The best path (lowest energy, or lowest altitude) from village A to village B is the best path (lowest energy, lowest altitude) back from village B to village A. If there were a lower-energy route back from B to A, it would have been the better route from A to B as well (Fig. 7.25).
2At 25°C, 2.3RT = 1.364 kcal/mol. This number is useful to remember because with it you can do calculations easily at odd moments without having to look up the value of R and multiply it by T.
3The principle is named for Henri Louis Le Châtelier (1850–1936). The mathematics of this principle had been worked out earlier by the American Josiah Willard Gibbs (1839–1903), who donated the “G” in Gibbs to ΔG. Le Châtelier knew of Gibbs’s contributions and was a great popularizer of Gibbs’s work.