7.5 Substitution, Nucleophilic, Bimolecular: The SN2 Reaction
Now we are prepared for a detailed look at the transition state for the SN2 reaction. The key to that analysis is an investigation of the stereochemistry of the SN2 process.
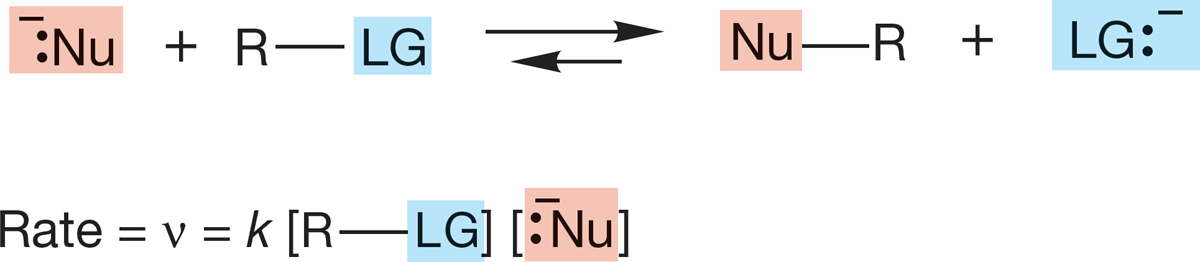
FIGURE 7.26 A bimolecular reaction.
7.5a Rate Law The rate law tells you the number and kinds of molecules involved in the transition state—it tells you how the reaction rate depends on the concentrations of reactants and products. For many substitution reactions, the rate ν is proportional to the concentrations of both the nucleophile, [Nu:−], and the substrate, [R―LG]. This bimolecular reaction is first order in Nu:− and first order in substrate, R―LG. The rate constant, k, is a fundamental constant of the reaction (Fig. 7.26). This bimolecular reaction is second order overall, which leads to the name Substitution, Nucleophilic, bimolecular, or SN2 reaction.
In discussing substitution reactions, R stands for a generic alkyl group (p. 73). Don’t confuse this R with the (R) used to specify one enantiomer of a chiral molecule.
CONVENTION ALERT The Letter “R” Stands for a Generic Alkyl Group
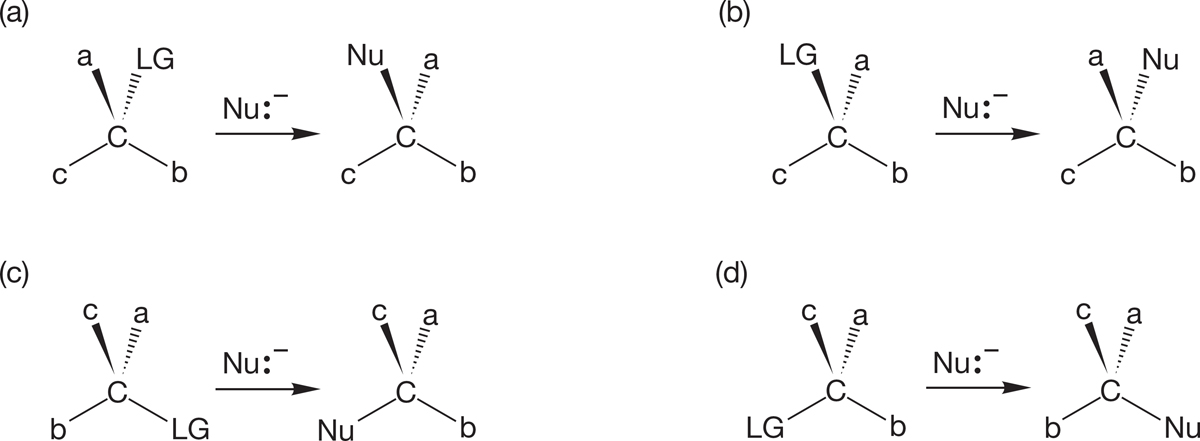
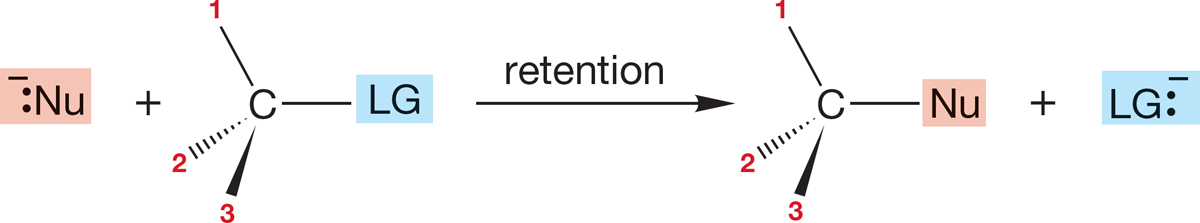
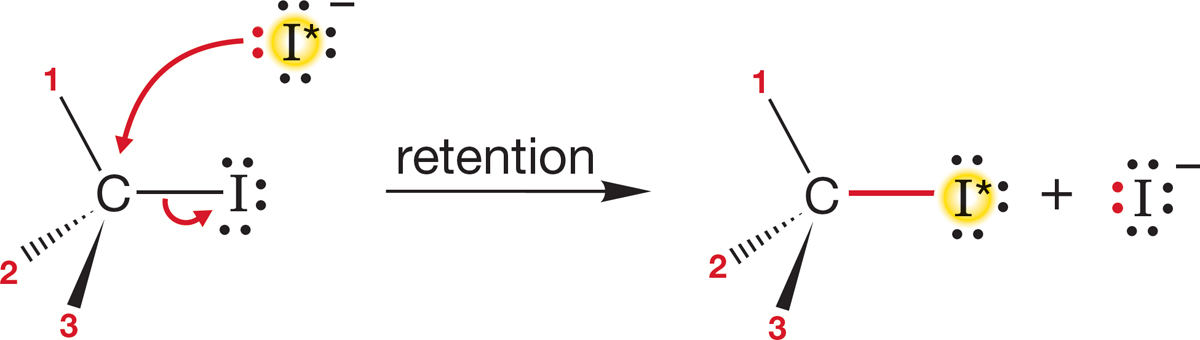
7.5b Stereochemistry of the SN2 Reaction Stereochemical analysis is one of the most powerful of all tools for investigating the mechanism of a reaction. In this case, we need first to see what’s possible and then to design an experiment that will enable us to determine the stereochemical results. If we start with a single enantiomer (Chapter 4, p. 155), (R) or (S), there are several possible outcomes of a substitution reaction. We could get retention of configuration, in which the stereochemistry of the starting molecule is preserved. The entering nucleophile occupies the same stereochemical position as did the departing leaving group, and the product has the same handedness as the starting material (Fig. 7.27).
FIGURE 7.27 One possible stereochemical outcome for the SN2 reaction. In this scenario, the product is formed with retention of configuration.
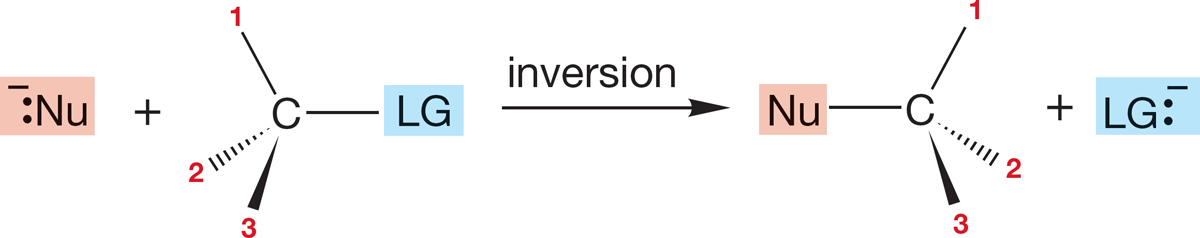
A second possibility is inversion of configuration, in which the stereochemistry of the starting material is reversed: (R) starting material going to (S) product and (S) starting material going to (R) product. In this kind of reaction, the pyramid of the starting material becomes inverted in the reaction, like an umbrella in the wind (Fig. 7.28). In this and Figure 7.27, notice how the numbers enable us to keep track of inversions and retentions.
FIGURE 7.28 Another possible stereochemical result for the SN2 reaction. The handedness of the starting material could be reversed in the product in what is called inversion of configuration.
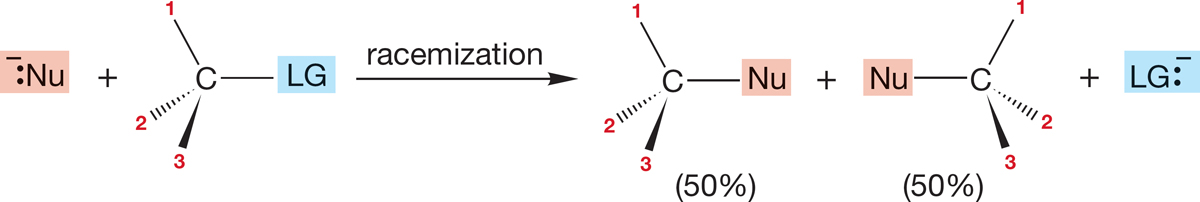
It is also possible that optical activity could be lost. In such a case, (R) or (S) starting material goes to a racemic mixture—a 50:50 mixture of (R) and (S) product (Fig. 7.29).
FIGURE 7.29 A third possible stereochemical result for the SN2 reaction.
Finally, it is possible that some dreadful mixture of the (R) and (S) forms is produced. In such a case, it is very difficult to analyze the situation, as several reaction mechanisms may be operating simultaneously.
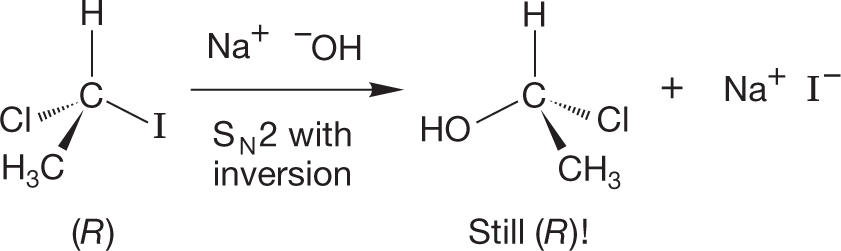
PROBLEM 7.10 Sometimes matters appear more complicated than they really are. It is possible, for example, that an (R) starting material could produce an (R) product by a process involving inversion. Here is a conceivable example:
Convince yourself that inversion has occurred. Explain why the starting material and the product have the same configuration [(R) in this case].
For most secondary and primary substrates, substitution occurs with complete inversion of configuration. We now are faced with three questions: (1) How do we know the reactions go with inversion? (2) What does this result tell us about the reaction mechanism? (3) Why is inversion preferred to retention or racemization?
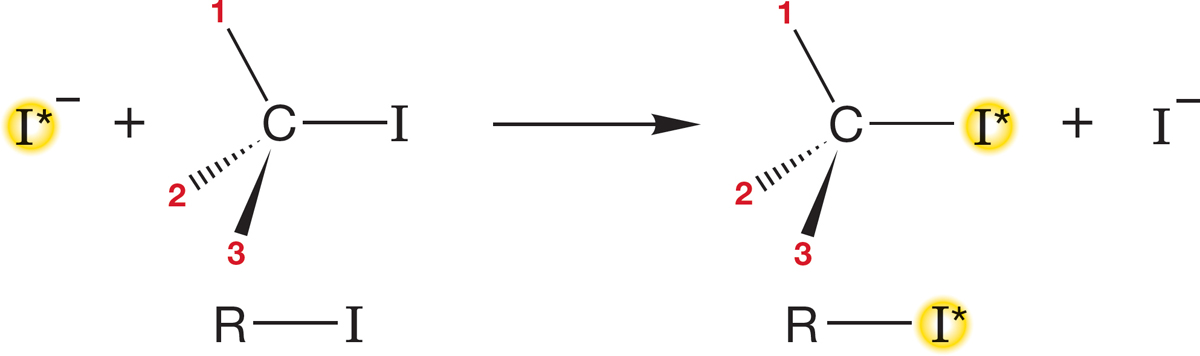
FIGURE 7.30 A mechanism involving retention predicts that incorporation of radioactive iodide will induce no change in optical rotation.
The answer to the first question is easy: We measure it. Suppose we start with the optically active iodide R―I in Figure 7.30 and monitor the reaction with radioactive iodide ion (−I*).4 We measure two things: the incorporation of radioactive iodide and the optical activity of R―I*. If radioactive iodide reacts with R―I with retention of configuration, there will be no loss of rotation at all [I* and I are not significantly different in their contributions to the rotation of plane-polarized light (Fig. 7.30)].
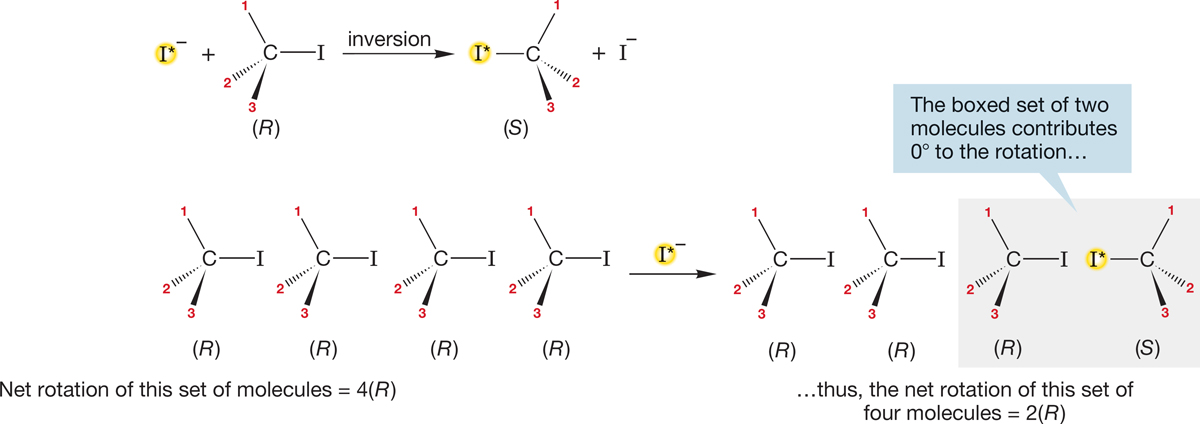
What happens if the reaction goes with inversion? The observed optical rotation of R―I is certainly going to decrease as, for example, (R)-iodide is converted into (S)-iodide. But it is usually not obvious how the rate of loss of optical activity compares with the rate of incorporation of I*. If every replacement occurs with inversion, the rate of loss of optical activity must be twice the rate of incorporation of I*. Every conversion of an (R)-iodide (R―I) into an (S)-iodide (I*―R) generates a product molecule (I*―R) whose rotation exactly cancels that of a molecule of starting R―I. In effect, the rotation of two molecules goes to zero for every inversion (Fig. 7.31). This change is exactly what is observed experimentally. Every incorporation of I* is accompanied by the inversion of one (R)-iodide to an (S)-iodide.
FIGURE 7.31 A mechanism involving inversion. For the incorporation of one atom of radioactive iodide, the rotation of the set of molecules shown will be cut by a factor of 2.
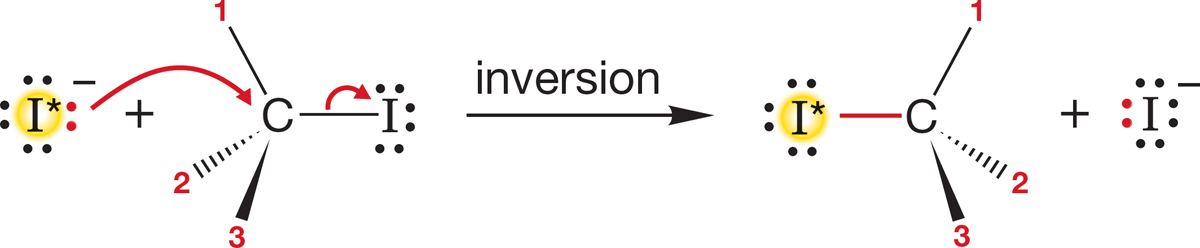
Now, what does this result tell us about the mechanism? The observation of inversion tells us that the nucleophile, the incoming atom or molecule, must be approaching the substrate from the rear of the departing atom. Only this path can lead to the observed inversion. Figure 7.32 shows the reaction, along with an arrow formalism description of the bonds that are forming and breaking. The arrows show the path of approach of the incoming nucleophile and the departing leaving group. The tetrahedral “umbrella” is inverted during the reaction.
FIGURE 7.32 The observation of inversion in the SN2 reaction means that the entering nucleophile, radioactive (or labeled) iodide, must enter the molecule from the side opposite the departing leaving group, here unlabeled iodide.
Had the reaction occurred with retention, a frontside approach would have been demanded. The incoming nucleophile would have had to enter the molecule from the same side as the departing leaving group. The tetrahedral “umbrella” would have retained its configuration. This result is not observed (Fig. 7.33).
FIGURE 7.33 If retention had been the experimentally observed result, the nucleophile would have added from the same side that the leaving group departed.
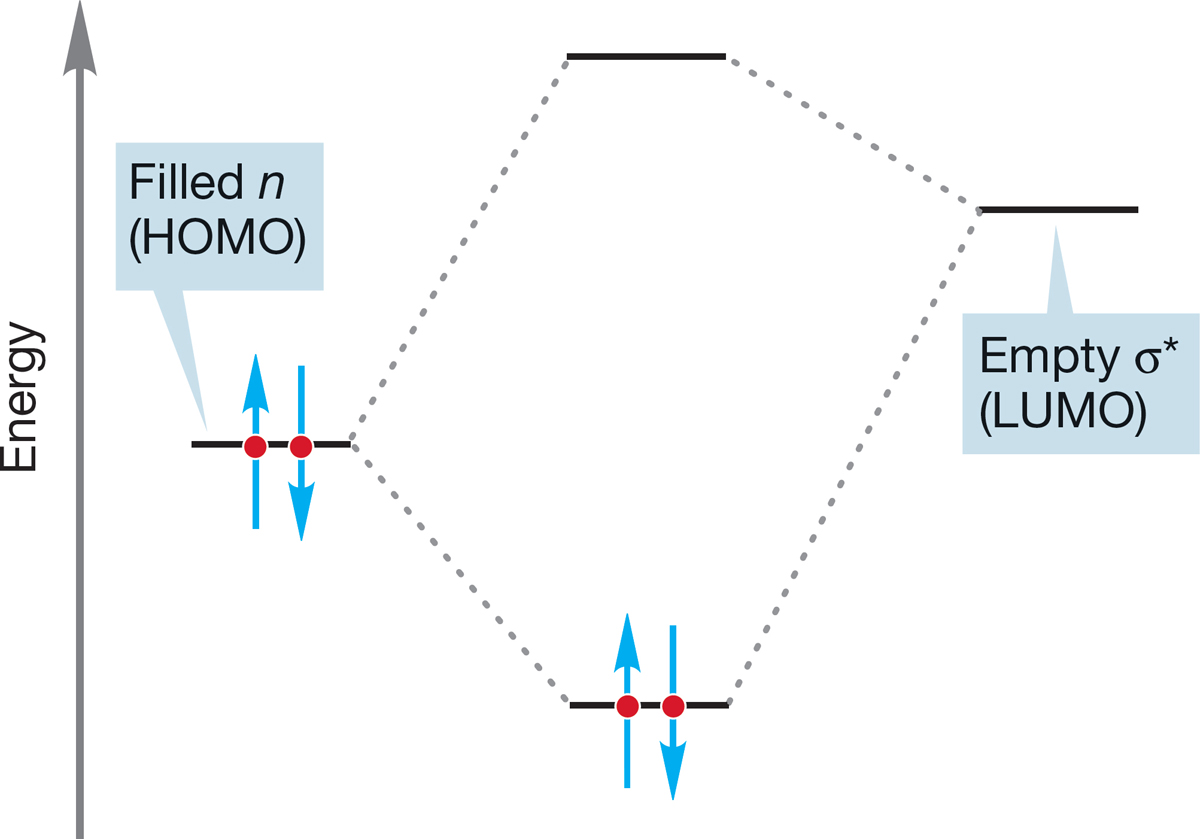
FIGURE 7.35 An orbital interaction scheme for the stabilizing interaction of a filled nonbonding orbital (n) on the nucleophile overlapping with the empty, antibonding (σ*) orbital on the substrate.
All this analysis is useful; we now know the path of approach for the nucleophile in the SN2 reaction, and so we know more about the mechanism of this process. But our newfound knowledge serves only to generate the inevitable next question. Why is inversion preferred? Why is frontside displacement—retention—never observed? Here comes part of the payoff for all the work we did in earlier chapters on molecular orbitals. One of the key lessons of those early chapters was that interactions of filled and empty orbitals are stabilizing because the two electrons originally in the filled orbital can be accommodated in the new bonding orbital, and no electrons need occupy the antibonding molecular orbital. Now let’s look at the SN2 reaction in orbital terms. A filled nonbonding orbital n on the nucleophile interacts with an orbital on the substrate, R―LG, involved in the bond from C to the leaving group, LG. Because the interaction of two filled orbitals is not stabilizing, the filled orbital n must overlap with the empty, antibonding σ* orbital of C―LG. This overlapping is nothing more than the interaction of the nucleophile’s HOMO, n, with the electrophile’s LUMO, σ*, shown schematically in Figure 7.35.
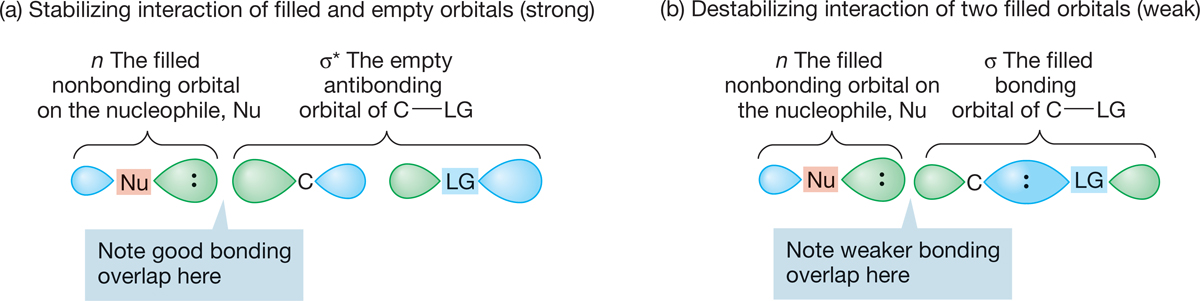
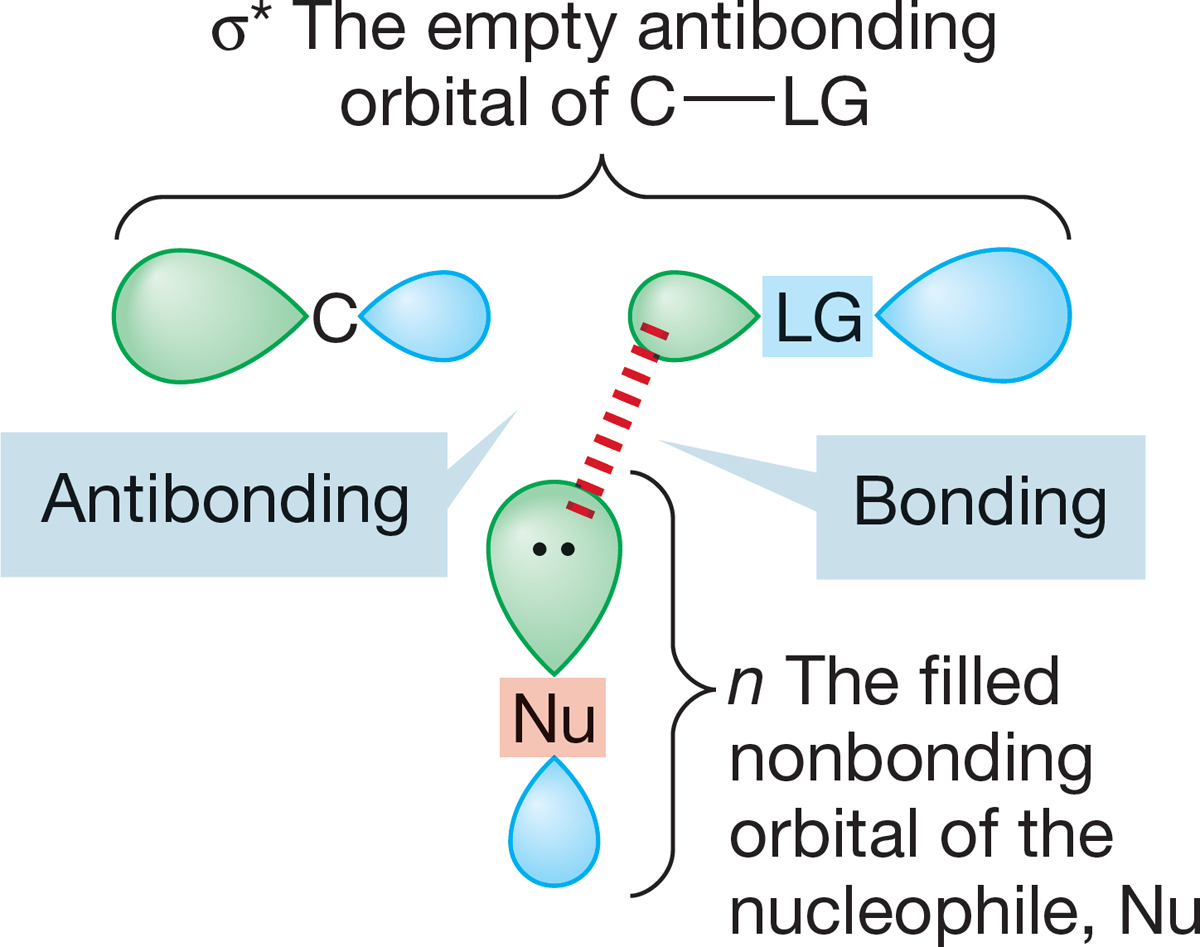
What does σ* look like? Figure 7.36 shows us. Note that σ* has one of its large lobes pointing to the rear of C―LG. That is where overlap with the filled n orbital will be most efficient.
FIGURE 7.36 (a) The overlap of the filled nonbonding orbital (n) with the “outside” lobe of the empty σ* orbital of C―LG takes advantage of the good overlap available with this lobe of σ*. (b) Contrast (a) with the destabilizing interaction of n and σ, the two filled orbitals. The interaction of two filled orbitals is destabilizing, but the overlap of the lobes involved―one fat, the other thin―is poor. Therefore, this interaction is not important, and the stabilizing interaction shown in (a) dominates.
FIGURE 7.37 Frontside substitution (retention) requires overlap with the inside part of σ*. There is poor overlap with the small lobes of σ*, as well as no net bonding.
Now look what happens if the orbitals overlap in a way that would lead to retention through a frontside substitution (Fig. 7.37). Not only is the magnitude of interaction reduced by the relatively poor overlap with the smaller lobe of σ*, but also there is both a bonding and an antibonding interaction, and these tend to cancel each other. Frontside displacement is a very unlikely process indeed.
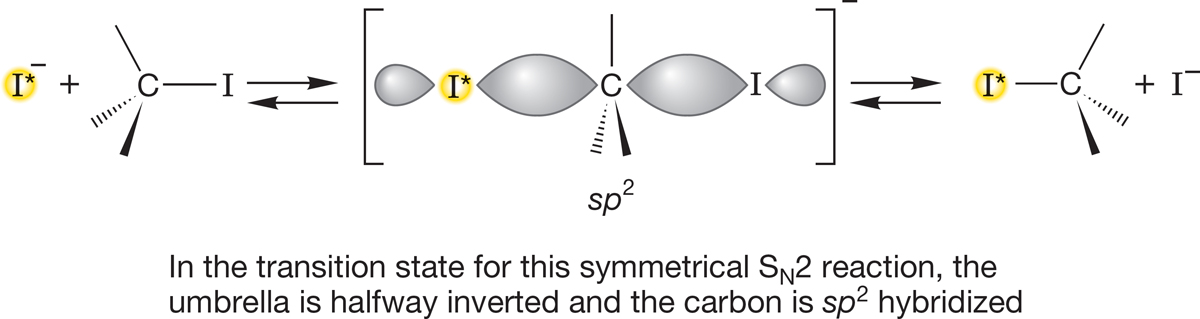
We can now map out the progress of the bond making and breaking in the SN2 reaction. The reaction starts as the nucleophile Nu:− approaches the rear of the substrate. Because the HOMO, the nonbonding orbital n on Nu:−, overlaps with the LUMO, the antibonding σ* orbital of C―LG, the bond from C to LG is weakened as the antibonding orbital begins to be occupied. The bond length of C―LG increases as the new bond between Nu and C begins to form. As C―LG lengthens, the other groups attached to C bend back, in umbrella fashion, ultimately inverting (just like the windblown umbrella) to form the product. For a symmetrical displacement such as the reaction of radioactive −I* with R―I discussed earlier, the midpoint of the reaction is the point at which the groups attached to C are exactly halfway inverted (Fig. 7.38).
FIGURE 7.38 In a symmetrical inversion process, the midpoint, or the transition state, is the point at which the umbrella is exactly half-inverted.
What is the hybridization of the central carbon at this midpoint? It must be sp2, because this carbon is surrounded by three coplanar groups. There are partial bonds to the incoming nucleophile, −:I*, and the departing leaving group, −:I. No picture shows the competition between the two nucleophiles (−:I* and −:I) as clearly as this one. What Lewis acid are they competing for? A carbon 2p orbital, as the figure shows. What is this structure? At least in the symmetrical displacement of −:I by −:I*, it is the halfway point between the equi-energetic starting material and product. This structure is the transition state for this reaction. Is this transition state something we could potentially catch and isolate? No! It occupies not an energy minimum, as stable compounds do, but sits on an energy maximum along the path from starting material to product. We have seen such structures before: Recall, for example, the eclipsed form of ethane (Fig. 7.39a) or the transition state for the interconversion of two pyramidal methyl radicals (p. 67).
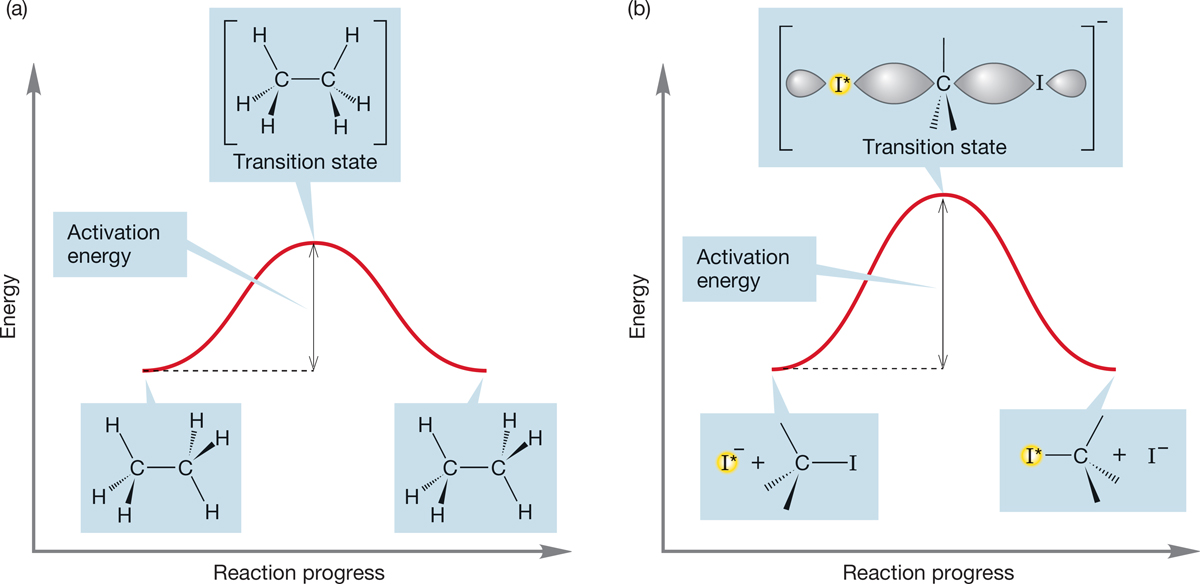
FIGURE 7.39 Two analogous diagrams. (a) The rotation about the carbon–carbon bond in ethane; (b) the displacement of −I by −I*. In each case, two equi-energetic molecules are separated by a single energy barrier, the top of which is called the transition state, shown in brackets.
7.5c Energy Barriers in Chemical Reactions: The Transition State and Activation Energy Now, let’s consider the change in energy as the SN2 reaction proceeds (Fig. 7.39b). The starting material and products are separated by the high-energy point of the reaction, the transition state. The energy difference between starting material and transition state is related to the rate of the reaction. The larger this difference, the higher is the barrier, and the slower is the reaction. So, a quantity of vital importance to any study of a chemical reaction is the energy difference between starting material and the transition state, or activation energy. The reaction progress diagram is symmetrical only if the substitution reaction is symmetrical; that is, if starting material and product are of equal energy.5
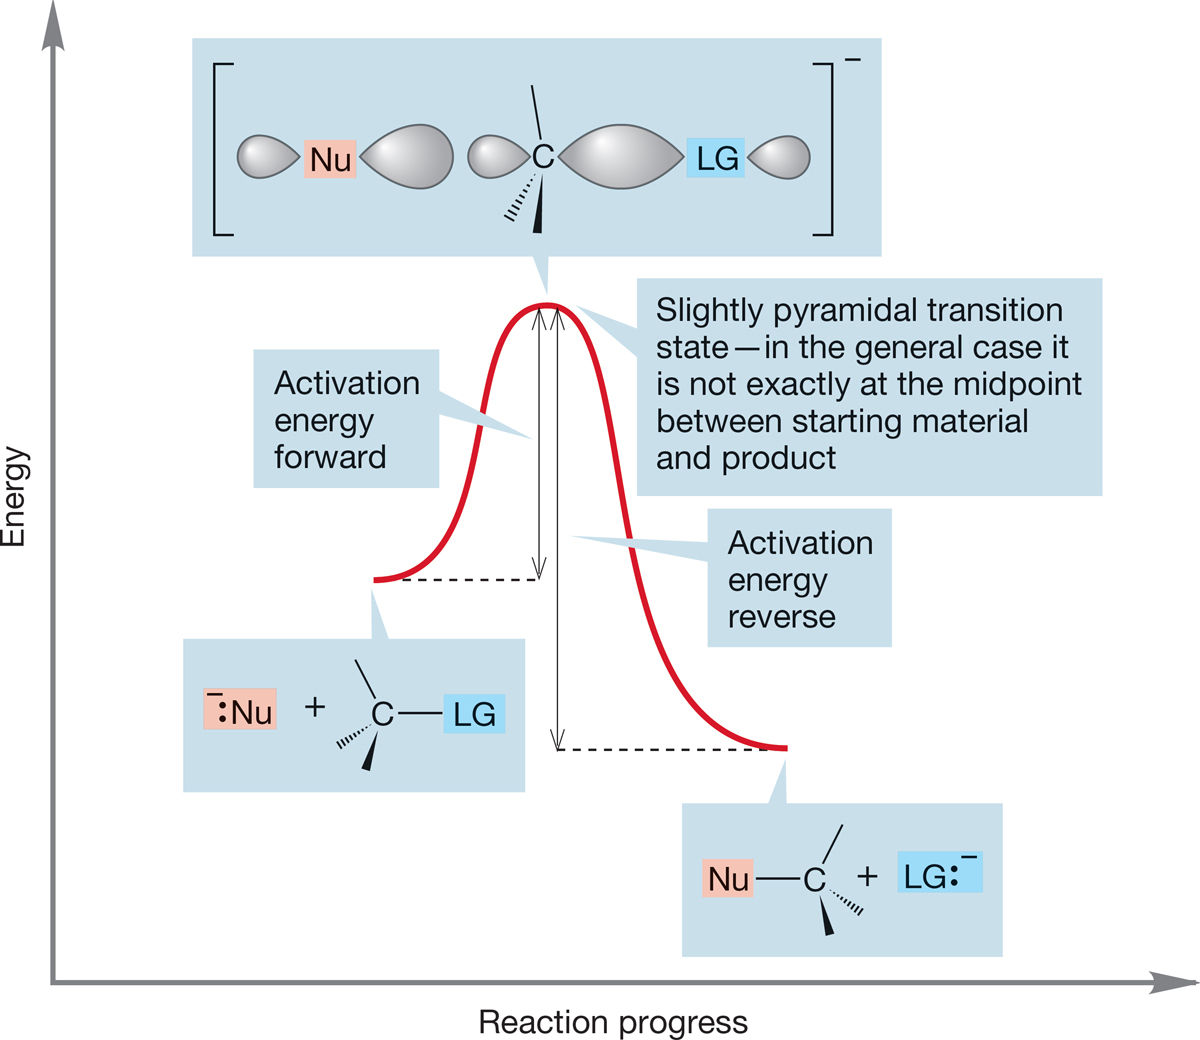
FIGURE 7.40 A general SN2 reaction. If the nucleophile (Nu) and the leaving group (LG) are different, the transition state is not exactly at the midpoint of the reaction, and the hybridization of carbon is only approximately sp2.
This specific picture is transferable to a general second-order substitution reaction, but some differences will appear. First of all, usually the starting material and product are not at the same energy, and the transition state cannot be exactly halfway between starting material and product. It will lie closer to one than the other. The transition state cannot be exactly sp2, only nearlysp2 (notice its slightly pyramidal shape) (Fig. 7.40).
Figure 7.40 shows both an exothermic and endothermic SN2 substitution reaction. If we read the figure conventionally from left to right, we see the exothermic reaction, but if we read it “backward,” from right to left, we see the endothermic reaction. Notice that the activation energy for the forward process must be smaller than that for the reverse reaction. Thermodynamics determines where the equilibrium settles out, and there may be practical consequences if one partner is substantially favored over the other, but one diagram will suffice to examine both directions. Many of us are prisoners of our language, which is read from left to right, and we tend to do the same for these energy diagrams. Nature is more versatile, or perhaps less prejudiced, than we are.
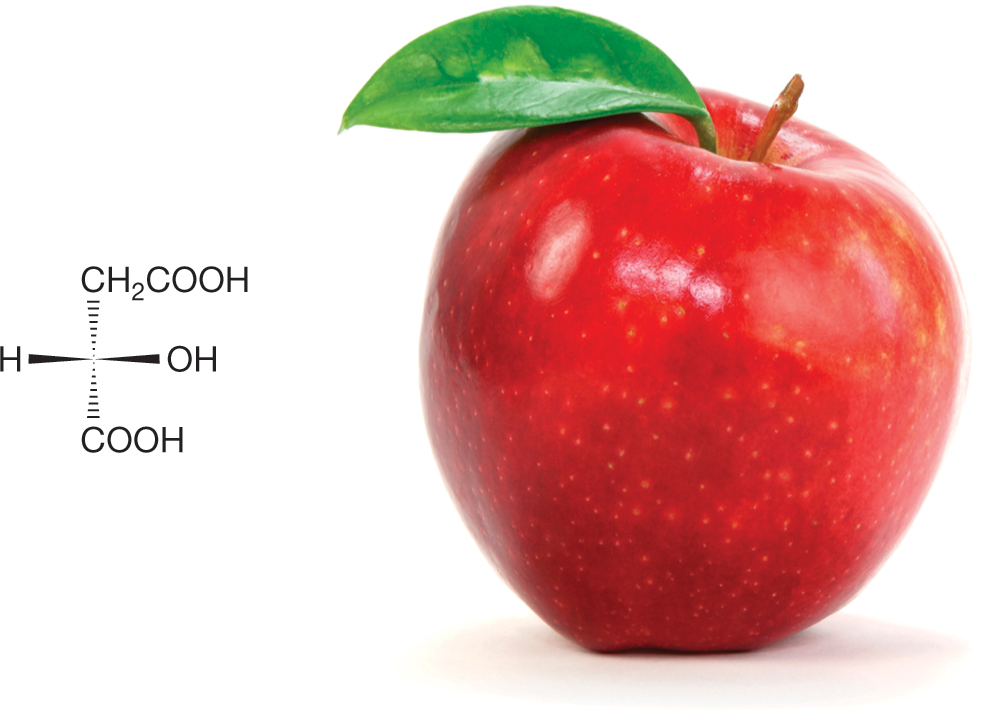
MALIC ACID
The chiral malic acid figures strongly in the original discovery of inversion of configuration in the SN2 reaction. Malic acid is sometimes called “apple acid” because of its high concentration in apples, nectarines, and some other fruits. In fact, it was first isolated from apple juice as early as 1785. It functions as a molecular carrier of the carbon dioxide absorbed by plants.
All apples contain malic acid, even if they aren’t “organically” grown.
The CO2 appears in the CH2CO2H group of malic acid. The principal actor in the early mechanistic work on the SN2 reaction was Paul Walden, a chemist born in 1863 in what is now Latvia and who died in Tübingen, Germany, in 1957. Indeed, the inversion now known to occur universally in the SN2 reaction is sometimes called Walden inversion.
MJ’s teacher of organic chemistry, William Doering (1917–2011), told a wonderful story about Paul Walden. Professor Doering was visiting Tübingen in 1956 to talk about his work and overheard a now-famous German chemist lamenting the fact that Tübingen had not been bombed during World War II. It seems that most of his colleagues in other “more fortunate” cities had newly built laboratories courtesy of Allied bombing. There was an old gentleman sitting in the corner who had been wheeled into the department from his nursing home to hear Doering’s seminar. Paul Walden—for indeed it was he—was 92 at the time. He overheard the remark and replied, scathingly, “Es ist nicht der Käfig, sondern der kleine Vogel darin!” (It is not the cage that matters, but the little bird inside!)
The take-home lesson here is an important one: There is a strong preference for inversion in the SN2 reaction. Indeed, there is no authenticated example of retention of configuration in this process, despite a great deal of searching by some very clever people.
In the next few subsections, we will examine the effects of structural change in the various participants in the SN2 reaction: the R group, the nucleophile, the leaving group, and the solvent.
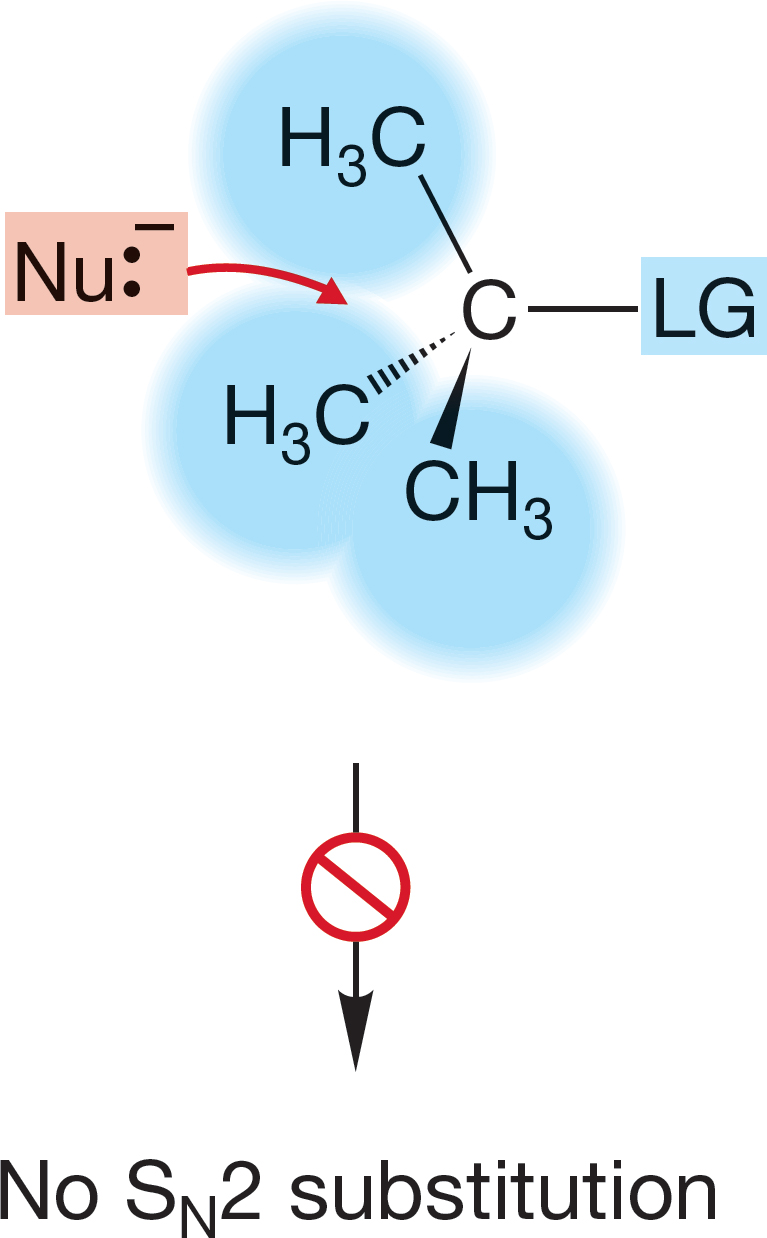
FIGURE 7.41 For tertiary substrates, approach from the rear is hindered by the alkyl groups, here all shown as methyls. This steric effect makes the SN2 reaction impossible.
7.5d Effects of Substrate Structure: The R Group The structure of the R group makes a huge difference in the rate of the SN2 reaction. We anticipated this result when we mentioned earlier that the practically useful SN2 reactions were restricted to primary and secondary substrates. By implication, the rate of the SN2 reaction with tertiary substrates is zero or at least negligibly small (Table 7.3). Why should this be? The simple answer seems to be that in a tertiary substrate, the rear of the C―LG bond is guarded by three alkyl groups, and the incoming nucleophile can find no unhindered path along which to approach the fat lobe of σ* (Fig. 7.41). So the SN2 reaction is disfavored for tertiary substrates, for all of which, steric hindrance to the approaching nucleophile is prohibitively severe. Another substitution mechanism, favorable for tertiary substrates, becomes possible. It is called the SN1 reaction, and we will deal with its mechanism in Section 7.7.
If this steric argument is correct, secondary substrates should react more slowly than primary substrates, and primary substrates should be slower than methyl compounds. In general, this is the case (Table 7.3). In practice, the SN2 reaction is typically useful as long as there is at least one hydrogen attached to the same carbon as the leaving group. Thus, the SN2 reaction works only for methyl, primary, and secondary substrates, all of which have at least one hydrogen attached to the carbon at which the substitution is occurring. The small size of hydrogen opens a path at the rear for the incoming nucleophile.
TABLE 7.3 Average Rates of SN2 Substitution Reactions for Different Groups
R
Average Relative Rate
CH2 CHCH2
1.3
CH3
1
CH3CH2
0.033
CH3CH2CH2
0.013
(CH3)2CH
8.3 × 10⁻⁴
(CH3)3CCH2
2 ×10⁻⁷
(CH3)3C
~0
PROBLEM 7.11 Explain the following change in rate for the SN2 reaction:
R―O− + CH3CH2―I → R―O―CH2CH3 + I−
Rate for R = CH3 is much faster than that for R = (CH3)3C
This picture of the SN2 reaction, which emphasizes steric effects, allows us to make a prediction. In principle, there must be some primary group so gigantic that the SN2 reaction would be unsuccessful.
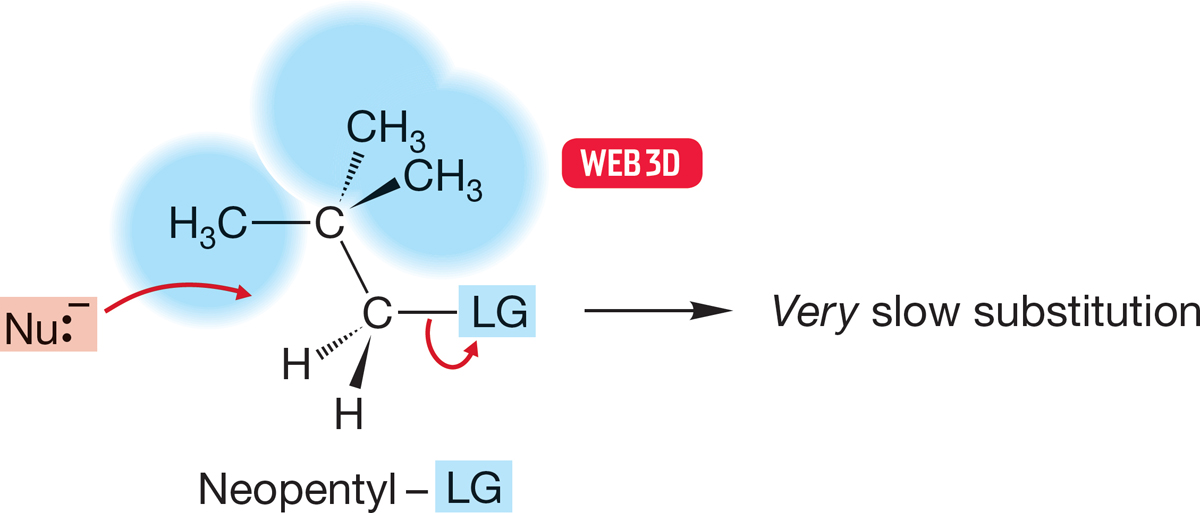
In practice, it is rather easy to find such groups. Even the neopentyl group, (CH3)3CCH2, is large enough to slow the bimolecular displacement reaction severely because the tert-butyl group blocks the best pathway for rearside displacement of the leaving group (Fig. 7.42; Table 7.3).
FIGURE 7.42 Even neopentyl compounds, in which a tert-butyl group shields the rear of the C―LG bond, are hindered enough so that the rate of the SN2 reaction is extremely slow.
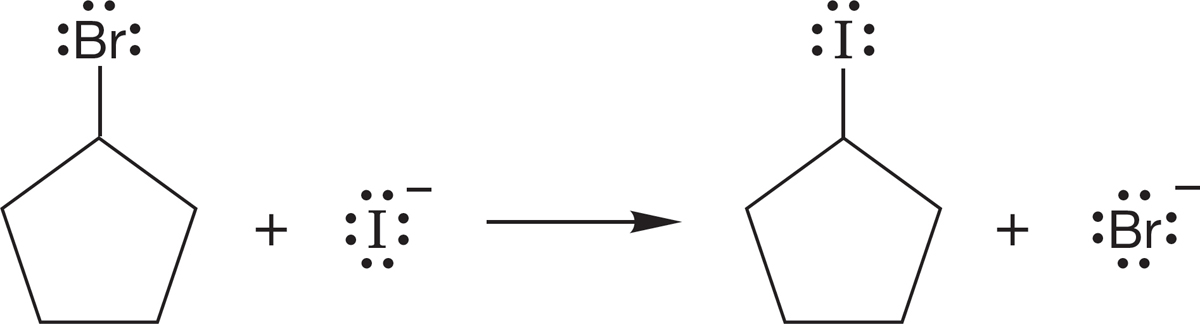
The SN2 reaction also takes place when ring compounds are used as the substrates, although there are some interesting effects of ring size on the rate of the reaction (Table 7.4; Fig. 7.43).
FIGURE 7.43 The SN2 reaction takes place in a normal fashion with cyclic substrates.
TABLE 7.4Relative Reactivitiesof Cycloalkyl Bromides in the SN2 Reaction
Compound
Relative Rate
Cyclopropyl bromide
<10−4
Cyclobutyl bromide
8 × 10⁻³
Cyclopentyl bromide
1.6
Cyclohexyl bromide
1 × 10⁻²
Isopropyl bromide
1.0
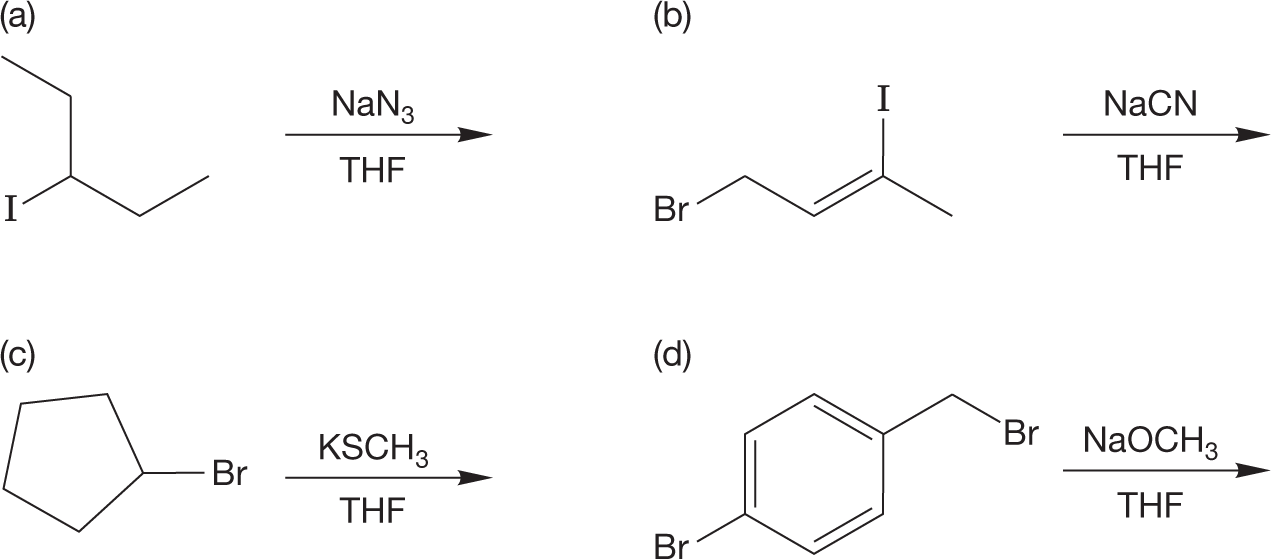
PROBLEM 7.12 Predict the products of the following reactions:
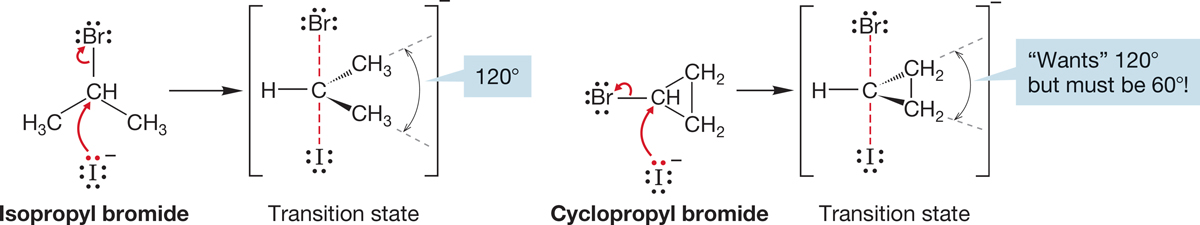
Why should small rings be so slow in the SN2 reaction? As with any question involving rates, we need to look at the structures of the transition states for the reaction to find an answer. In the transition state, the substrate is hybridized approximately sp2, and that requires bond angles close to 120°. The smaller the ring, the smaller are the C―C―C angles. For a three-membered ring, the optimal 120° must be squeezed to 60°, and for a cyclobutane, squeezed to 90°. This contraction introduces severe angle strain in the transition state, raises its energy, and slows the rate of reaction (Fig. 7.44).
FIGURE 7.44 A comparison of SN2 transition states for isopropyl bromide and cyclopropyl bromide.
PROBLEM 7.13 Wait! The argument just presented ignores angle strain in the starting material. Cyclopropane itself is strained. Won’t that strain raise the energy of the starting material and offset the energy rise of the transition state? Comment. Hint: Consider angle strain in both starting material and transition state—in which will it be more important?
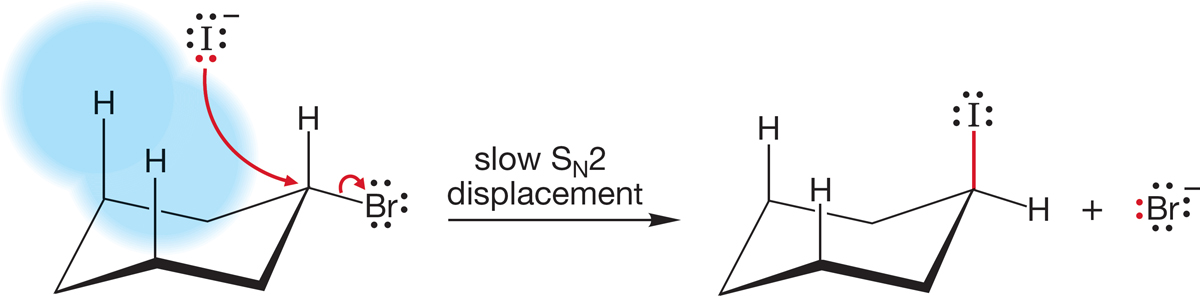
In cyclohexane, the reaction rate is apparently slowed by steric interactions with the axial hydrogens. There can be no great angle strain problem here (Fig. 7.45).
FIGURE 7.45 The slow SN2 displacement of bromide by iodide in cyclohexyl bromide. Incoming iodide is apparently blocked somewhat by the axial carbon–hydrogen bonds.
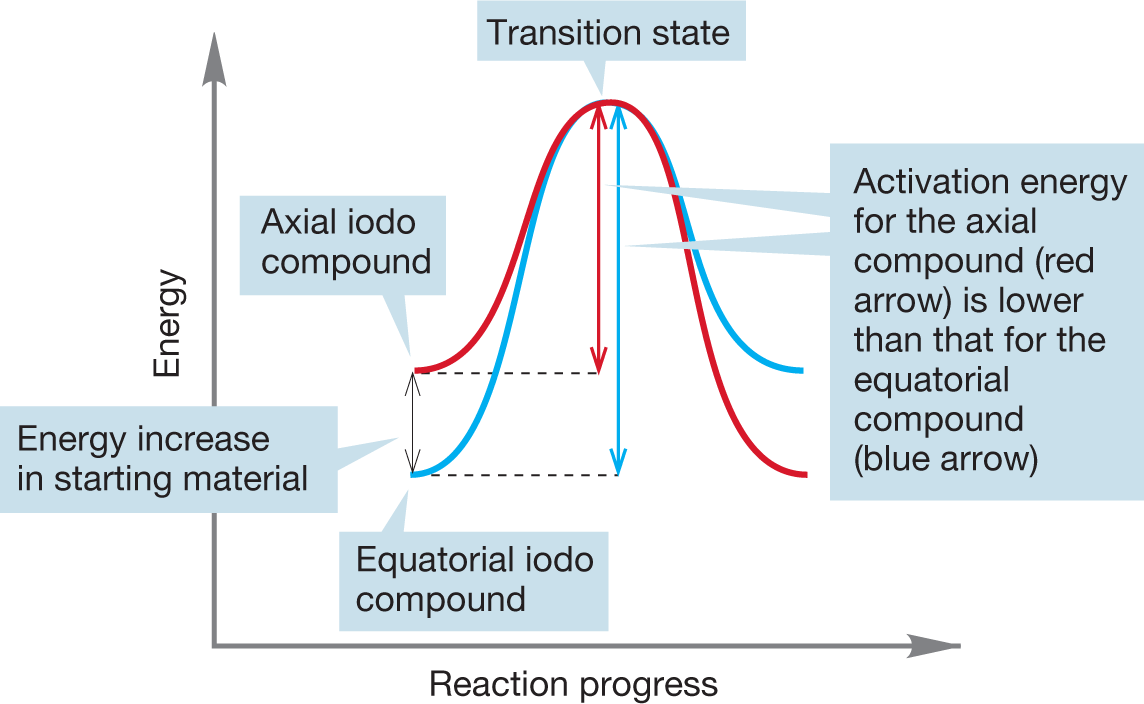
WORKED PROBLEM 7.14 The axial cyclohexyl iodide shown in the following figure reacts more quickly in SN2 displacements than the equatorial cyclohexyl iodide. Draw the transition states for displacement of iodide from axial cyclohexyl iodide by iodide ion and for the analogous reaction of equatorial cyclohexyl iodide. What is the relation between these transition states? Why does the axial iodo compound react faster than the equatorial compound? Caution! Tricky question.
ANSWER A tricky problem indeed. The transition states for the two reactions are the same! There is no energy difference between the two transition states: The transition state is the same for displacement of axial and equatorial cyclohexyl iodide from 4-iodo-tert-butylcyclohexane.
The transition state is the same for displacement of axial and equatorial cyclohexyl iodide from 4-iodo-tert-butylcyclohexane
Therefore, the reason that axial cyclohexyl iodide reacts more quickly than equatorial cyclohexyl iodide cannot lie in the transition state energies. However, the axial iodo group has a higher energy of the starting material, thus lowering the activation energy.
7.5e Effect of the Nucleophile Some displacing agents are more effective than others. In other words, they are better players in the competition for the carbon 2p orbital, the Lewis acid. In this section, we examine what makes a good nucleophile; that is, what makes a powerful displacing agent.
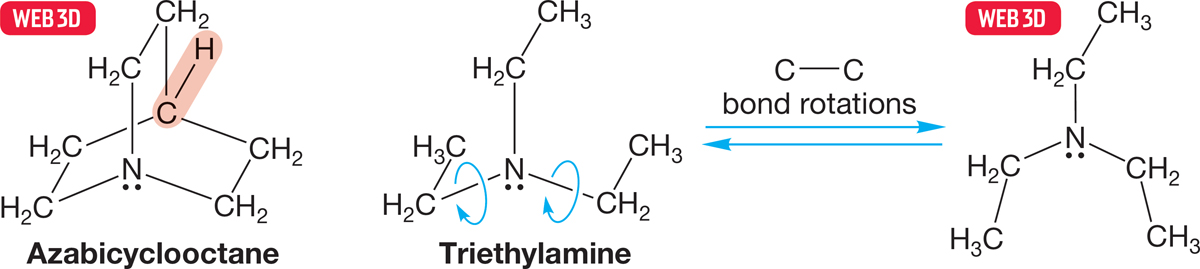
Remember: Size can be important. We have already seen how the SN2 reaction can be slowed or even stopped altogether by large R groups (Fig. 7.42). Presumably, large nucleophiles will also have a difficult time in getting close enough to the substrate to overlap effectively with σ* (Problem 7.11, p. 291). Figure 7.46 shows two nucleophiles, carefully chosen to minimize all differences except size.
FIGURE 7.46 In both azabicyclooctane and triethylamine, the nucleophilic nitrogen atom is flanked by three two-carbon chains. In the bicyclic cage compound azabicyclooctane, they are tied back by the CH group shown in red and are not free to rotate. In triethylamine, they are free to rotate and effectively increase the bulk of the nucleophile.
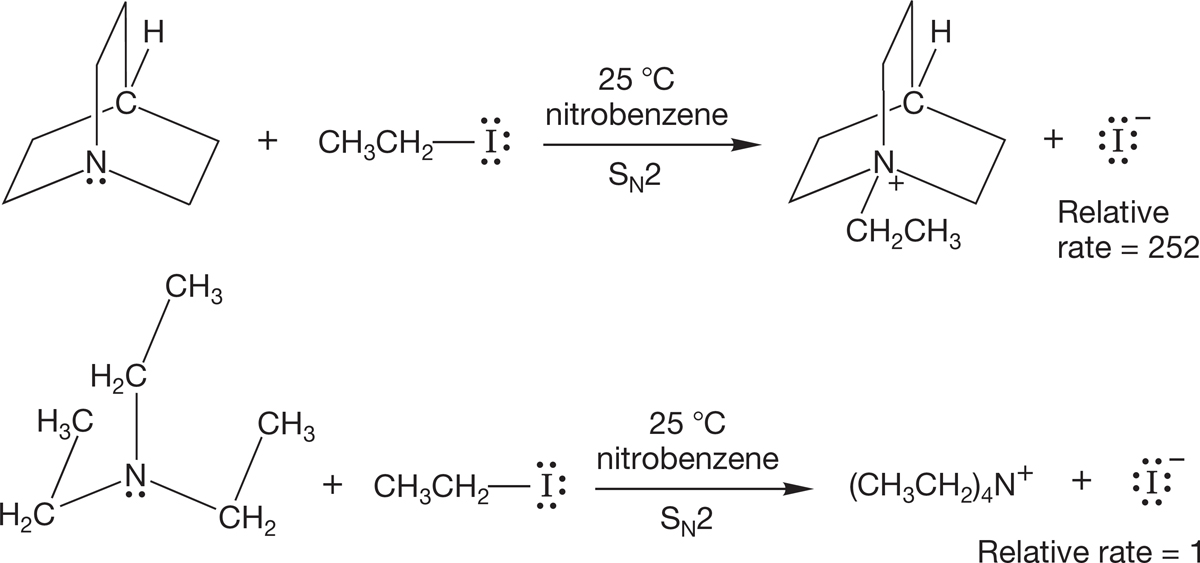
The bicyclic molecule, in which the three ethyl-like groups are tied back out of the way, is a more effective displacing agent than is triethylamine, in which the three ethyl groups are freely rotating. Triethylamine is effectively larger than the cage compound in which the alkyl groups are tied back (Fig. 7.47).
FIGURE 7.47 The tied-back bicyclic compound reacts faster with ethyl iodide than does triethylamine, which is effectively the larger compound. The larger nucleophile has a more difficult time in attacking the rear of the carbon–iodine bond in ethyl iodide.
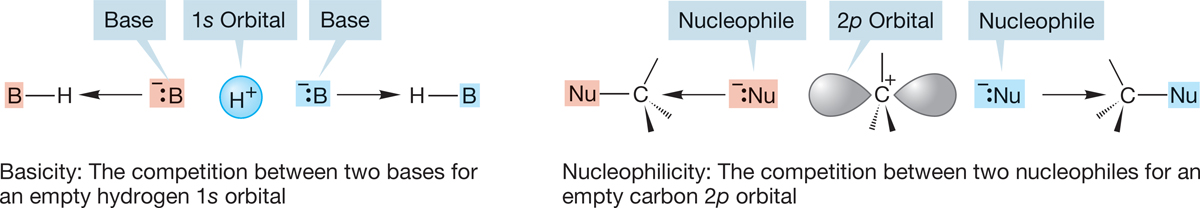
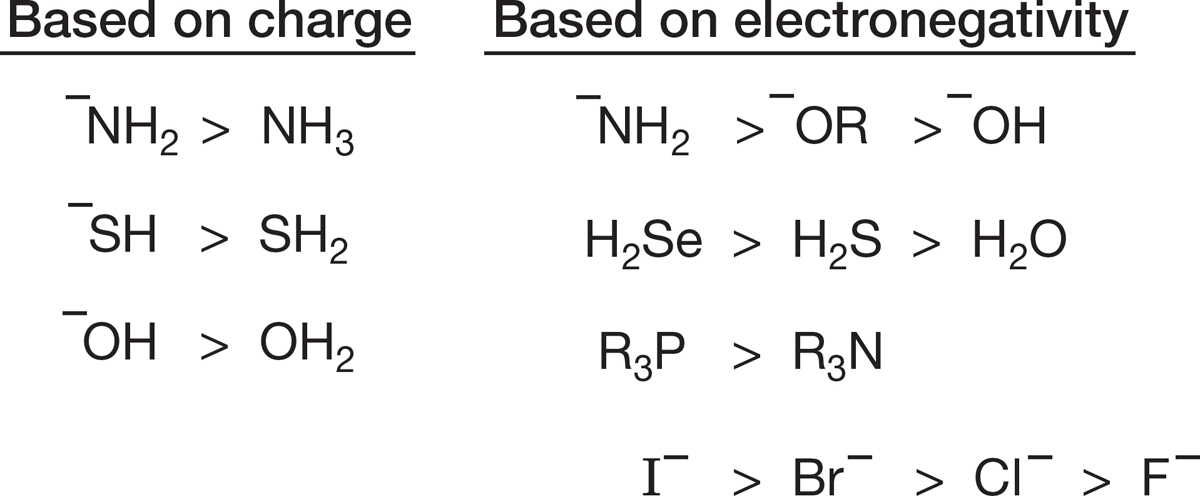
Nucleophilicity, or Lewis basicity, is a measure of how well a nucleophile competes for an empty carbon 2p orbital, and Brønsted basicity is a measure of how well a base competes for an empty hydrogen 1s orbital. You might expect a general correlation of nucleophilicity with base strength, although the two are not exactly the same thing, because 1s and 2p orbitals are different in energy and shape. Nevertheless, basicity and nucleophilicity are related phenomena (Fig. 7.48).
FIGURE 7.48 Brønsted basicity and nucleophilicity are different, but related, phenomena.
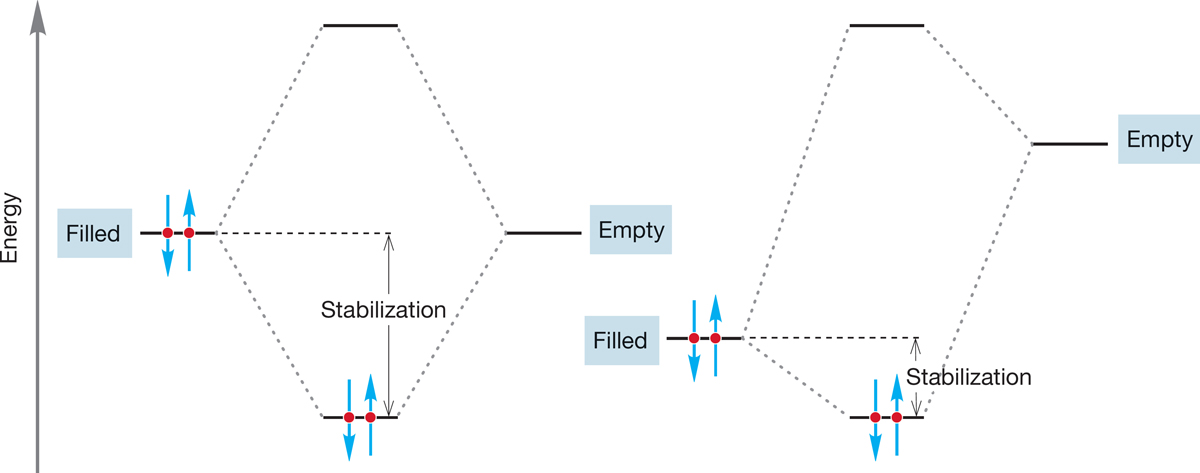
Actually, it is simple to refine our discussion of good nucleophiles. What do we mean by “a good competitor for a carbon 2p orbital”? We are talking about the overlap of a filled orbital and an empty orbital, and the resulting stabilization is a measure of how strong the interaction is. Remember: The strongest orbital interactions, and hence the greatest stabilizations, come from the overlap of orbitals close in energy (Fig. 7.49). Therefore, we can anticipate that energy matching between the orbital on the nucleophile and an empty carbon orbital is important in determining nucleophilicity.
FIGURE 7.49 Stabilization is greater when filled and empty orbitals of equal or nearly equal energy interact than it is when orbitals that differ greatly in energy interact. The further apart two orbitals are in energy, the smaller is the stabilization resulting from their overlap.
Table 7.5 and Figure 7.50 show some nucleophiles segregated into general categories. It is not possible to do much better than this because nucleophilicity is a property that depends on the reaction partner. A good nucleophile with respect to carbon may or may not be a good nucleophile with respect to displacement on some other atom. Energy matching is critical in the reaction. If we change the reaction partner, and thus the energy of the orbital involved, we change the stabilization involved as well (Fig. 7.49).
TABLE 7.5 Relative Nucleophilicities of Some Common Species
Species
Name
Relative Nucleophilicity
Excellent Nucleophiles
NC−
Cyanide
126,000
HS−
Mercaptide
126,000
I−
Iodide
80,000
Good Nucleophiles
HO−
Hydroxide
16,000
Br−
Bromide
10,000
N3−
Azide
8,000
NH3
Ammonia
8,000
NO2−
Nitrite
5,000
Fair Nucleophiles
Cl−
Chloride
1,000
CH3COO−
Acetate
630
F−
Fluoride
80
CH3OH
Methyl alcohol
1
H2O
Water
1
FIGURE 7.50 Some relative nucleophilicities. Be careful! Nucleophilicity (Lewis basicity) is a hard-to-categorize quantity. Relative nucleophilicity depends, for example, on the identity of the reaction partner, which is always an electrophile (Lewis acid), and on the nature of the solvent.
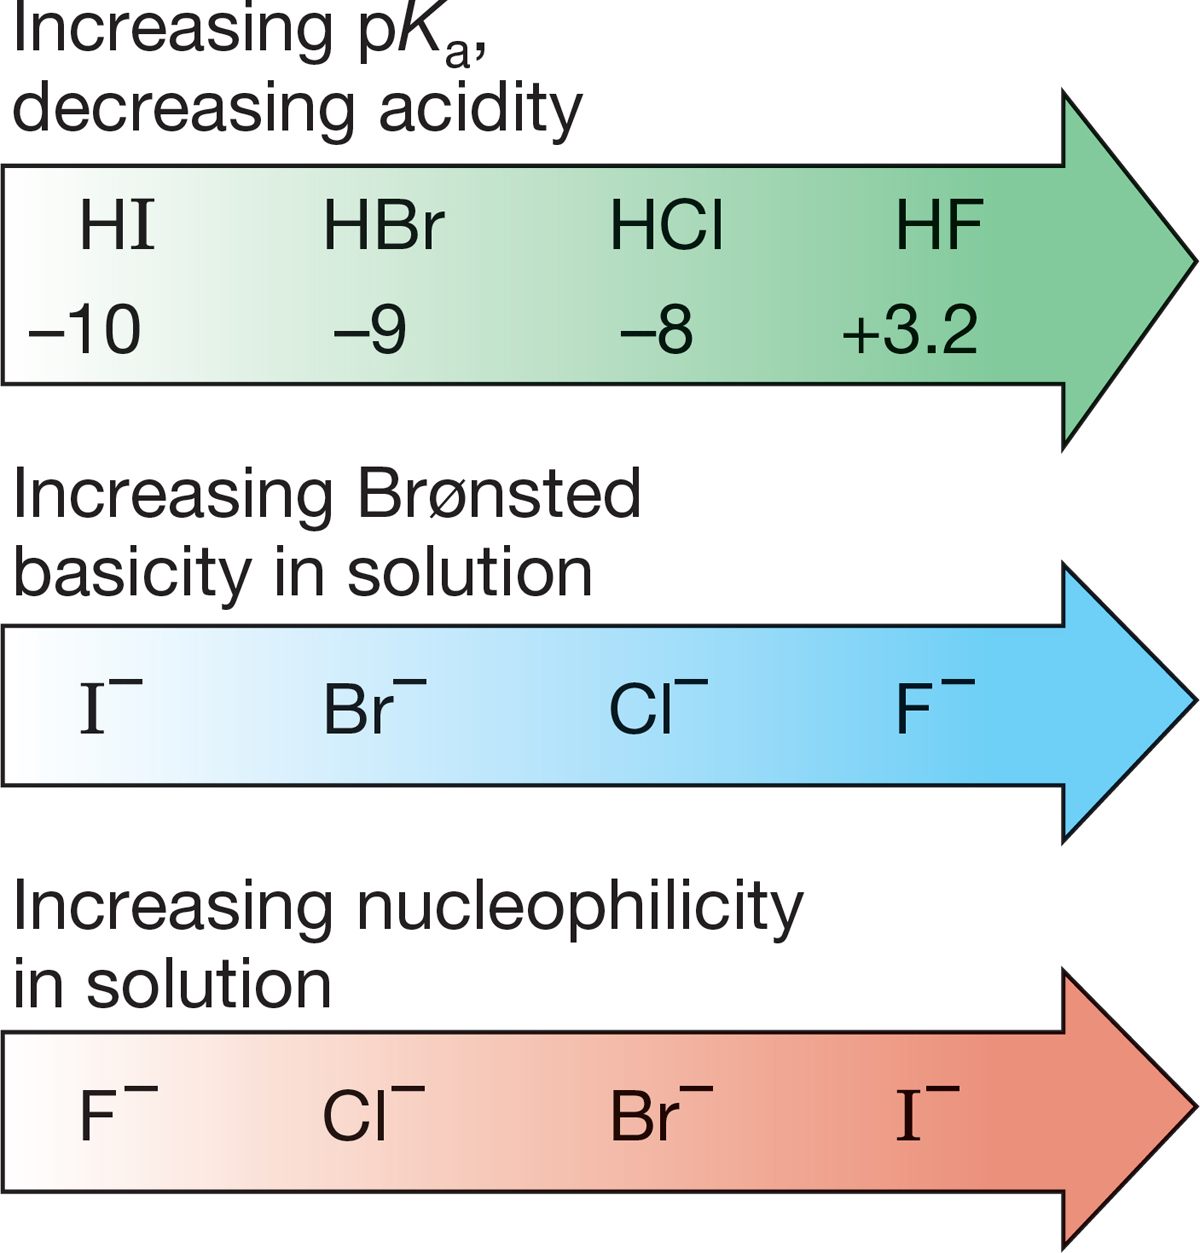
Table 7.5 and Figure 7.50 reveal some spectacular exceptions to the “a good Brønsted base is a good nucleophile” rule. Look at the halide ions, for example. As we would expect from the pKa values of the conjugate acids, HX (where X is a halide), the basicity order is F− > Cl− > Br− > I−. The nucleophilicity order is exactly opposite the basicity order (Fig. 7.51). Iodide is the weakest Brønsted base but the strongest nucleophile. Fluoride is the strongest Brønsted base but the weakest nucleophile. Why?
FIGURE 7.51 For the halide ions in solution, the orders of Brønsted basicity and nucleophilicity are opposite.
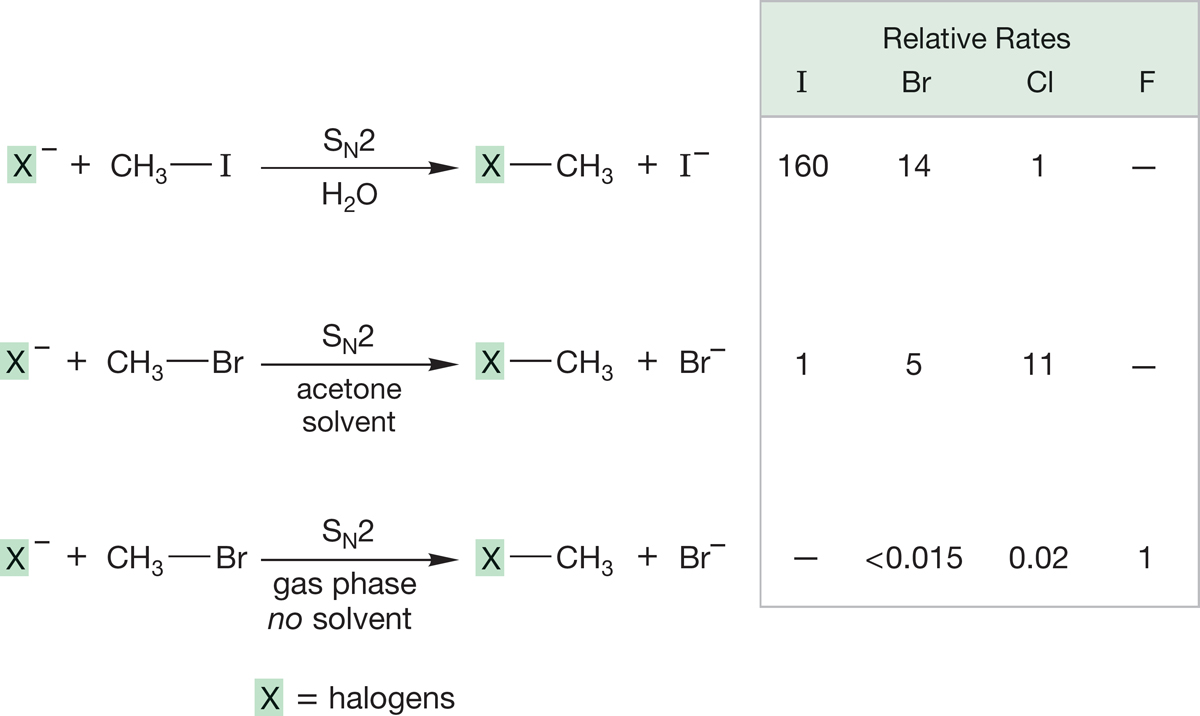
To answer this question, we need more data. It turns out that the effectiveness of these (and other) nucleophiles depends on the so often neglected solvent. It is easy to forget that most chemical reactions are run in “oceans” of solvent, and it is perhaps not too surprising that these oceans of other molecules are not always without substantial effects on the reaction! Figure 7.52 examines rates for typical displacement reactions by halides in solvents of different polarities and in the total absence of solvent (the gas phase). Note that iodide is a particularly effective nucleophile, relative to other halides in water, a protic solvent. Recall our discussion in Chapter 6 (p. 255): Protic solvents are polar solvents containing hydrogens attached to oxygen (e.g., water or alcohols). In polar solvents that do not contain hydroxylic hydrogen, such as acetone, (CH3)2C O, the reactivity order is reversed. In the absence of solvent, in the gas phase, the order is also reversed.
FIGURE 7.52 In the highly polar and protic solvent water, iodide is the best nucleophile (fastest reacting). In the polar but aprotic solvent (CH3)2C O (acetone), the order of nucleophilicity is reversed. In the gas phase, where there is no solvent, fluoride emerges as the best nucleophile. Read the table across, not down. The dashed line means “not measured.”
In a protic solvent, a halide can act as a nucleophile (Lewis base) and react with the substrate through interaction with σ* of the C―X bond. Alternatively, a halide can behave as a Brønsted base by interacting with one of the protic solvent molecules. Chloride and fluoride are by far the better bases and thus hydrogen bond to protic solvents much more strongly than iodide does. The halides become highly solvated in protic solvents, and their relative sizes increase dramatically. They become more encumbered, and therefore less effective nucleophiles. Iodide, the poorer base, is less hydrogen bonded to protic solvents and thus more free to do the SN2 reaction (Fig. 7.53).
FIGURE 7.53 In a hydroxylated solvent, the highly solvated chloride ion reacts more slowly with R—Br than the less encumbered iodide ion does.
As the polarity of the solvent decreases, fluoride becomes more competitive with iodide. What’s the limit of this effect? A reaction with no solvent, of course. Pure nucleophilicity, with no competing effects of solvent, can be examined only in the absence of other bulk molecules. We can do that by running the reaction in the gas phase. It is no trivial matter to examine reactions of ions in the gas phase, as the stability of ions depends heavily on solvation. Yet, since the 1990s, such experiments have become common. In the gas phase, fluoride, the better base, is also the better nucleophile (Fig. 7.52).
7.5f Effect of the Leaving Group Many leaving groups depart as anions.
Nu:− + R―LG → Nu―R + LG:−
It seems obvious that the more stable LG:− is, the easier to displace it. The stability of the anion LG:− is related to how easily its conjugate acid, H―LG, dissociates and thus to the pKa of H―LG. Low-pKa acids (strong acids) are related to good leaving groups, LG:− (weak bases). High pKa acids (weak acids) are related to poor leaving groups (strong bases). Table 7.6 shows some good and poor leaving groups and the pKa values of their conjugate acids, H―LG.
H―LG + H2O ⇄ H3O+ + LG:−
TABLE 7.6 Some Good and Poor Leaving Groups and Their Conjugate Acids
Acid
pKa
Leaving Group
Name
Good Leaving Groups
HI
−10
−I
Iodide
HBr
−9
−Br
Bromide
HCl
−8
−Cl
Chloride
HOSO2R
−3
−OSO2R
Sulfonate
H3O+
−1.7
OH2
Water
Poor Leaving Groups
HF
+3.2
−F
Fluoride
H2S
+7.0
−SH
Thiolate
HCN
+9.4
−CN
Cyanide
H2O
+15.7
−OH
Hydroxide
HOCH2CH3
+15.9
−OCH2CH3
Ethoxide
HOR
+16 to 18
−OR
Alkoxide
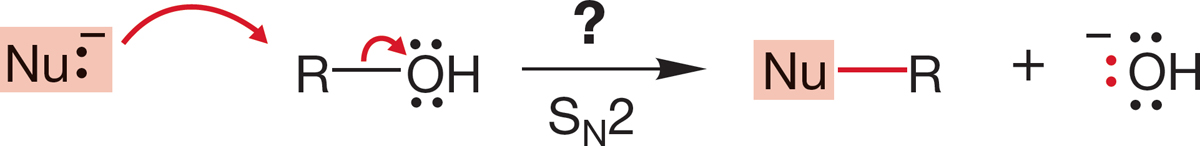
7.5g How to Play “Change the Leaving Group” Often it would be convenient to convert an alcohol (R―OH), which is generally cheap and available (in the chemical industry, those two terms are usually synonymous), into another compound, R―Nu. You might naturally consider an SN2 substitution reaction of R―OH (Fig. 7.54) with some nucleophile Nu:−.
FIGURE 7.54 A hypothetical SN2 reaction converting an alcohol, R—OH, into a new compound, Nu—R.
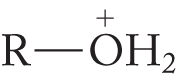
The problem is that −OH is an extraordinarily poor leaving group (Table 7.6). The pKa of water is 15.7. Water is a rather weak acid, and its conjugate base, hydroxide ion, is a strong base. There are several ways to circumvent this problem, the simplest of which is to transfer a proton to the alcohol (protonate the alcohol) with a strong acid to give the conjugate acid of the alcohol, . Protonation converts the leaving group from a very poor leaving group, hydroxide, into an excellent leaving group, water (Fig. 7.55).
FIGURE 7.55 The first step in the reaction of an alcohol with the acid H―B is protonation of the Lewis base oxygen.
PROBLEM 7.15 What will happen when an alcohol is treated with a strong base? Think “simple.”
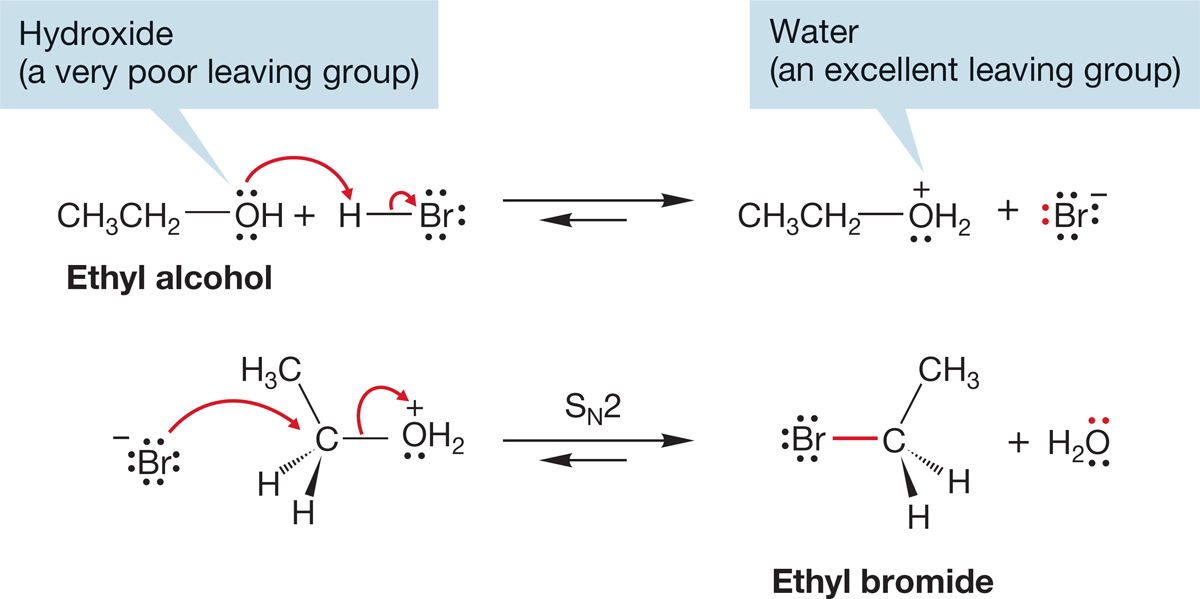
Water is a weak base. Its conjugate acid, H3O+, is a strong acid (pKa −1.7). Therefore, water is easily displaced by a good nucleophile. In the reaction of an alcohol with HBr, the strongest available nucleophile is Br−, the conjugate base of the HBr used to protonate the alcohol. So, if we want to convert an alcohol into a bromide, we need only treat it with HBr. The reaction and the mechanism for the conversion of ethyl alcohol into ethyl bromide is shown in Figure 7.56. Note especially the technique of changing the leaving group from the very poor hydroxide to the excellent water.
FIGURE 7.56 Playing “change the leaving group” with ethyl alcohol.
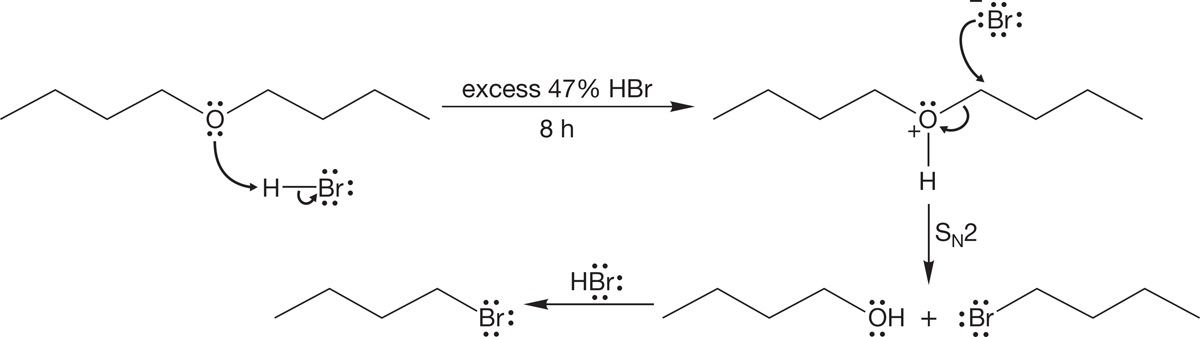
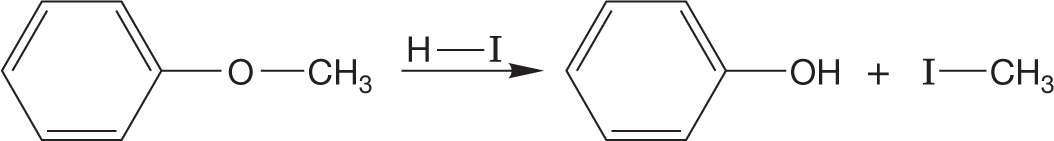
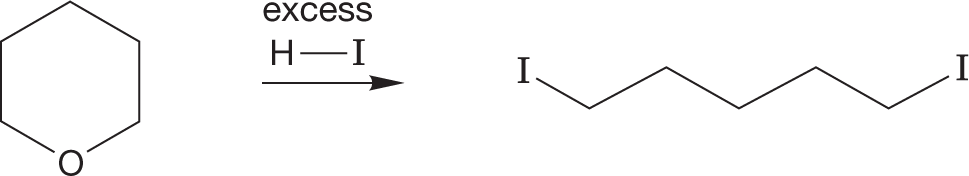
A variant of the “change the leaving group” game is very closely related to the reactions of alcohols in halogenated acids to give halides. It is called ether cleavage, and it follows essentially the same mechanism. In strong halogenated acids, such as HI or HBr, ethers can be cleaved to the corresponding alcohol and halide. In the presence of excess HBr, the alcohols formed in this reaction are often converted into the bromides (Fig. 7.57).
FIGURE 7.57 The mechanism of the cleavage of ethers by strong haloacids.
In this reaction, the ether oxygen is first protonated, turning the potential leaving group in an SN2 reaction from alkoxide, −OR, into the much more easily displaced alcohol, HOR. The displacement itself is accomplished by the halide ion formed when the ether is protonated. This reaction is quite analogous to the reaction of alcohols with haloacids. The halide must be a nucleophile strong enough to do the displacement, and the reaction is subject to the limitations of any SN2 reaction (Fig. 7.57).
PROBLEM 7.16 Clearly, an unsymmetrical ether can cleave in two ways. Yet often, only one path is followed. Explain the specificity shown in the following reaction:
PROBLEM 7.17 Provide a mechanism for the following reaction:
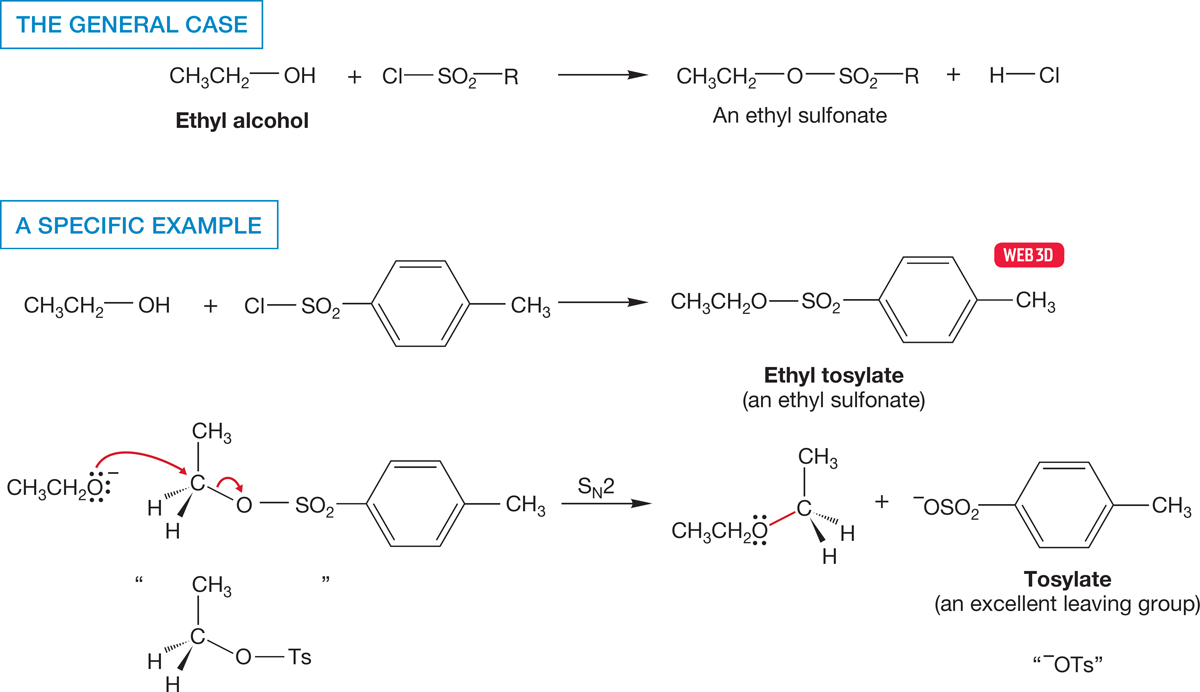
Another technique for changing the leaving group uses a two-step process in which the alcohol is first converted into a sulfonate. Sulfonates are excellent leaving groups (Table 7.6) and can be displaced by all manner of nucleophiles such as ethoxide in the example below to give desirable products (Fig. 7.58). The most common sulfonate is shown in the figure and is known as “tosylate” and abbreviated “−OTs.”
FIGURE 7.58 The conversion of ethyl alcohol into another ethyl derivative. In this sequence of reactions, the poor leaving group OH is first converted into the good leaving group sulfonate. The leaving group is then displaced through an SN2 reaction with a nucleophile, here CH3CH2O−.
PROBLEM SOLVING
The role of the tosylate group is essentially always to leave. It is a generic “good leaving group.” Every time you see it in a problem, you are likely to have to break the C―OTs bond. There should be a little pull-down menu in your head that says “leaving group!” when OTs appears.
There are other common “GO” signs, or clues, in many SN2 problems. Every time you see “SN2” you must think “inversion”—all SN2 reactions go with inversion. There are also good nucleophiles that appear often in SN2 problems. Cyanide (NC−), mercaptide (HS−), and thiolate (RS−) are good examples of ions that should make “good nucleophile” appear in your mental pull-down menu.
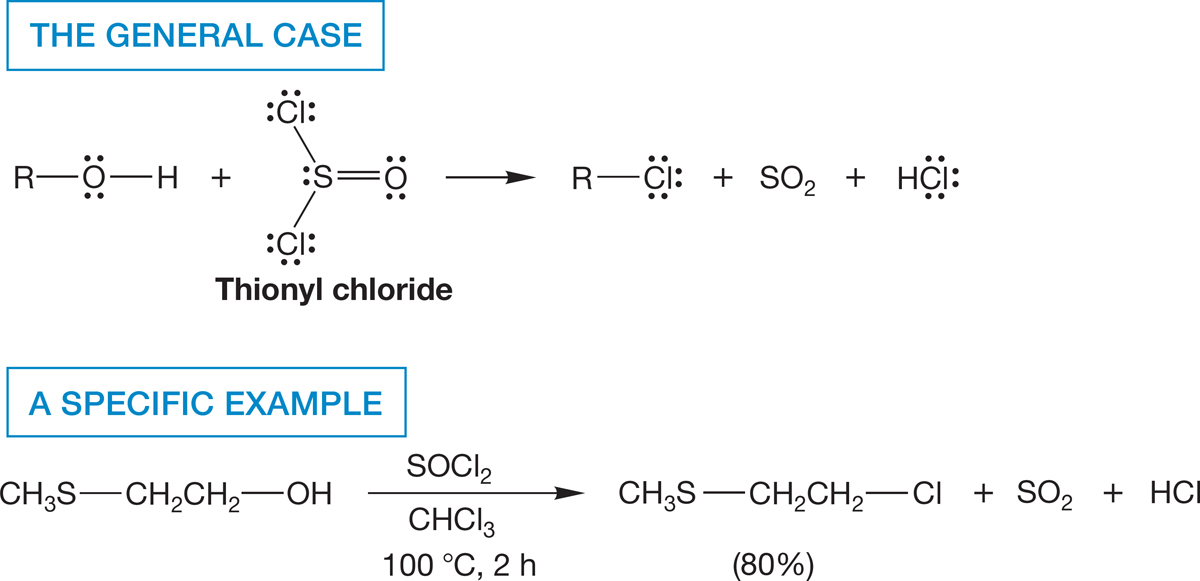
A variation on the sulfonate reaction of Figure 7.57 involves the treatment of an alcohol with thionyl chloride (SOCl2). The end result is the conversion of an alcohol into a chloride (Fig. 7.59).
FIGURE 7.59 Treatment of an alcohol with thionyl chloride results in the formation of an alkyl chloride.
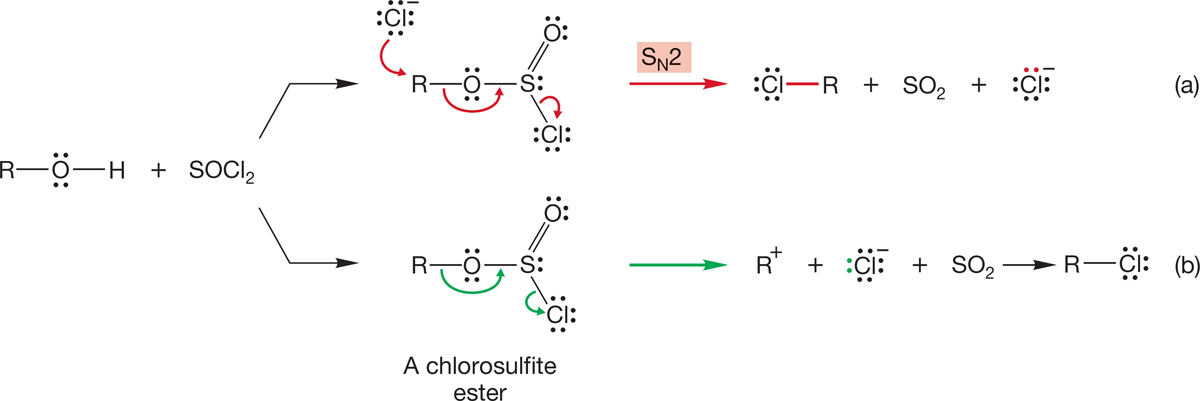
The initial product in this reaction is a chlorosulfite ester. Mechanisms of breakdown of the intermediate chlorosulfite ester involve both SN2 displacement by chloride ion to give the alkyl chloride, sulfur dioxide (SO2), and a chloride ion (Fig. 7.60a), as well as direct decomposition to SO2 and a pair of ions that recombine (Fig. 7.60b). In either case, the end product is the alkyl chloride. Once again, the strategy in this reaction has been to convert a poor leaving group (−OH) into a good one (SO2 and Cl−).
FIGURE 7.60 Mechanisms of chloride formation from reaction of an alcohol with thionyl chloride. (a) The SN2 pathway. (b) Direct decomposition. The mechanism of ester formation will appear in Chapter 18.
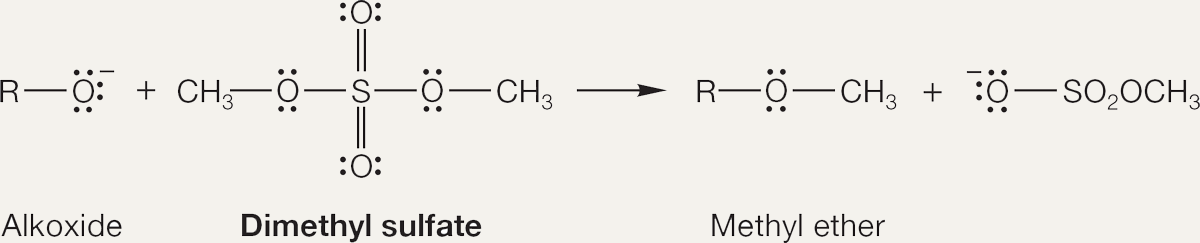
PROBLEM 7.18 Treatment of an alkoxide with dimethyl sulfate leads to methyl ethers. Write a mechanism for this reaction.
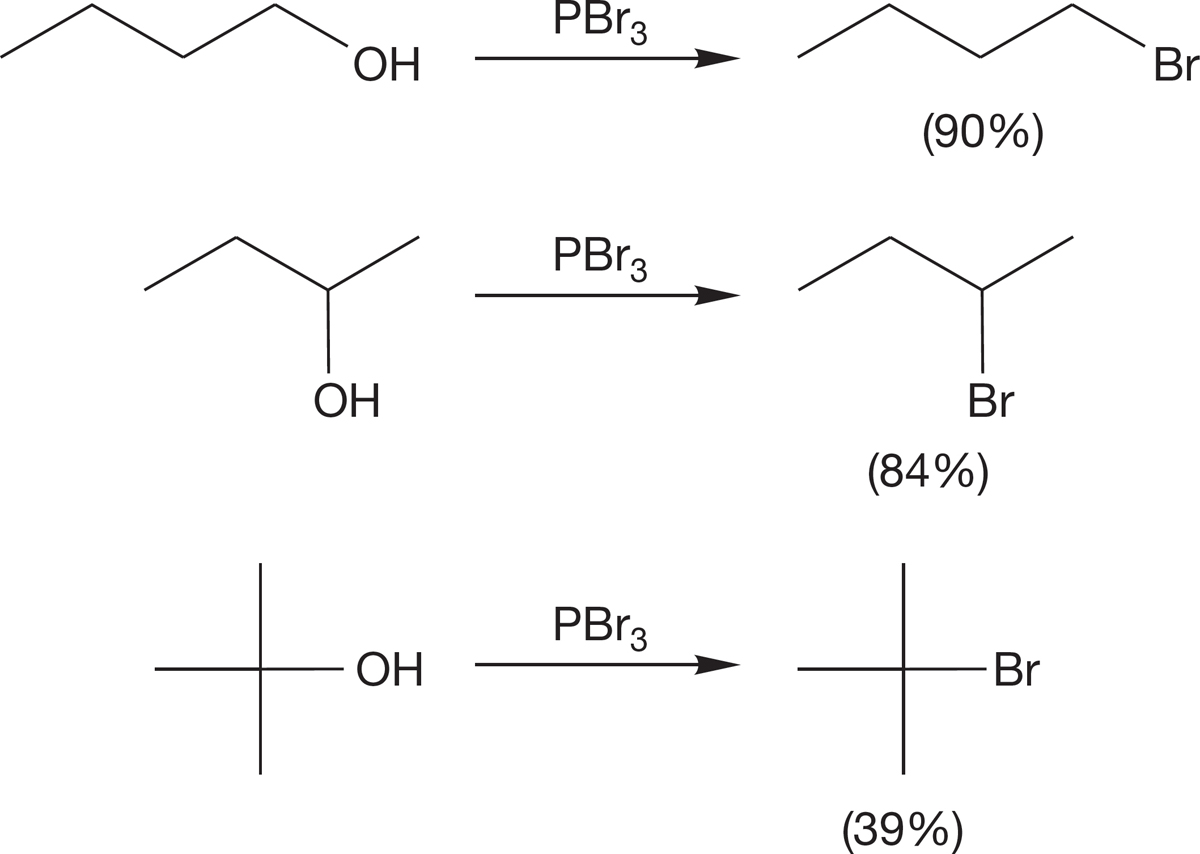
Several related reactions involve the use of phosphorus reagents. Alkyl halides can be made from the treatment of an alcohol with phosphorus halides, PX3 or PX5, as shown in Figure 7.61. Many of these phosphorus-containing reagents cause rearrangement (Chapter 8), especially in secondary systems, and the stereochemical outcome—racemization or inversion―depends on solvent and other reaction conditions. Accordingly, modifications have been worked out in recent years to avoid such stereochemical problems. These phosphorus-based reactions (Fig. 7.61) initially convert the alcohol into a leaving group and a free halide (X−). In a second step, the halide displaces the phosphorylated oxygen. When the stereochemical outcome is inversion, then the second step is an SN2 process. When rearrangement or racemization occurs, the second step cannot be an SN2 process and must involve a carbocation intermediate (see Section 7.7).
FIGURE 7.61 Formations of alkyl halides with phosphorus reagents.
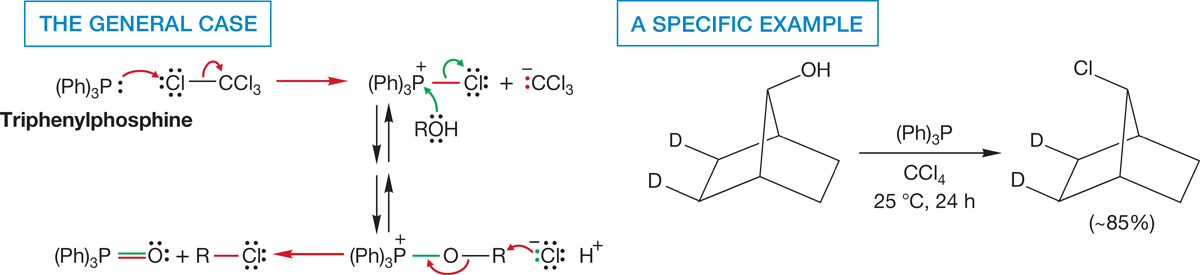
In a similar reaction, alcohols can be converted into the related bromides and chlorides through treatment with triphenylphosphine and a carbon tetrahalide. The alkyl halide is generally formed with inversion, and a rough mechanism involving a series of SN2 reactions is sketched out in Figure 7.62.
FIGURE 7.62 Halides are formed from the reaction of alcohols with the intermediate produced from triphenylphosphine and a carbon tetrahalide.
PROBLEM 7.19 Predict the products for the following reactions:
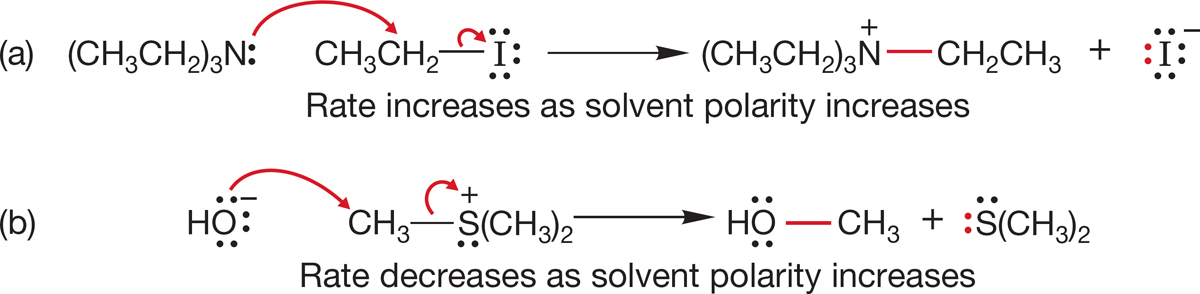
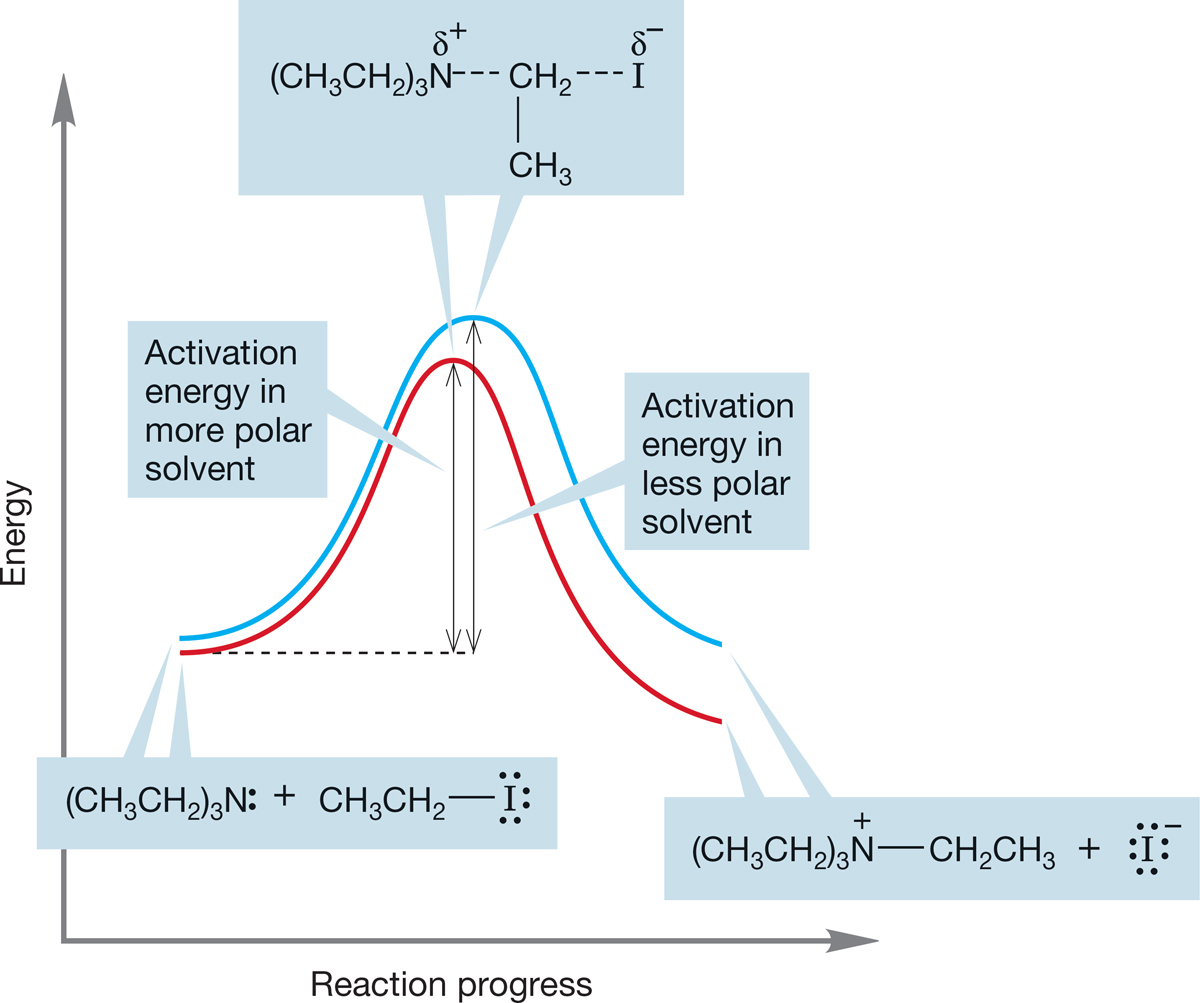
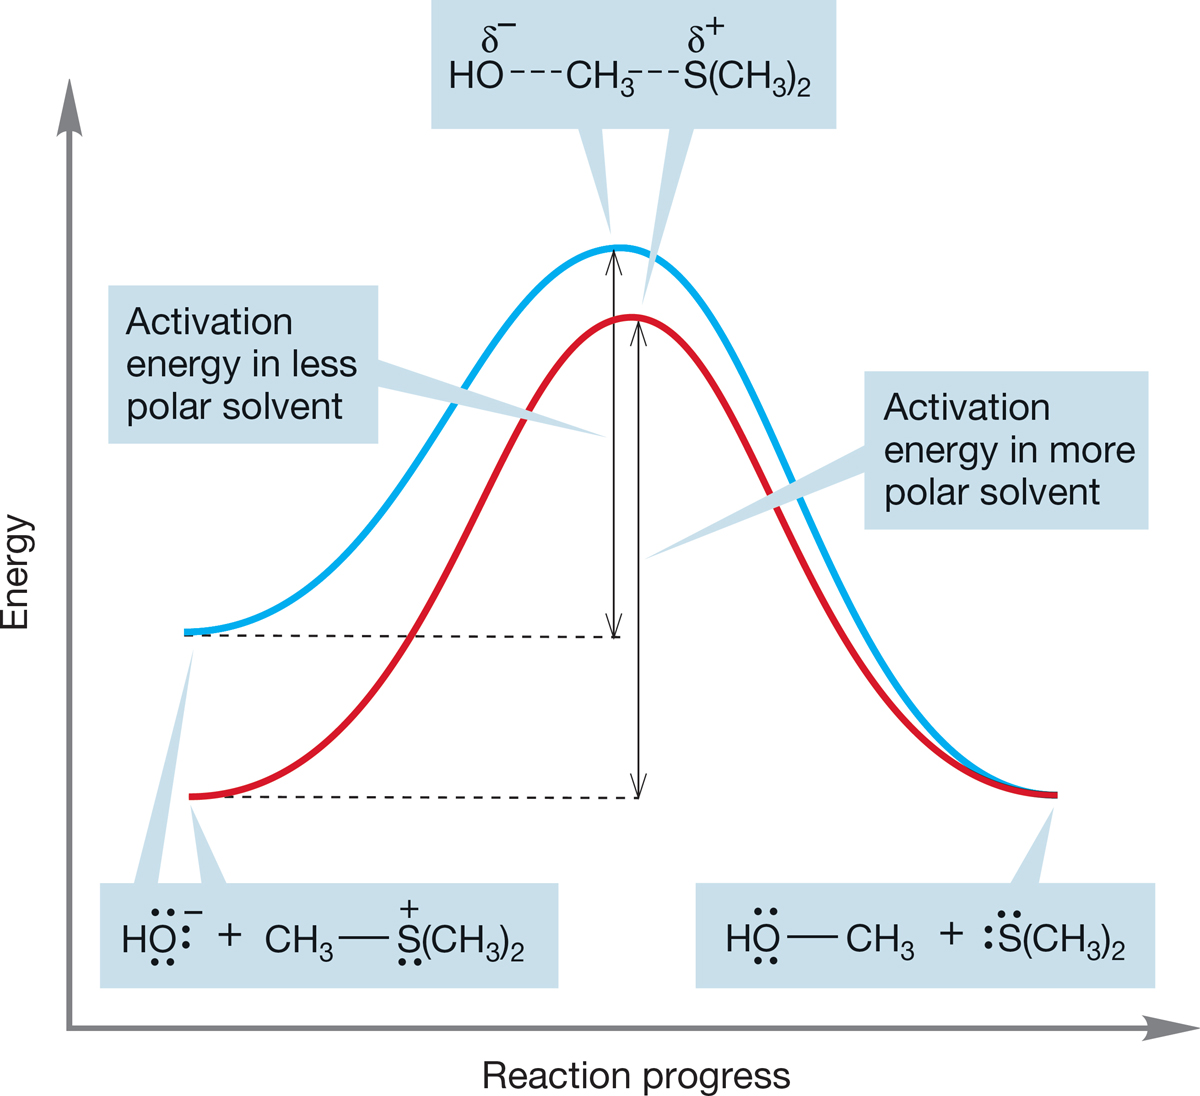
7.5h Effect of Solvent At first, the behavior of the SN2 reaction as the solvent polarity is changed is perplexing. As the solvent polarity is increased, some SN2 reactions go faster, some slower. Two examples are shown in Figure 7.63. In the first reaction (a), a change to a more polar solvent results in a faster reaction, but in the second reaction (b), the rate decreases when the solvent is made more polar.
FIGURE 7.63 Opposite effects of a change in solvent polarity on the rates of two SN2 reactions. Reaction (a) goes faster when the solvent is made more polar, whereas reaction (b) goes more slowly.
There is a way to attack almost every problem that poses a question having to do with rates. The rate of a reaction is determined by the energy of the transition state—the high point in energy as the reaction proceeds from starting material to products. To solve a question involving rates, we must know the structure of the transition state of the reaction.
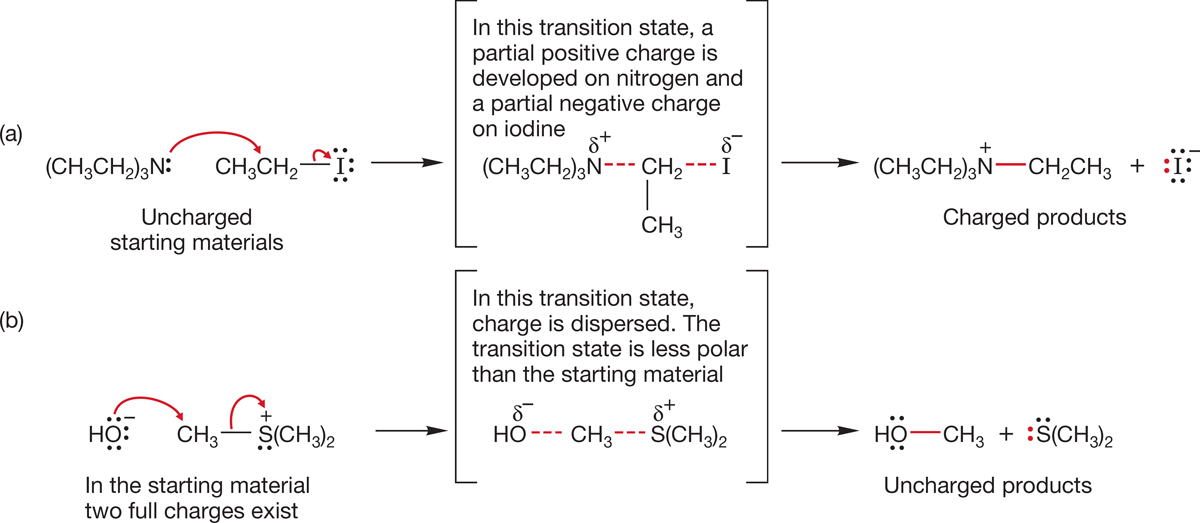
Figure 7.64 shows the structures of the transition states for the two SN2 reactions of Figure 7.63. In reaction (a), a more polar solvent acts to stabilize the charged products and the polar, charge-separated transition state. There is very little effect on the uncharged starting materials in reaction (a). The energy diagram in Figure 7.65 shows what this differential solvation does to the rate of this reaction. The height of the transition state is decreased relative to the starting material, and the reaction goes faster. It takes less energy for the molecules to traverse the barrier when the polarity of the solvent increases.
FIGURE 7.64 The transition state for reaction (a) is more polar than the starting material. The transition state for reaction (b) is less polar than the starting material.
FIGURE 7.65 The difference between the energy of the starting materials and the energy of the transition state is smaller when the reaction is run in a more polar solvent (red curve) and larger when the reaction is run in a less polar solvent (blue curve). The result is a decreased activation energy for the reaction and a faster rate in the more polar solvent.
Reaction (b) is different. Here the starting materials bear full charges. This charge is dispersed as the reaction goes on. A change to a more polar solvent stabilizes the fully charged starting materials more than the transition state or products. Therefore, the activation energy increases and the reaction slows (Fig. 7.66).
FIGURE 7.66 The difference between the energy of the starting materials and the energy of the transition state is larger when the reaction is run in a more polar solvent (red curve) and smaller when the reaction is run in a less polar solvent (blue curve). The result is an increased activation energy for the reaction and a slower rate in a more polar solvent.
Summary
The SN2 reaction—Substitution, Nucleophilic, bimolecular—is common for methyl, primary, and secondary substrates. It is disfavored by steric hindrance in either the substrate (the R group) or the entering nucleophile. It is favored by a strong Lewis base (nucleophile) and a good leaving group. The response of the SN2 reaction to changes in solvent polarity varies with the charge type of the reaction. Each case must be examined individually. The SN2 reaction always involves inversion of configuration at the center of substitution.
4In this discussion, we indicate radioactive iodine with an asterisk in the text and with the asterisk and a yellow circle in the figures.
5Actually, even our picture of the displacement of −:I by −:I* is ever so slightly wrong. Normal iodine (I) is not exactly the same as radioactive iodine (I*), and even this reaction is not truly symmetrical. We can ignore the tiny differences in isotopes, however, as long as we keep the principle straight. If you want to be more correct, insert the words “except for a tiny isotope effect” wherever appropriate.
TABLE 7.3 Average Rates of SN2 Substitution Reactions for Different Groups
R
Average Relative Rate
CH2 CHCH2
1.3
CH3
1
CH3CH2
0.033
CH3CH2CH2
0.013
(CH3)2CH
8.3 × 10⁻⁴
(CH3)3CCH2
2 ×10⁻⁷
(CH3)3C
~0
TABLE 7.4Relative Reactivitiesof Cycloalkyl Bromides in the SN2 Reaction
Compound
Relative Rate
Cyclopropyl bromide
<10−4
Cyclobutyl bromide
8 × 10⁻³
Cyclopentyl bromide
1.6
Cyclohexyl bromide
1 × 10⁻²
Isopropyl bromide
1.0
TABLE 7.5 Relative Nucleophilicities of Some Common Species
Species
Name
Relative Nucleophilicity
Excellent Nucleophiles
NC−
Cyanide
126,000
HS−
Mercaptide
126,000
I−
Iodide
80,000
Good Nucleophiles
HO−
Hydroxide
16,000
Br−
Bromide
10,000
N3−
Azide
8,000
NH3
Ammonia
8,000
NO2−
Nitrite
5,000
Fair Nucleophiles
Cl−
Chloride
1,000
CH3COO−
Acetate
630
F−
Fluoride
80
CH3OH
Methyl alcohol
1
H2O
Water
1
TABLE 7.6 Some Good and Poor Leaving Groups and Their Conjugate Acids
 CHCH2
CHCH2


 . Protonation converts the leaving group from a very poor leaving group, hydroxide, into an excellent leaving group, water (
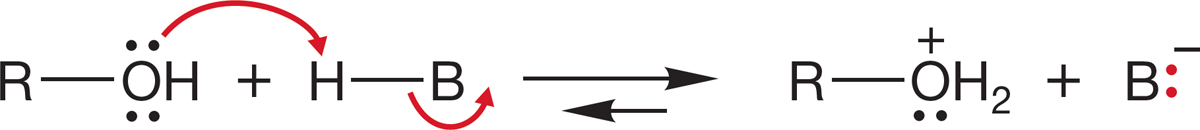
 The role of the tosylate group is essentially always to leave. It is a generic “good leaving group.” Every time you see it in a problem, you are likely to have to break the C―OTs bond. There should be a little pull-down menu in your head that says “leaving group!” when OTs appears.