More information
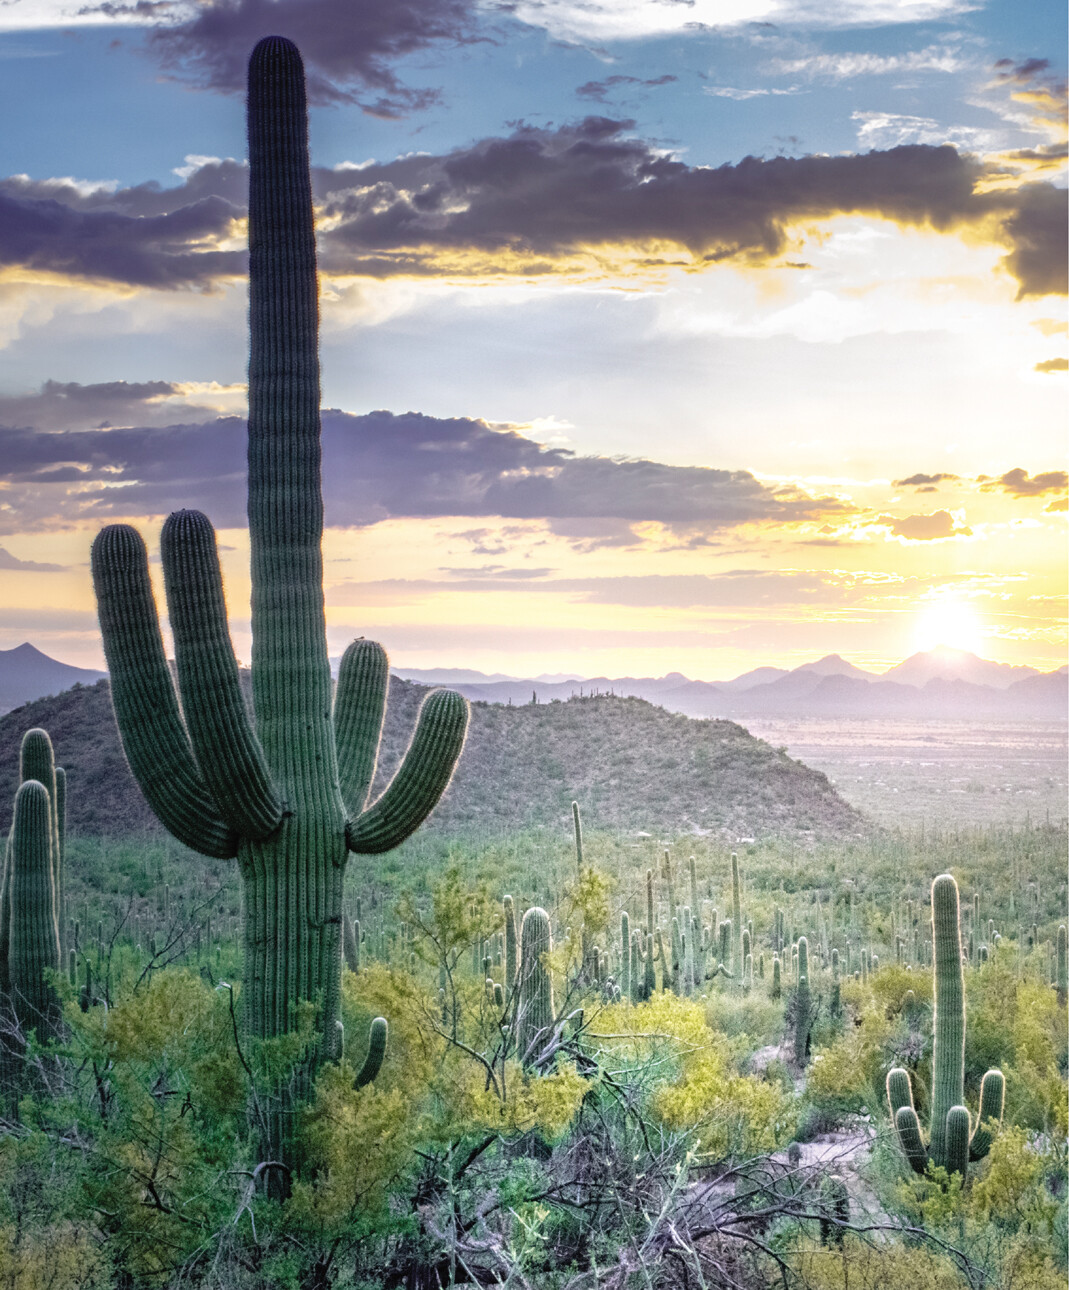
Saguaro cacti rise in the foreground as the Sun peeks above the mountains on the horizon.
The saguaro cacti (Carnegiea gigantea) of the Sonoran desert exhibit a range of adaptations for life in an environment where water is often in short supply.
Southern California is accustomed to fluctuations in rainfall because of El Niño cycles, but from 2000 to 2004 the area suffered a drought that was severe even by California standards. Wild animals suffered. But animals are mobile: They can search out cooler, wetter refuges, for example. Plants can’t.
One species hit hard by this California drought was the mustard plant, Brassica rapa. The growing season for B. rapa normally runs through late spring, until rainfall tapers off. But the 2000–2004 drought dramatically shortened the growing season in Southern California, in particular by reducing the amount of rainfall toward the end of the usual growing season.
So, what does evolutionary theory predict the response to intense drought should be in plants such as B. rapa? Theory predicts that in such scenarios, natural selection should favor plants that flower earlier in their abbreviated growing seasons because these plants will have greater reproductive success by doing so (Inouye 2008; Miller-Rushing and Primack 2008). Steve Franks and his colleagues put this theory to the test using a clever experimental approach (Franks et al. 2007; Franks and Weis 2008, 2009; Franks 2011).
Franks and his colleagues wanted to test the hypothesis that selection had shifted the flowering time of B. rapa plants, so that post-drought plants flowered earlier than pre-drought plants of the same regional populations. Obtaining post-drought plants was easy enough—the researchers simply went out to the field in late 2004 and collected them. Fortunately, Franks and his team had been studying this population of B. rapa for many years, and they had collected seeds in 1997, just a few years before the drought (Franks et al. 2008). Because they had this foresight, they could directly compare pre-drought and post-drought seed stocks.
EXPERIMENTATION AND DATA QUESTION
Perhaps the most straightforward way to make this comparison would be to plant both the 1997 seeds and the 2004 seeds and look at differences in flowering times between the two groups. Pause for a moment, though. Can you see any potential problems with this approach? How would you design an experiment to get around them?
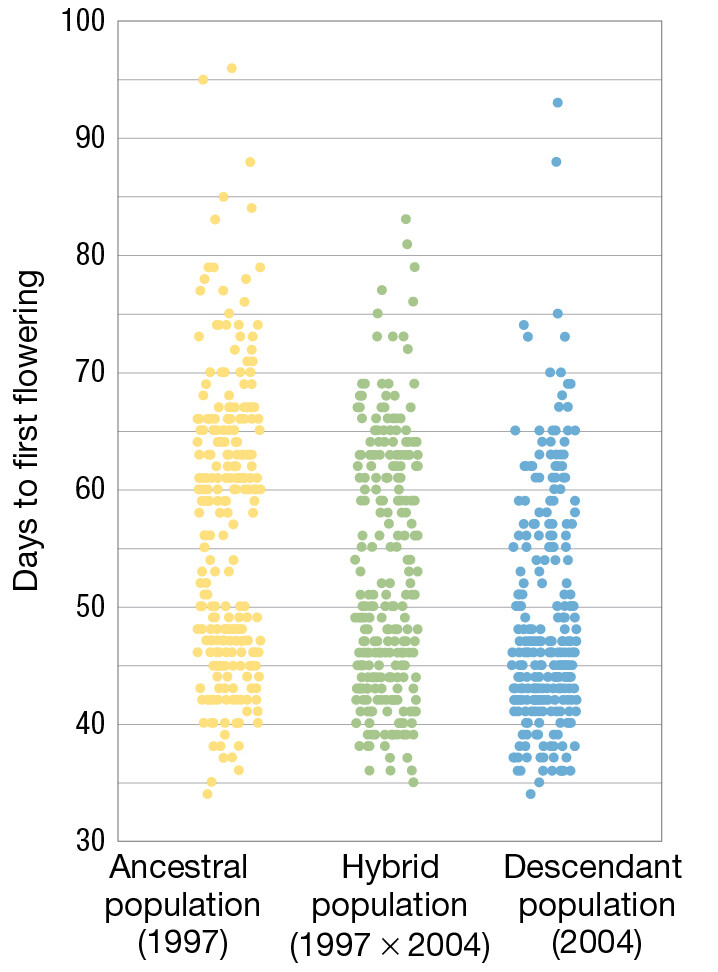
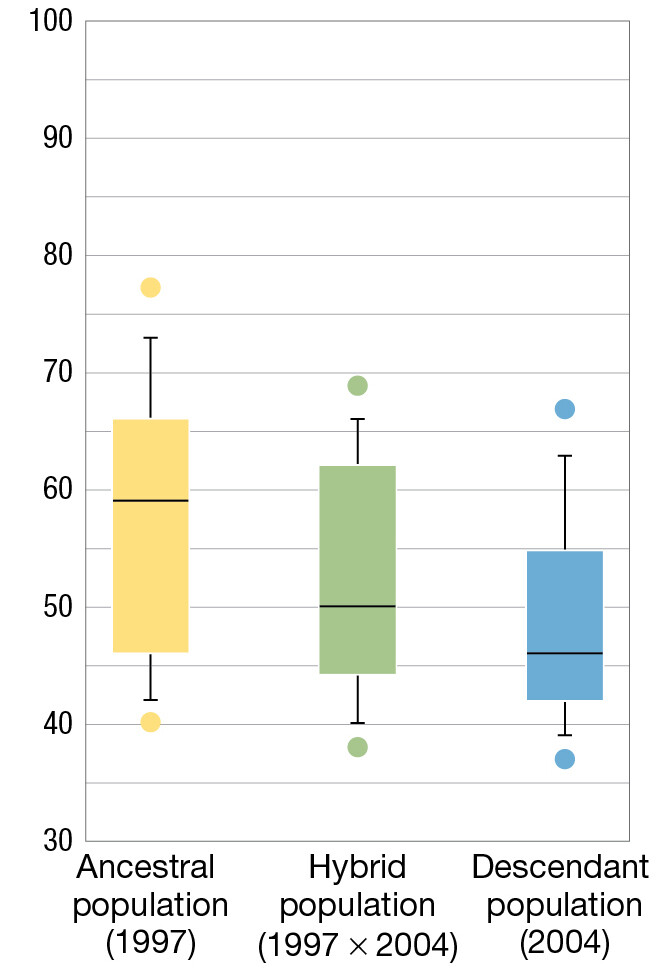
The problem with simply planting the two groups of seeds and measuring flowering times is that it’s not an apples-to-apples comparison. The 1997 seeds were seven years older than the 2004 seeds—and seed age might influence the plants’ physiology in any number of ways. Franks and colleagues found an ingenious solution to the problem. They needed seeds with the genetic material from 1997, but of the same age as seeds with the genetic material from 2004. To produce these, they first grew adult plants from the 1997 and 2004 seeds. In this way they obtained a supply of fresh seeds from 1997 parents and a separate supply of fresh seeds from 2004 parents. Next three lines were created: a 1997 × 1997 line, a 2004 × 2004 line, and a hybrid 1997 × 2004 line. Then seeds from each were grown under similar conditions, allowing Franks and colleagues to test whether natural selection had affected flowering times as they predicted. They found that plants derived from the seeds of the 2004 parents flowered earlier, on average, than plants derived from the seeds of the 1997 parents, and hybrid plants flowered sometime in between the two” (Figure 3.1). As predicted, flowering times had shortened from 1997 to 2004 as a result of natural selection imposed by the drought.
A
More information
This graph has three independent variables: the ancestral population in 1997, the hybrid population, and the descendant population in 2004. The dependent variable is the days to first flowering, ranging from 30 to 100. Data points are recorded in a vertical band for each population. There is wide variation within each population, but the average number of days to first flowering is clearly greatest for the ancestral population and least for the descendant population.
B
More information
This box and whisker plot graph has three independent variables: the ancestral population in 1997, the hybrid population, and the descendant population in 2004. The dependent variable is the days to first flowering. For the ancestral population, the range of the whiskers is from 42 days to 73 days. The box covers 46-66 days with the median at 59 days. For the hybrid population, the whisker range is 40 to 66 days, the box range is from 44 to 62 days, and the median is 50 days. For the descendant population, the whisker range is 39 to 63 days, the box range is 42 to 55 days, and the median is 46.
C
More information
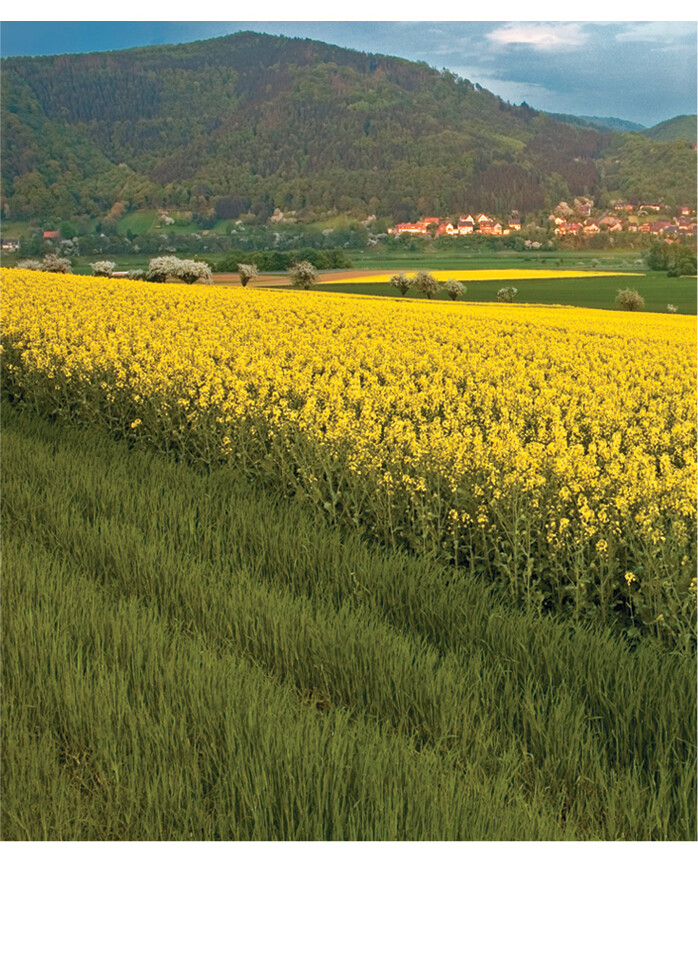
A crop of flowering Brassica rapa. The flowers are bright yellow. A town is visible in the distance.
The process of natural selection has played an essential role in driving the endless modifications that lead to the biological diversity of the living world. We have discussed this process in general terms, but we are now ready for a more detailed exploration of natural selection. We are also ready to move from Darwin’s discoveries to the specific manifestation of his theory in contemporary evolutionary biology.
In this chapter, we will examine the following questions:
- What are the components of natural selection?
- What is an adaptation, and how do we study adaptations?
- How can natural selection be examined in the wild and in the laboratory?
- How do complex traits originate?
- Why are there constraints on natural selection, and what are these constraints?